
While 2014 was a banner year for new building filings in the five boroughs with 44,817 new units entering the DOB pipeline, 2015 saw a substantial decrease in activity. With 33,973 units filed in new developments over the course of last year, year-over-year filings decreased by almost 25%.
Fortunately, within the context of New York City’s recent history, the overall decrease led to total numbers that were far from dismal. In fact, 2015 still had over 50% more filings than 2013, which itself was a relatively good year by historical standards, with 22,915 new units entering the pipeline.
The real story in 2015 was a shift in the city’s distribution of new construction, combined with behind-the-scenes uncertainty surrounding new rules at the DOB and 421-A tax abatements.
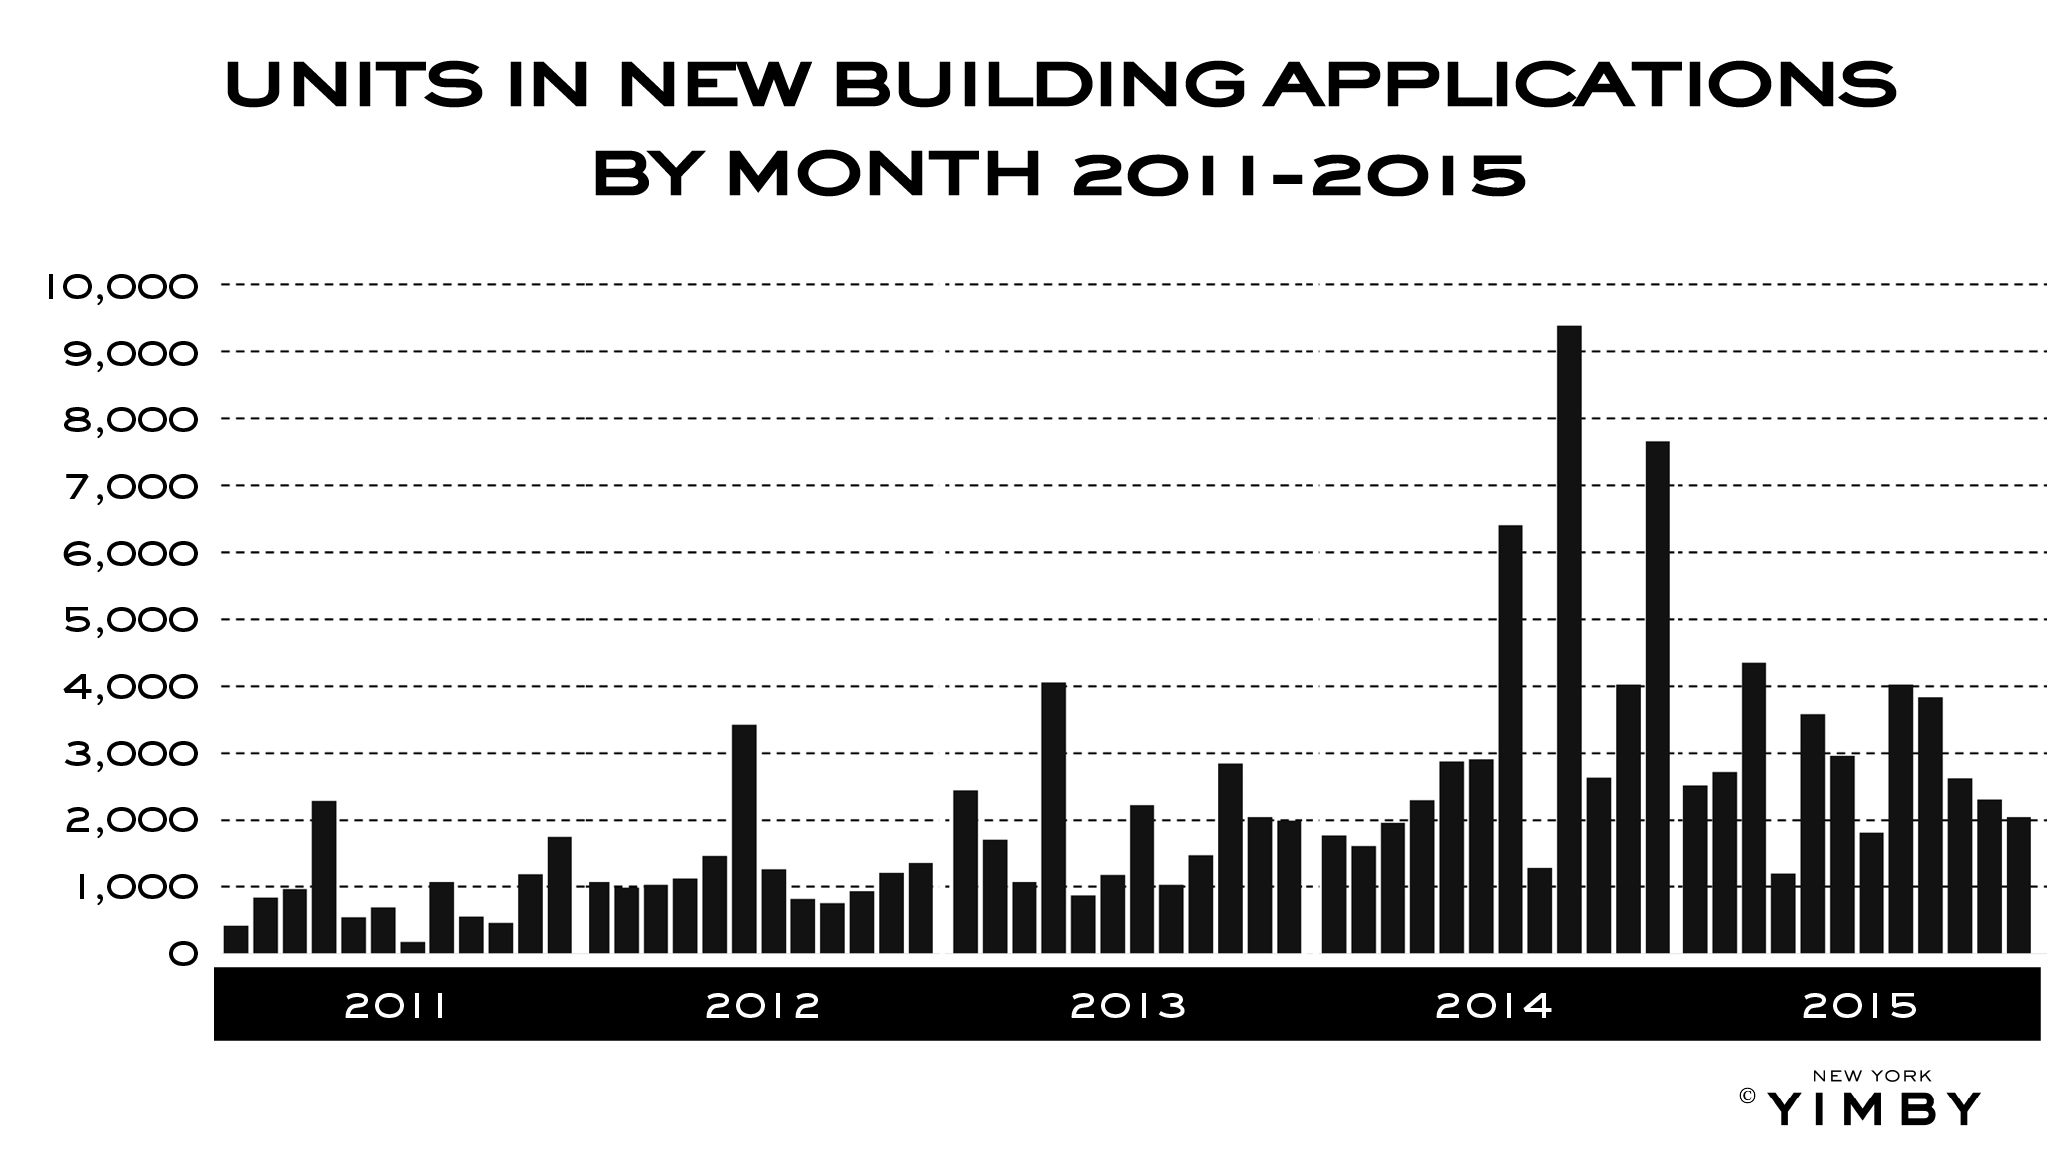
Back in 2014, numbers were artificially inflated in the second half of the year due to anticipated changes in the DOB’s building codes. The deadline for filings was first pushed to September, and then December — resulting in corresponding surges in applications for new construction in those months.
The month-over-month changes between 2015 and 2014 reflect this disparity, and there was no feasible way that 2015 would match 2014’s absurd highs, which maxed out in September of that year, when the city saw 9,390 new units filed over a 30-day period. The full 2015 download is available at the link, which breaks down the numbers by project and community board as well.
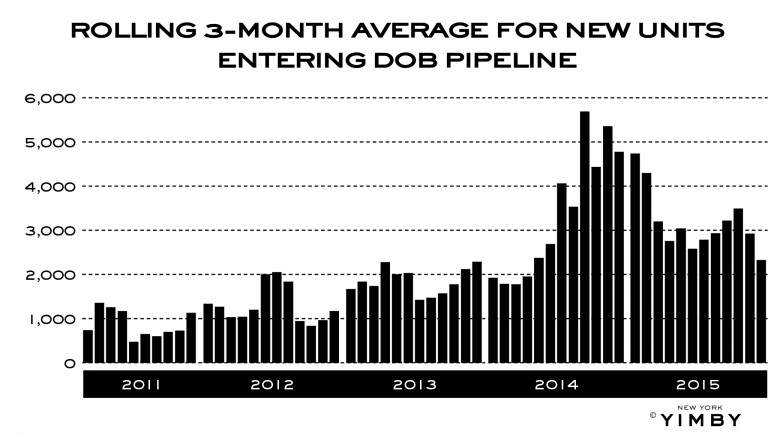
The most active month of 2015 was March, with 4,353 new units entering the DOB pipeline, followed by August, when another 4,020 units entered the pipeline. Both of these numbers represented an increase over the previous year’s respective monthly figures, and best illustrate why the bump in 2014 was caused by artificial spikes rather than a legitimate and continuous surge in applications.
In fact, the first six months of 2015 actually saw a substantial increase in new units entering the pipeline compared to the year before, with 17,330 units filed compared to only 13,415 in 2014.
But while the early months of 2015 brought good news, the last few months saw solid year-over-year declines, even compared to the normal months in late 2014 where architects and developers did not have to pre-empt DOB deadlines.
Activity fell dramatically between late 2015 and late 2014, with 16,643 units submitted in the closing months of this past year. That compares against 31,402 units filed in the last six months of 2014. More notably, every single month besides August saw a year-over-year decrease.
The artificial bumps of 2014 clearly contributed to a banner year in permit activity, but this was also due to excellent market conditions, which clearly prevailed into the first half of 2015. By September however, things appear to have taken a more legitimate downturn, with filing activity lagging 2014 by more than half on a consistent basis.
Though the overall picture may have gone from great to merely decent, parsing the data by borough shows more distinct trends.
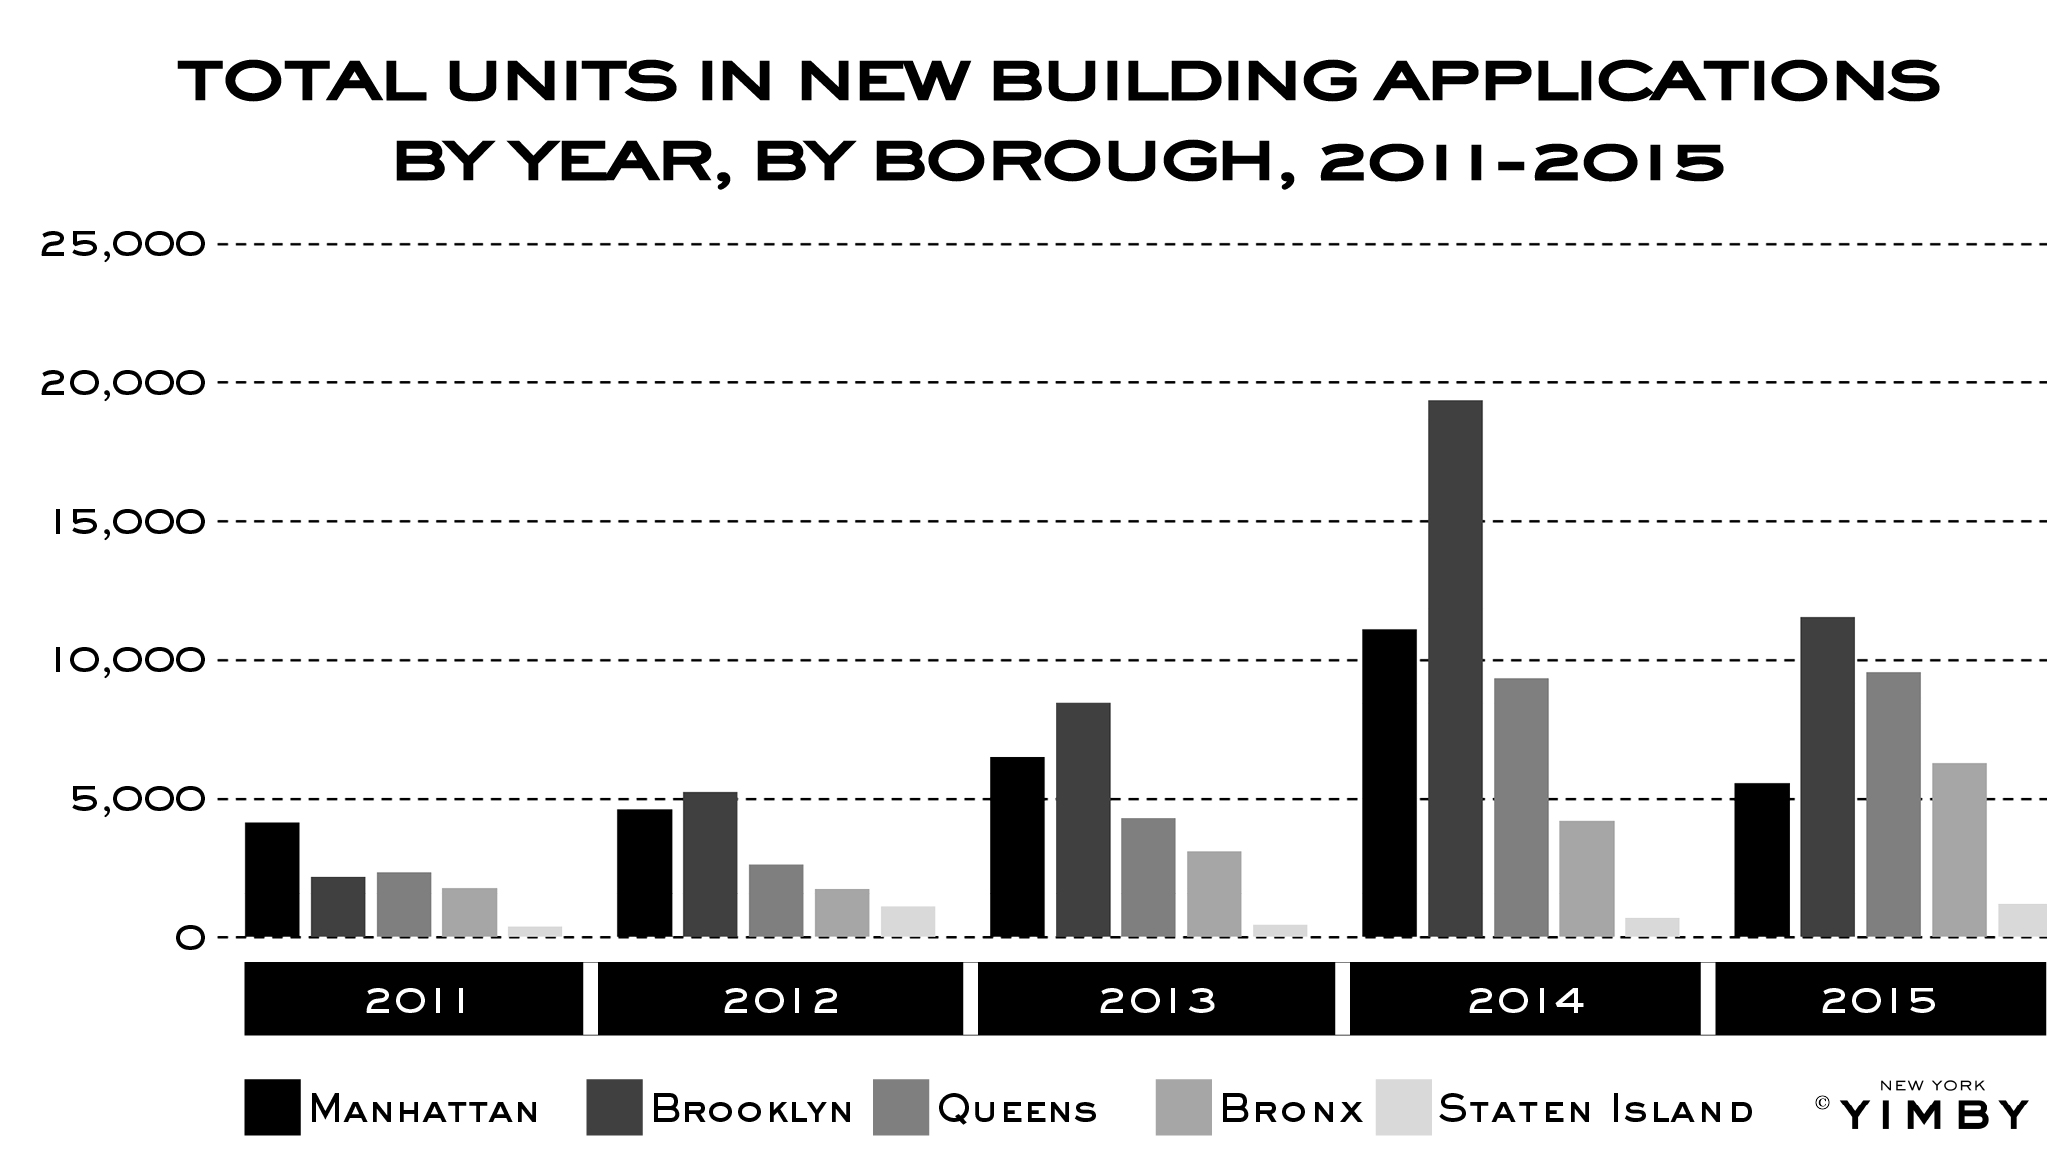
Manhattan was the most severely affected in 2015, and activity fell by nearly 50% overall, dropping from 11,130 new filings in 2014 down to 5,593 in 2015. Brooklyn was hit almost as badly, with new units entering the pipeline falling 40%, from 19,355 in 2014 to 11,554 in 2015
Both of those drops likely reflect land prices that are becoming increasingly unrealistic. But in a city as large and dynamic as New York, an abundance of further-flung neighborhoods ensures that deals are still to be had, and this was reflected in the numbers across the other three boroughs.
Filing activity in Queens remained relatively stable, with a small year-over-year increase of 224 units, resulting in a 2015 tally of 9,591 units entering the pipeline.
Numbers in the Bronx and Staten Island were much more impressive, with the Bronx seeing the largest numerical year-over-year increase in activity, with filings rising from 4,245 in 2014 to 6,317 in 2015 — a jump of almost 50%.
Evidently developers saw a similar increase in opportunities across Staten Island, where numbers of units entering the pipeline increased from 720 in 2014 to 1,214 in 2015 — showing a very impressive jump of 68.6%.
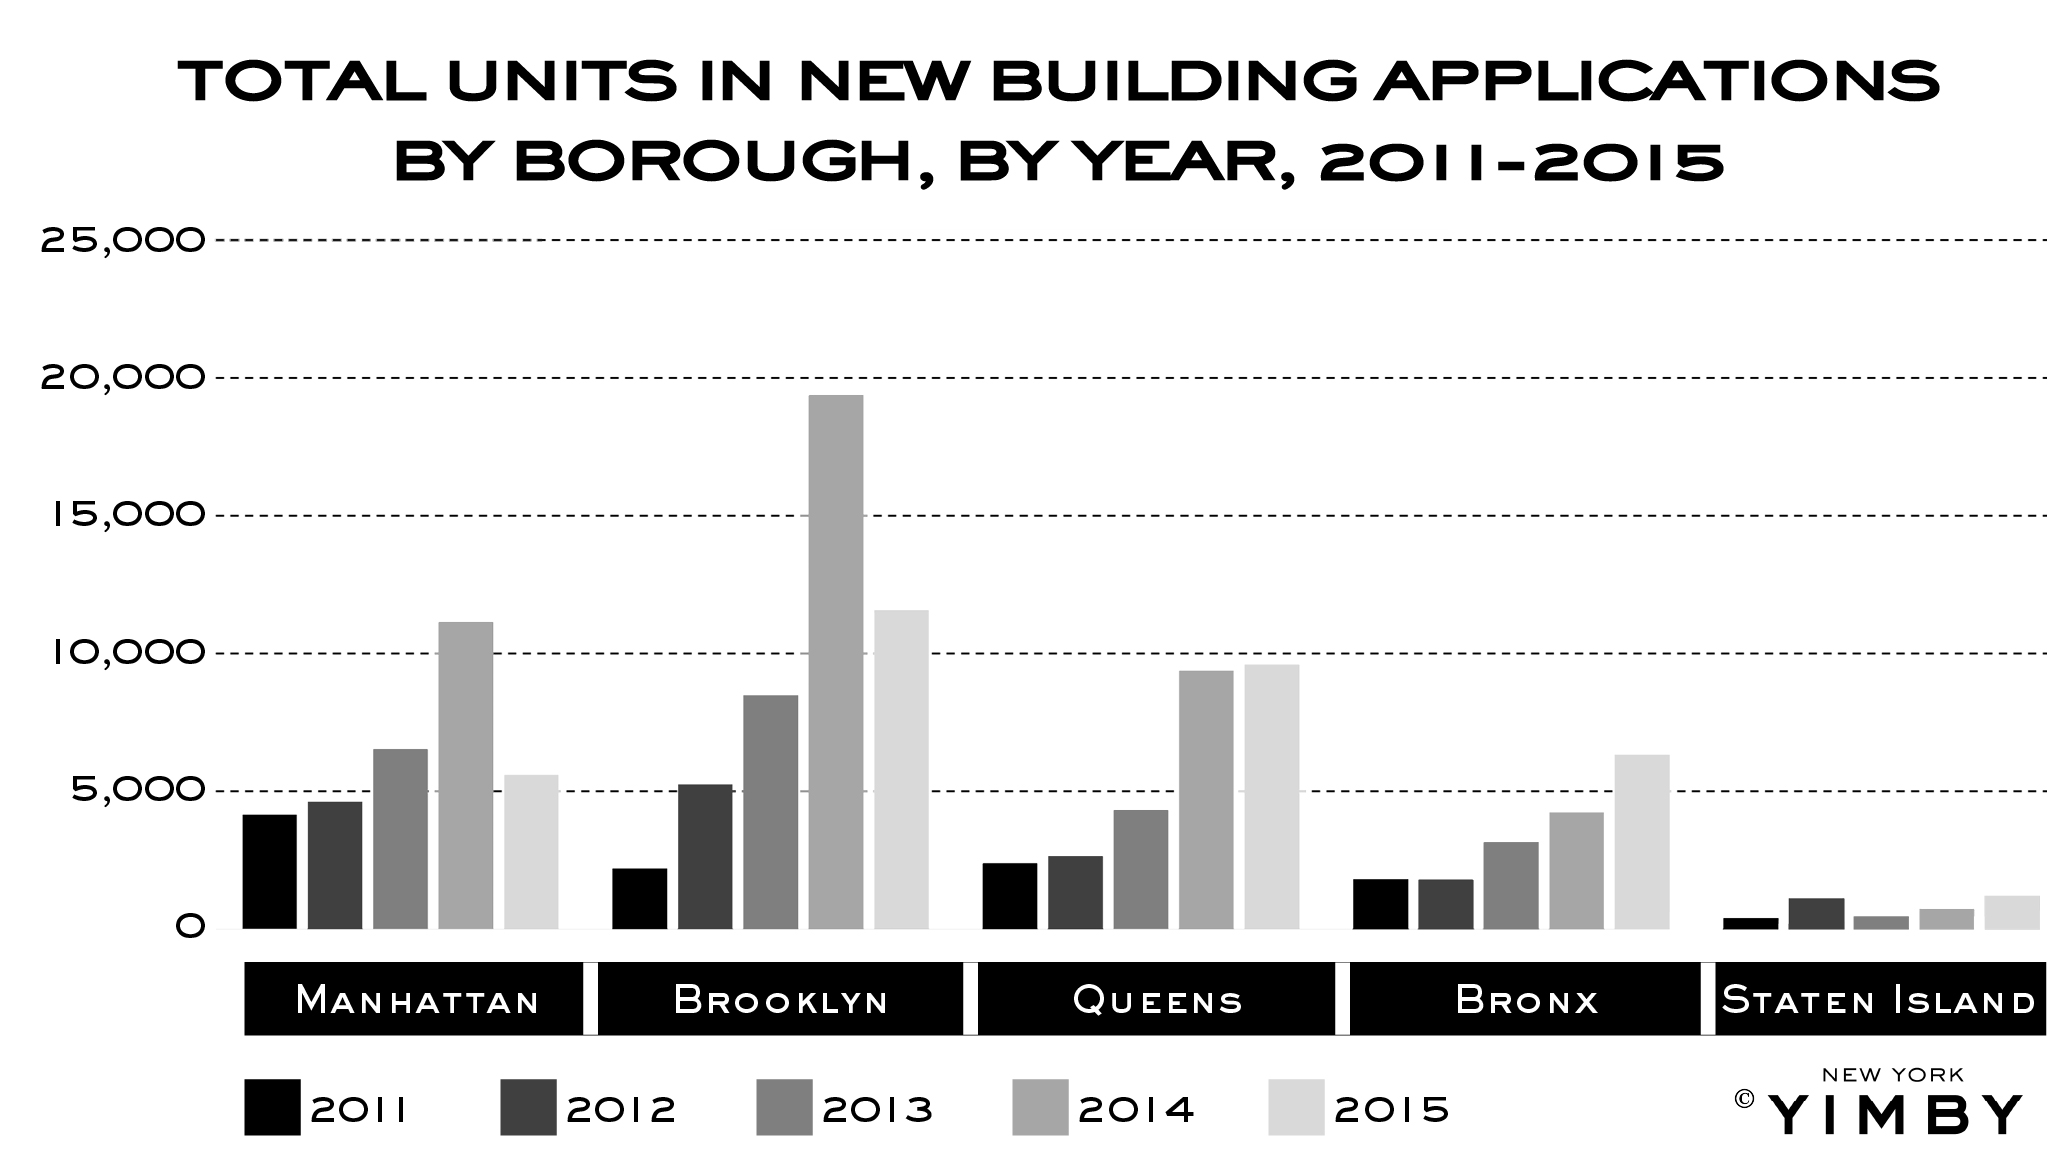
Comparing the year-over-year numbers by borough shows a clear trend towards more development in peripheral neighborhoods that have remained less affected by skyrocketing land prices, while the hottest areas in Manhattan and Brooklyn have cooled off significantly, as developers have realized that some neighborhoods may be experiencing inflated land prices.
Just as important as the inflated land prices is remaining uncertainty over what the De Blasio administration is actually doing. There is still no answer regarding 421-A’s future, and while several press recent press releases have touted continued success regarding affordable housing, these numbers represent permits being pulled as developers rushed to get foundations in the ground this past June, prior to the anticipated end of the tax abatements. Again, this surge was borne out of political uncertainty originating with De Blasio rather than any significant action taken to promote new affordable housing.
What does all of this mean for 2016? The picture is unclear. The Mayor’s policy on housing seems to be a series of ad-libbed responses rather than any type of cohesive plan to promote affordability, and consequently, all types of development are likely to be affected by continued uncertainty regarding what is actually happening, since no-one in local government seems to have any idea what is going on.
Subscribe to YIMBY’s daily e-mail
![]()
Follow YIMBYgram for real-time photo updates
Like YIMBY on Facebook
Follow YIMBY’s Twitter for the latest in YIMBYnews


The S.I. market is very different from the rest of NYC. Mostly 1 and 2 family homes. We are in our own little real estate world out here.
can you show us statistics for construction completions (e.g., number of units receiving certificates of occupancy) in addition to just units entering the pipeline? many of these planned construction projects may not pan out.
Agreed with mervhughes. New c of o’s is one of the data points we need. Also useful is the number of units lost. I’m not sure why these units are never reported in the press.
Aren’t we trying to figure out the net addition of units? Don’t we need to know how many units were demolished – if we demo a 10 unit building to build a 25 unit building isn’t it important to note the 10 lost units? – or what if an 8 unit townhouse is turned into a single family home – why count that as one new unit? Shouldn’t we count it as 7 lost units? Or what about a condo/coop owner who buys his neighbor’s apartment and combines the units. Do we count that lost unit? Or what about all of the units lost to hurricane Sandy – or those converted to hotels – etc
The net change in units is what we all want to know.