

According to the cumulative data for permit filings for new construction in New York City in 2022, the Big Apple’s construction scene has some rather positive numbers to report. The data from the Department of Buildings shows that, over the course of the year, the city’s developers filed for a total of 3,225 new buildings, a 60 percent increase over last year’s tally of 2,017 permits. The total volume of new filed-for floor space also rose from 53 million square feet in 2021 to 66 million square feet in 2022. The combined volume of new residential and hotel unit filings increased from 45,019 in 2021 to 49,965 in 2022, and the full report in Excel format is available with a subscription to YIMBY’s Building Wire.
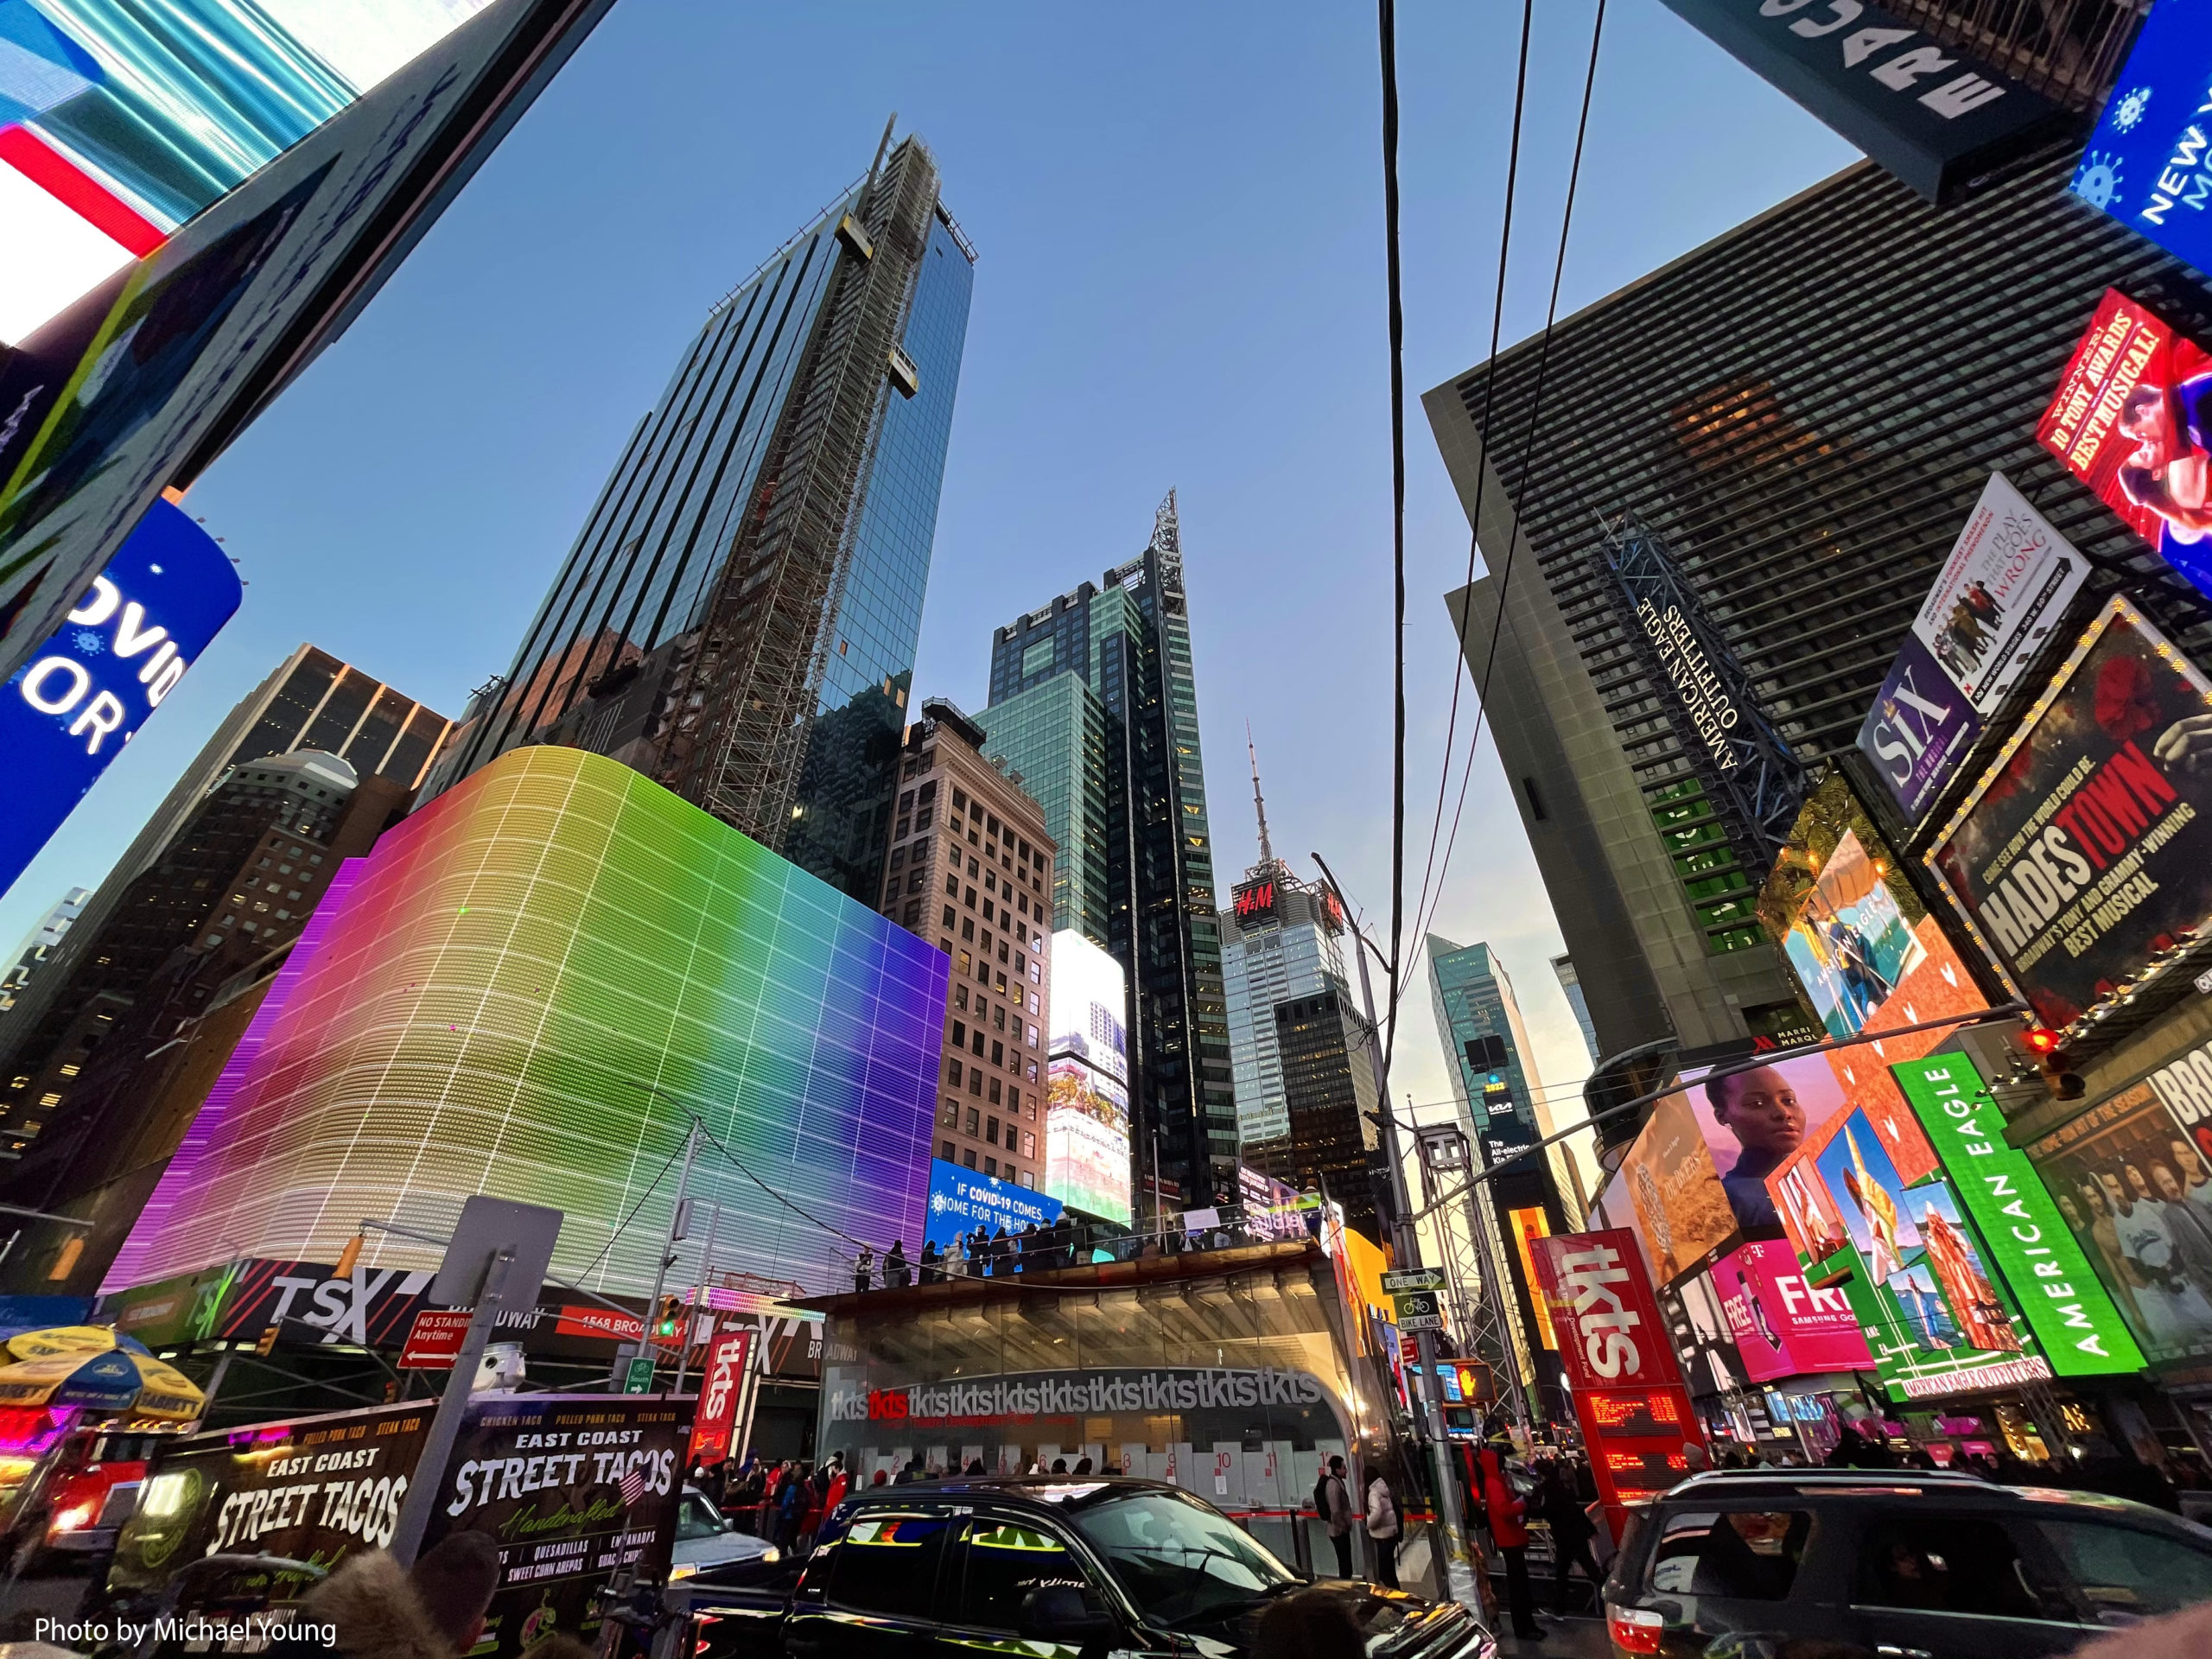
TSX Broadway. Photo by Michael Young
Number of permit filings per month
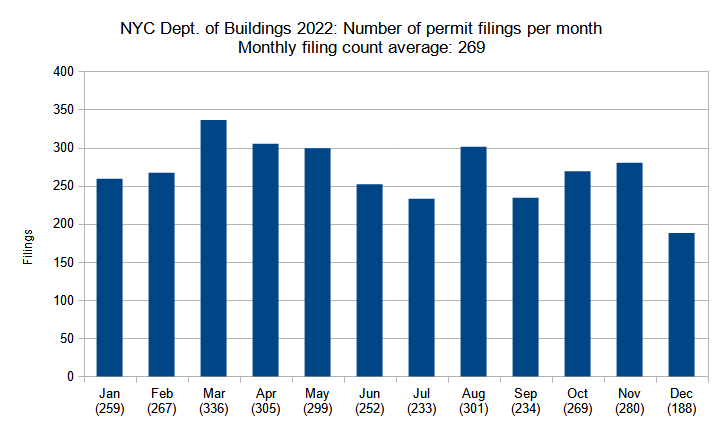
Number of new construction permits filed per month in New York City in 2023. Data source: the NYC Department of Buildings. Data aggregation and graphics credit: Vitali Ogorodnikov
Over the course of the year, the general numbers of monthly new building filings remained consistent, perhaps trending slightly downward toward the end of the year. Although most monthly tallies registered rather close to the yearly average of 269, the highest monthly count (March, with 336 filings) almost doubles the lowest number (December, with 188 filings).
The slight downward trend contrasts with last year, which saw a steady rise in filings over its course. That increase culminated with this year’s outstanding showing, where even the lowest monthly tally easily surpasses 2021’s monthly average of 168. If last year’s best-performing month (December, with 219 filings) were to be counted for this year, it would register as the year’s second-worst performer.
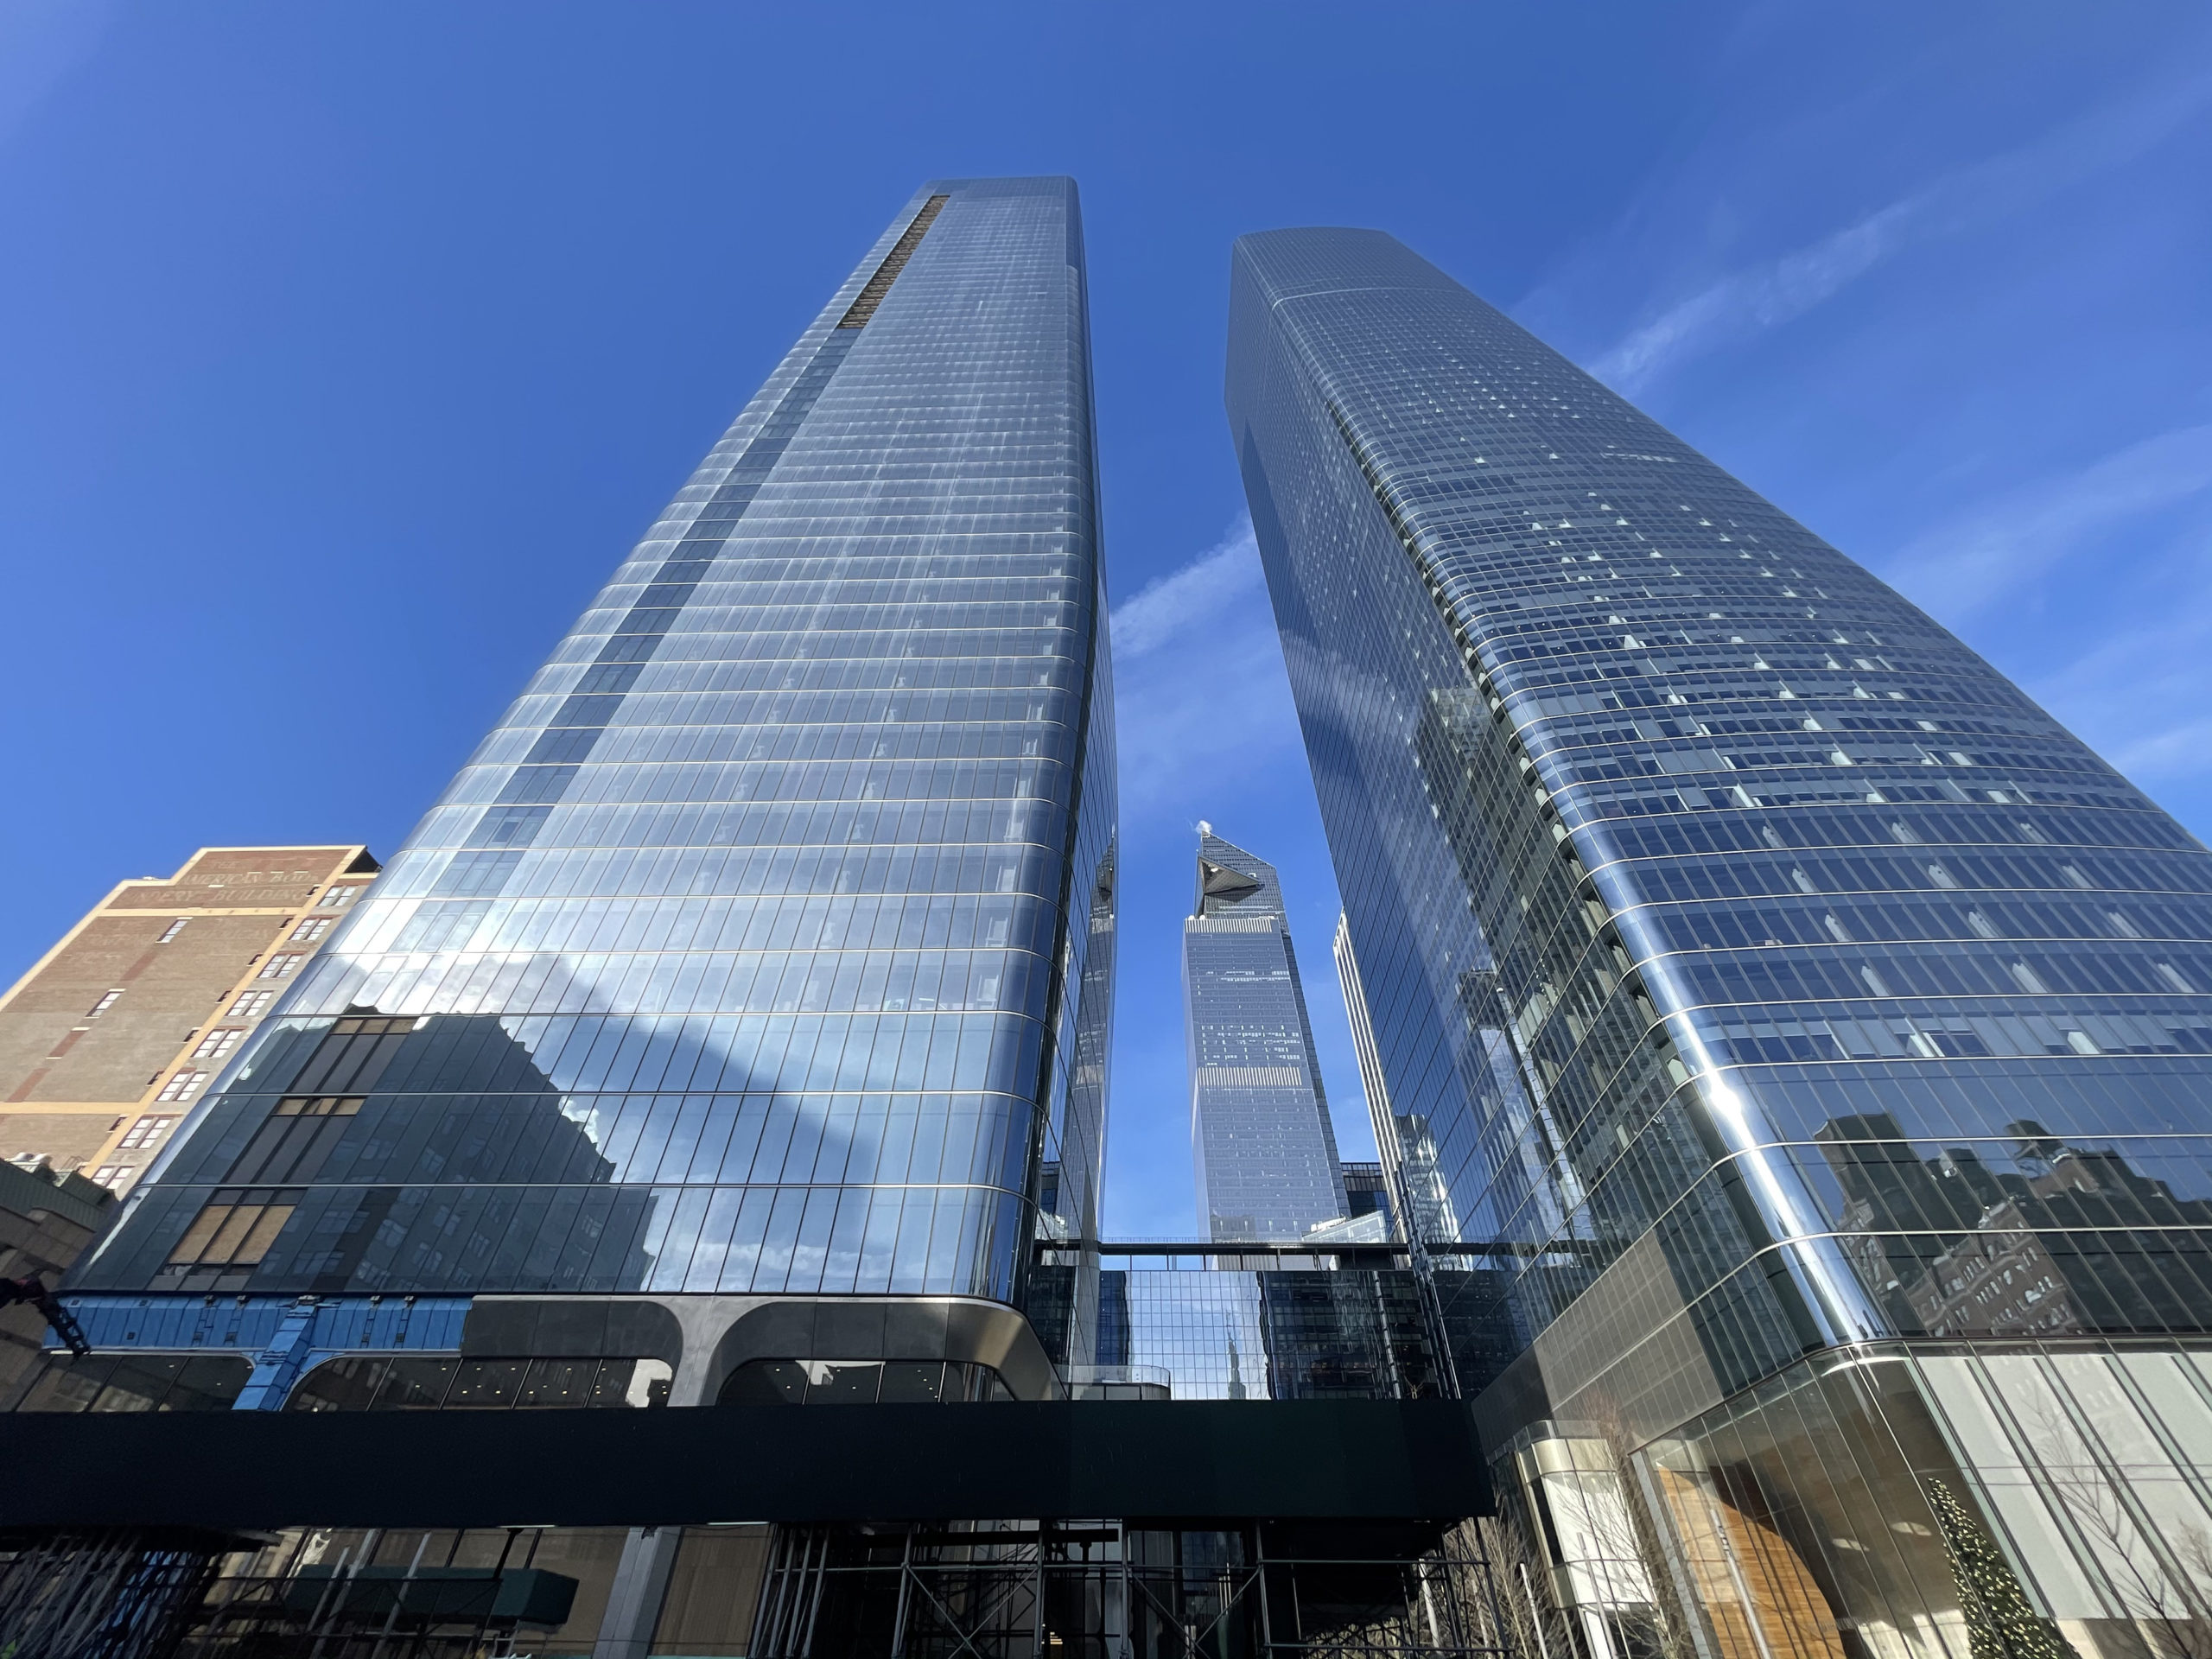
Manhattan West. Photo by Michael Young
Number of permit filings by borough
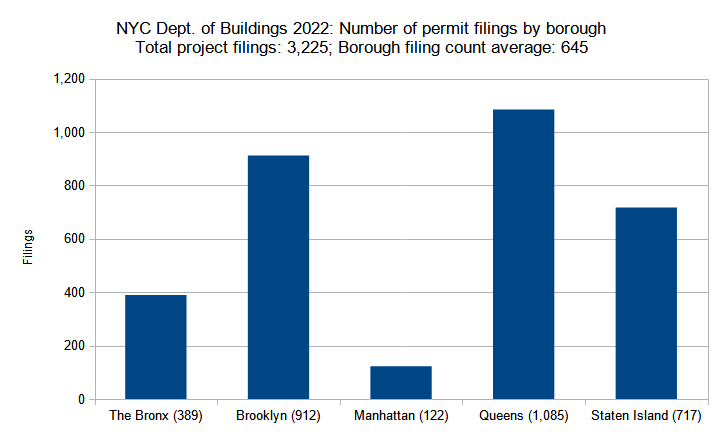
Number of new construction permits filed per borough in New York City in 2023. Data source: the NYC Department of Buildings. Data aggregation and graphics credit: Vitali Ogorodnikov
At first glance, the charts for total filings per borough for 2021 and 2022 look almost identical. Just as last year, Queens leads the pack, with moderately decreasing figures for Brooklyn, then Staten Island, The Bronx, and finally, Manhattan.
Although the ratios apparently remained quite stable, the total volume displayed a significant surge. Between 2021 and 2022, the number of filings increased as follows: Queens, from 743 to 1,085; Brooklyn, from 195 to 389; Manhattan, from 93 to 112; The Bronx, from 195 to 389; and Staten Island, from 430 to 717.

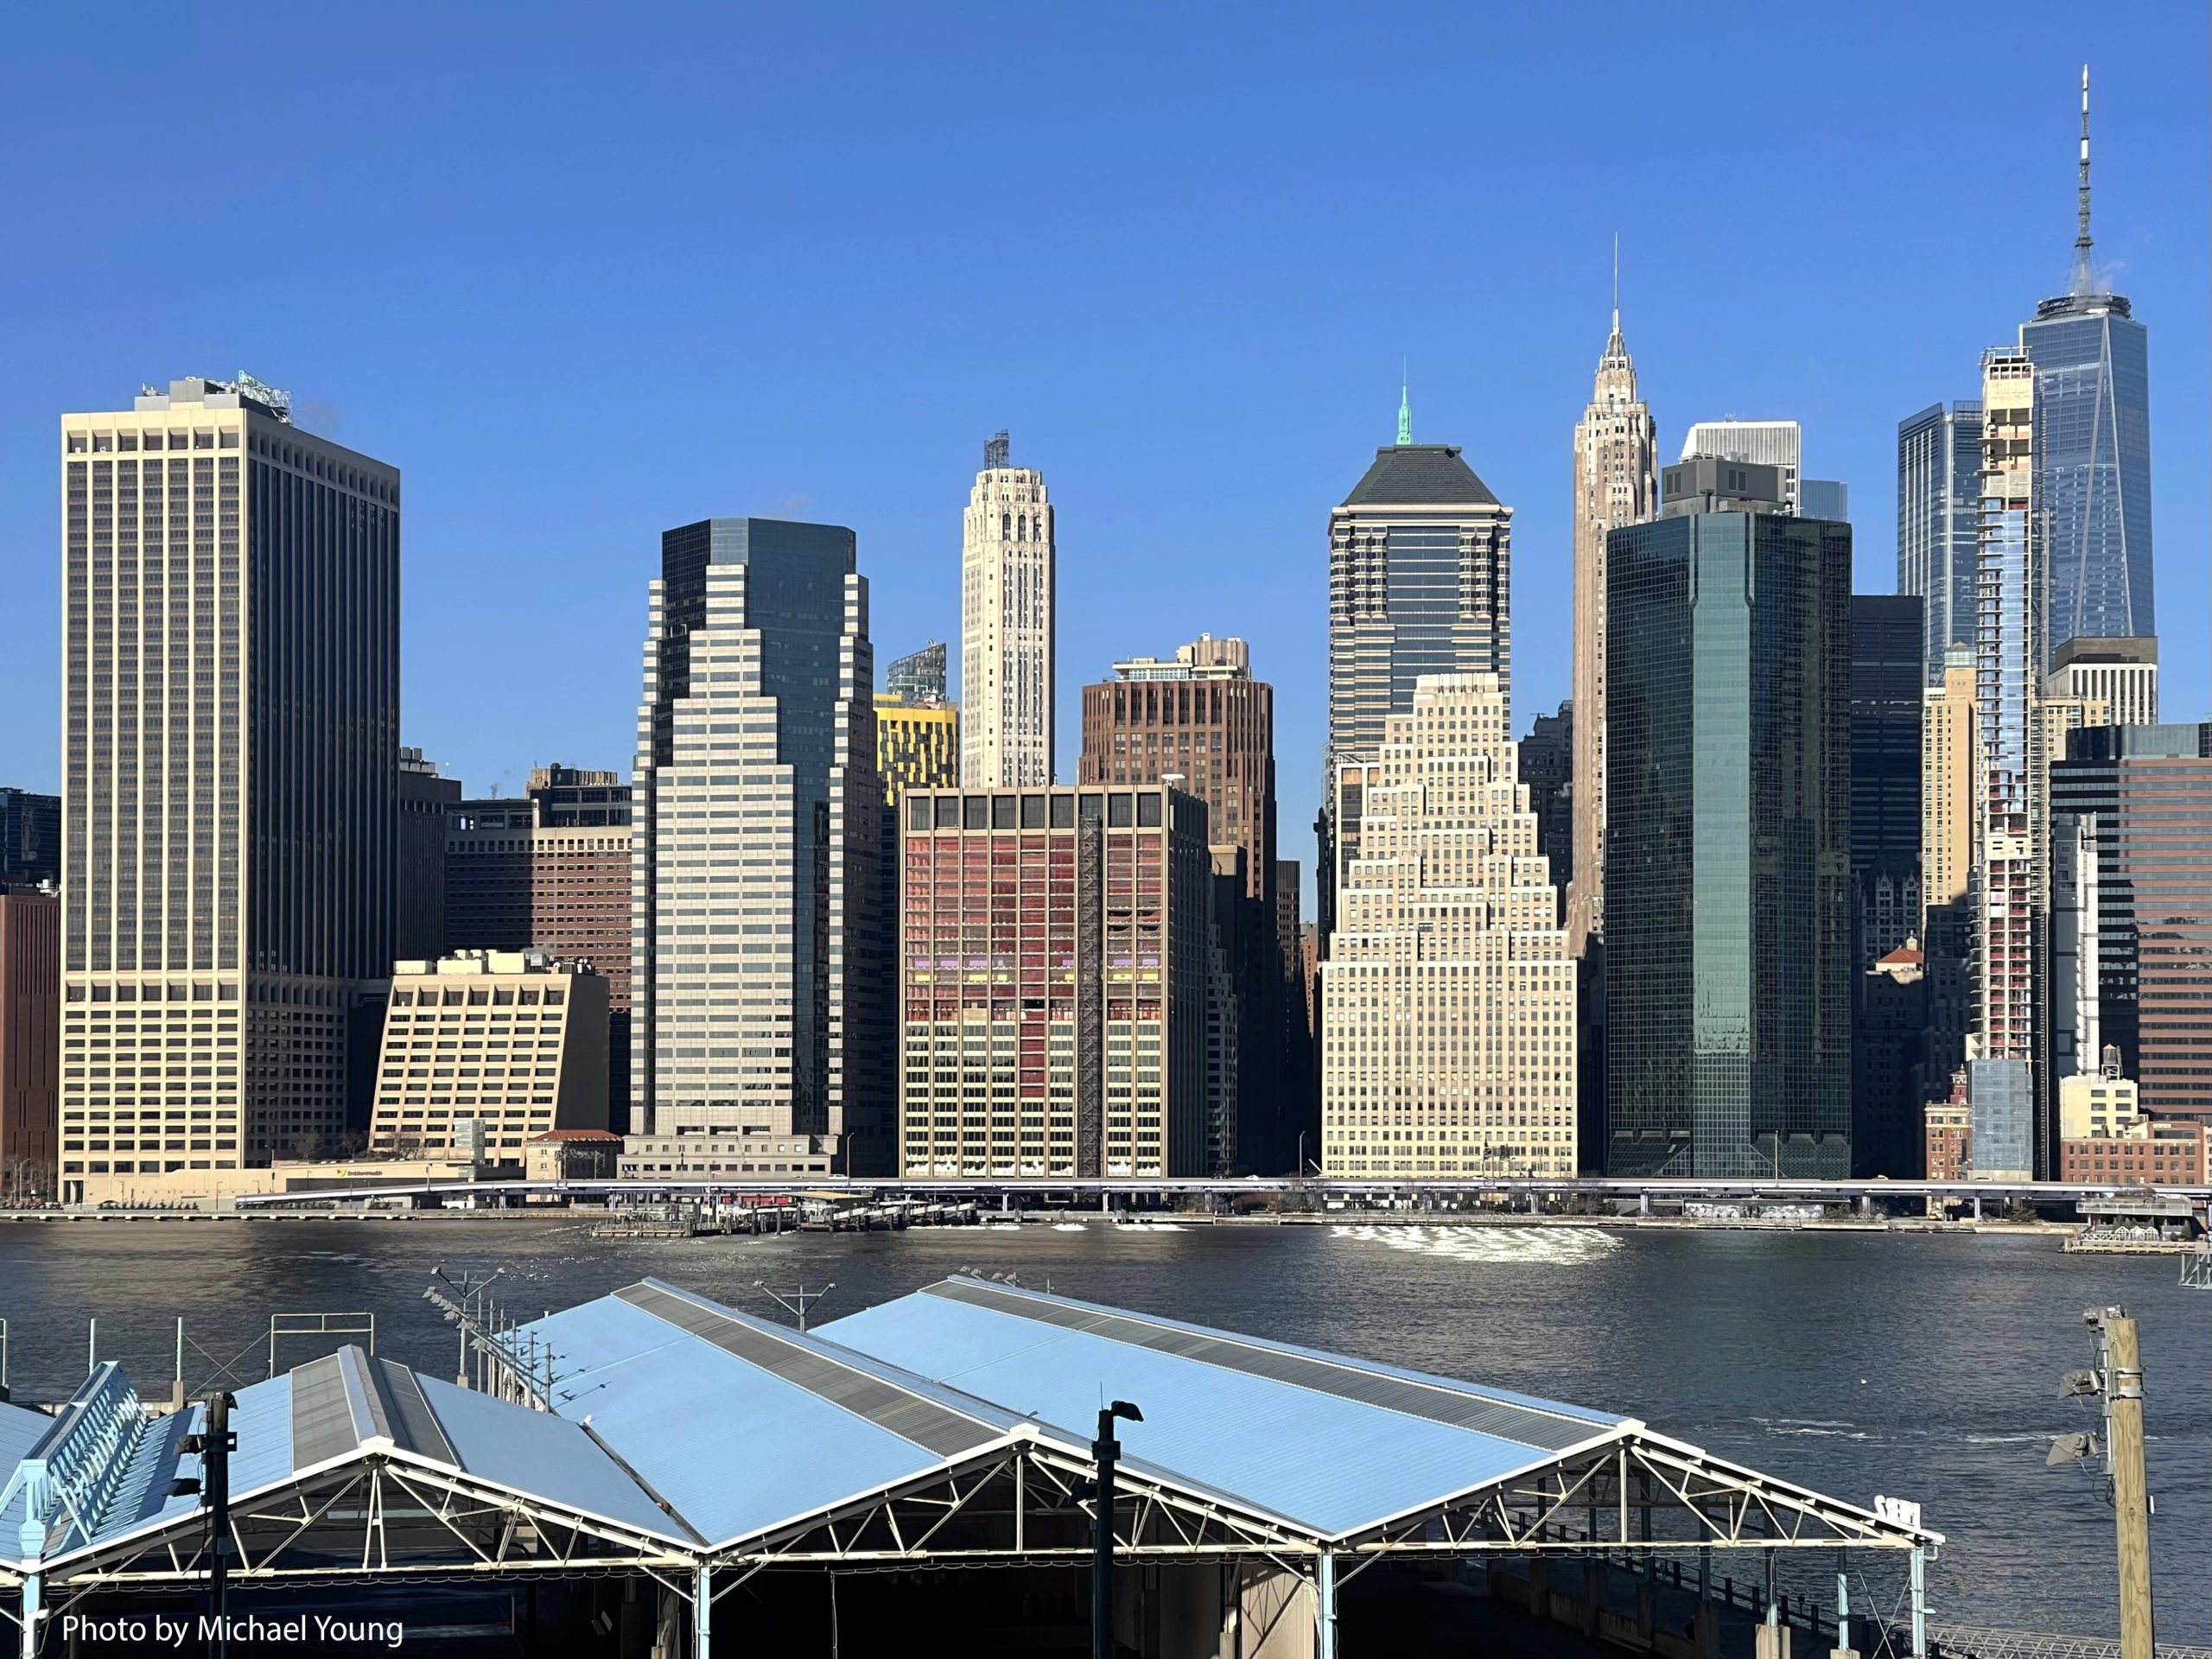
56 Leonard Street. Photo by Michael Young
Residential and hotel units filed per borough

Number of residential and hotel units in new construction permits filed per borough in New York City in 2023. Data source: the NYC Department of Buildings. Data aggregation and graphics credit: Vitali Ogorodnikov
The total volume of units filed for in 2022, which registers at 49,965, is only slightly higher than the previous yearly total of 45,019. However, when counted by borough, the distribution is varied from last year’s totals.
Between 2021 and 2022, The Bronx nearly doubled its total filed-for unit count, rising from 6,719 in 2021 to 11,324 in 2022. By contrast, Brooklyn, the undisputed leader for both years, saw its total rise more modestly from 16,515 to 18,197. The figure for Manhattan plummeted by over 50 percent, falling from 11,502 in 2021 down to 5,307 in 2022. As Manhattan slipped from second to fourth place, Queens rose to second place, with an increase from 9,433 units in 2021 to 13,210 units in 2022.
While the count for low-density, transit-underserved Staten Island continues to lag behind its counterparts, the borough saw the greatest relative increase in the city, more than doubling its 2021 unit count of 850 with a 2022 figure of 1,886.

111 West 57th Street. Photo by Michael Young
Permits listed by average unit count per filing
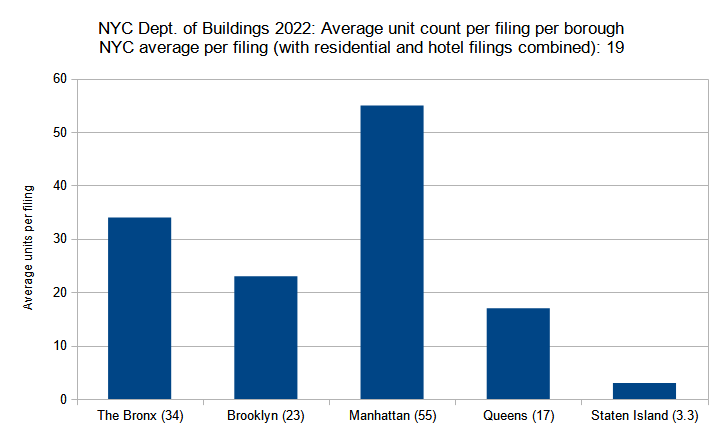
Average unit count (residential and hotel) per new construction permit per borough filed in New York City in 2023. Data source: the NYC Department of Buildings. Data aggregation and graphics credit: Vitali Ogorodnikov
While the previous analysis compared sheer volume of units filed per borough, our analysis of permits listed by average unit count per residential and hotel filing gives an idea of the general scale of an average residential building proposed in each borough. In general, the chart resembles that of the previous year, with Manhattan boasting the highest average unit count per filing, followed in a steadily decreasing trend by The Bronx, then Brooklyn, Queens, and finally, Staten Island.
Most boroughs did, however, see some adjustments in their numbers. Manhattan offers the greatest surprise, as its 2022 average of 55 is nearly one-third of the total of 148 for 2021; however, the number suggests that the average filing represents a larger mid- or high-rise building.
The number for The Bronx also dipped, lowering from 40 in 2021 to 34 in 2022, as did Brooklyn, decreasing from 35 in 2021 to 23 in 2022. The numbers suggest that most filings in the borough were for moderately sized mid-rise developments, with a few larger high-rises sprinkled in between.
The number for Queens remained nearly the same, dipping ever so slightly from 18 in 2021 to 17 in 2022, indicating that the average filing, as before, was for a comparatively smaller mid-rise structure.
Staten Island maintained the previous year’s average of three units per filing, indicating that the borough’s contractors continue to generally build single- and two-family homes, with a handful of larger developments increasing the average to three units per filing.
111 Wall Street. Photo by Michael Young
Permit filings by floor count category
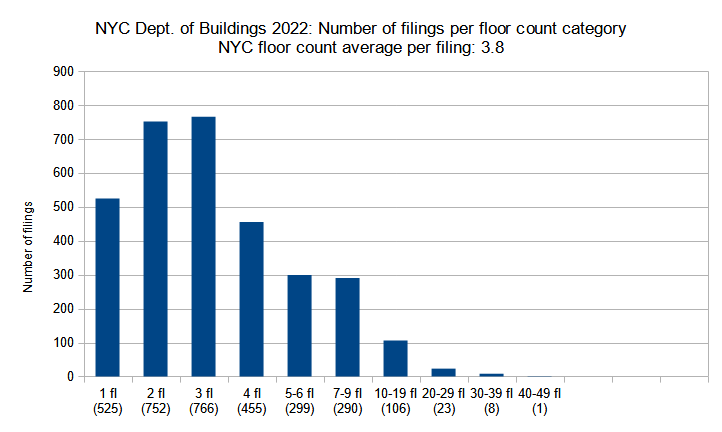
New construction permits filed in New York City in 2023 grouped by floor count. Data source: the NYC Department of Buildings. Data aggregation and graphics credit: Vitali Ogorodnikov
While new towers continue to boost New York City’s world-renown skyline, the bread and butter of the city’s construction industry remains low- and mid-rise construction. Just as in 2021, or any other year for that matter, most new proposed developments fall into the low-rise category, standing one to three stories tall.
In 2022, such filings totaled 2,043, accounting for 63 percent or nearly two-thirds of all the new building filings during the year. The number spells great news for the city’s development industry, as it nearly doubles the 2021 total of 1,322 filings in the category.
Although low-rise filings make up the lion’s share of the total, there were still enough mid- and high-rise filings to push the total floor count average to 3.8 per filing, slightly lower than the previous year’s average of 4.3.
Filings in the mid-rise category had similarly dramatic increases. The number of filings for four-story buildings nearly doubled from 2021’s total of 252 to 455 in 2022, and more than doubled for filings for buildings standing five to six stories tall, jumping from 131 in 2021 to 299 in 2022. The seven- through nine-story category saw a similar rate of increase, growing from 187 in 2021 to 290 in 2022.
While 2022 was a boom year for low- and mid-rise filings, the numbers are rather comparable for filings in the high-rise category. The number of filings for buildings standing ten to 19 floors rose significantly, from 77 in 2021 to 106 in 2022. The number of filings for buildings standing 20 to 29 stories, tall enough to make a notable skyline impact in most portions of the city, remained virtually the same, dipping from 24 in 2021 to 23 in 2022, and exactly the same (eight each) for buildings projected to rise 30 to 39 stories.
While filing numbers for low- and mid-rise buildings skyrocketed in 2022, the year lags behind the preceding tally in terms of skyscrapers on the taller end of the scale. Only one building in the 40- to 49-floor category was filed for in 2022, and none in the categories above. By contrast, in 2021, there were eight filings for buildings rising 40 to 49 stories, two in the 50-59-story category, four in the 60-69-story group, and two with 70 stories or more.
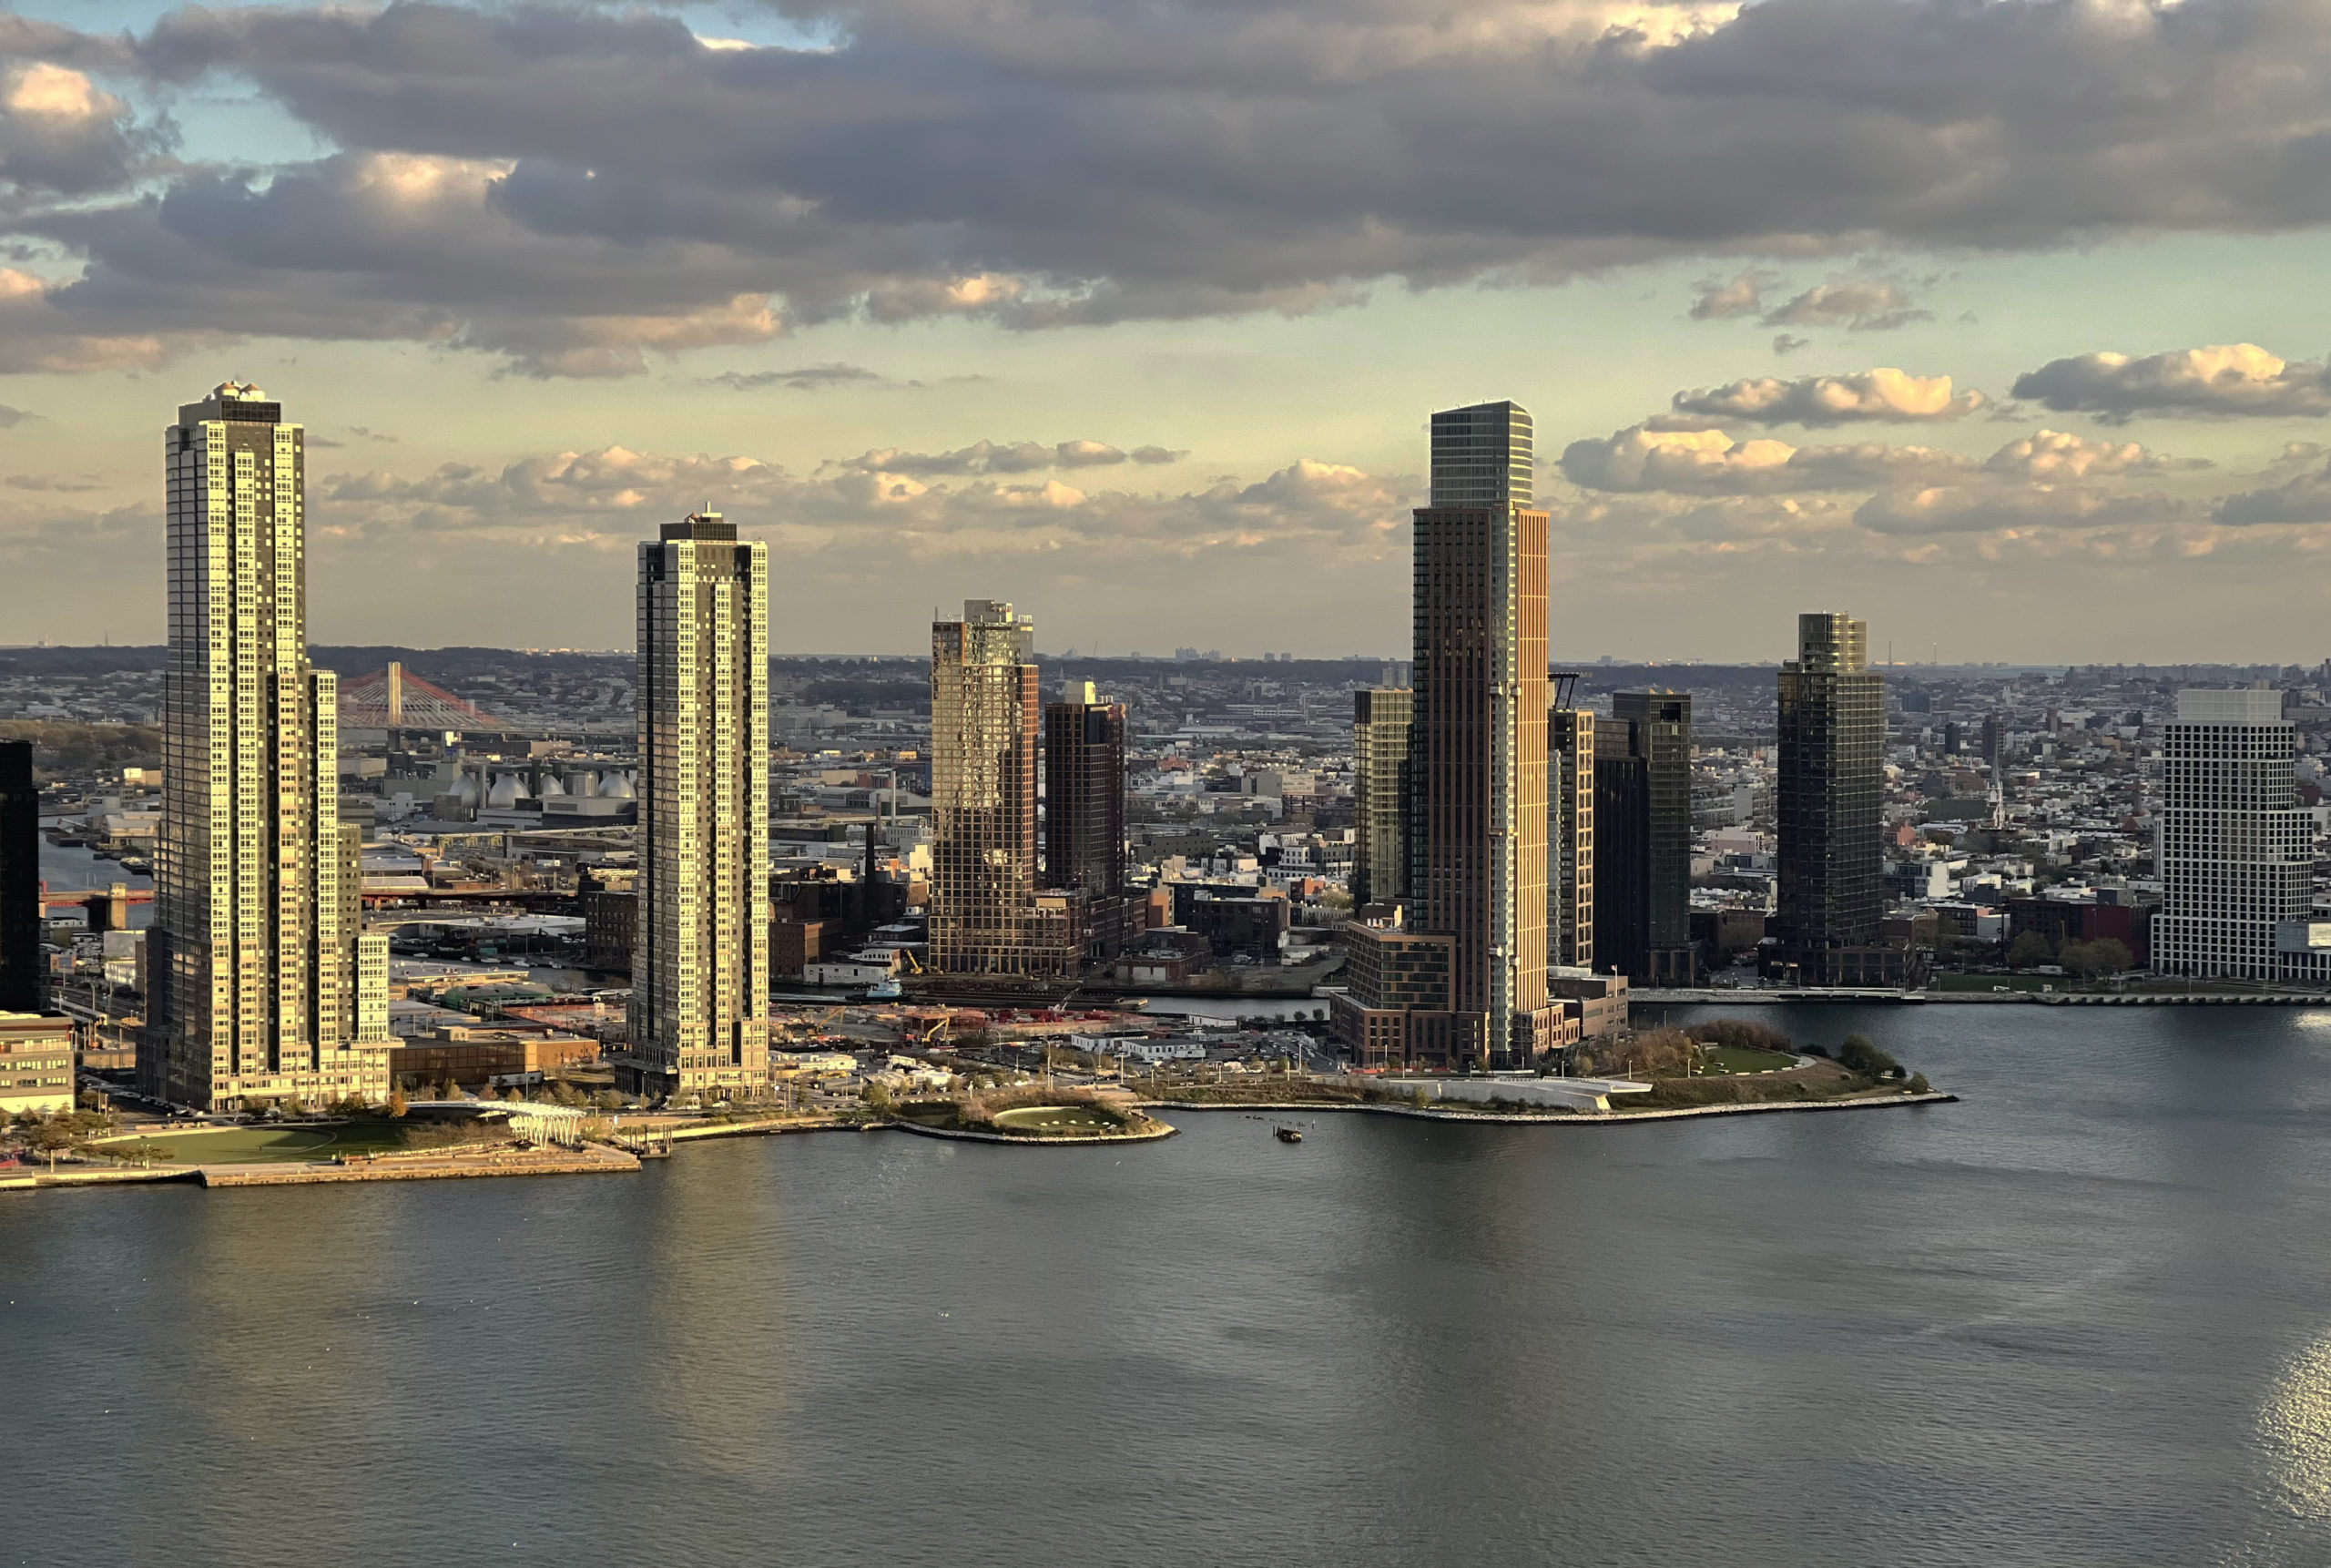
Gotham Point. Photo by Michael Young
Average number of floors per filing per borough
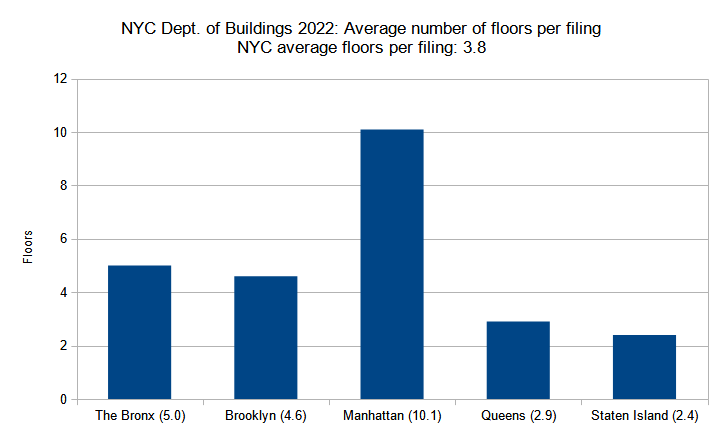
Average number of floors per new construction permit per borough filed in New York City in 2023. Data source: the NYC Department of Buildings. Data aggregation and graphics credit: Vitali Ogorodnikov
The appearance of cities is strongly shaped by zoning codes. While the total volume of construction varies depending on economy and other factors, New York developers generally tend to build out their projects to the maximum extent allowable by code. Since few significant zoning changes took place over the course of the past year, it follows that the average floor counts for new building filings have also remained consistent depending on borough.
In general, Manhattan has the least restrictive building height limits of the five boroughs, so the borough is the most susceptible to filing height fluctuations. Over the past year, the average filing height in Manhattan shrank by nearly a third, from 15.1 stories per average filing in 2021 to 10.1 in 2022, indicating fewer skyline-busting projects than in the previous year.
Floor count averages remained generally consistent for the rest of the boroughs, with The Bronx dipping from 5.2 stories per average filing in 2021 to 5.0 stories in 2022, Brooklyn lowering from 5.3 to 4.6 stories, and Queens dipping from 3.0 to 2.9 stories. Only Staten Island saw an increase, with the new building filing average growing marginally from 2.3 floors in 2021 to 2.4 floors in 2022.
262 Fifth Avenue. Photo by Michael Young
Total floor area filed by borough
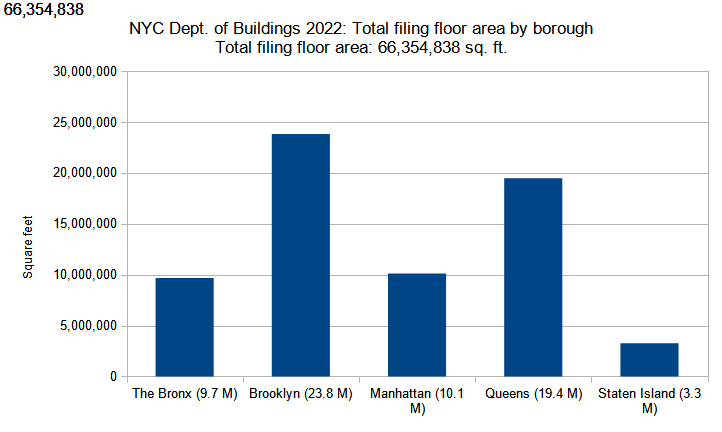
Combined floor area of new construction permits filed per borough in New York City in 2023. Data source: the NYC Department of Buildings. Data aggregation and graphics credit: Vitali Ogorodnikov
Between 2021 and 2022, Queens saw the greatest gains in terms of total filed-for floor area, nearly doubling from 11.7 million square feet in 2021 to 19.4 million square feet in 2022. The rest of the boroughs have displayed lesser fluctuations, with The Bronx rising from 7.3 to 9.7 MSF, Brooklyn increasing from 20.5 to 23.8 MSF, Manhattan dipping from 11.9 to 10.1 MSF, and Staten Island rising from 2 to 3.3 MSF.
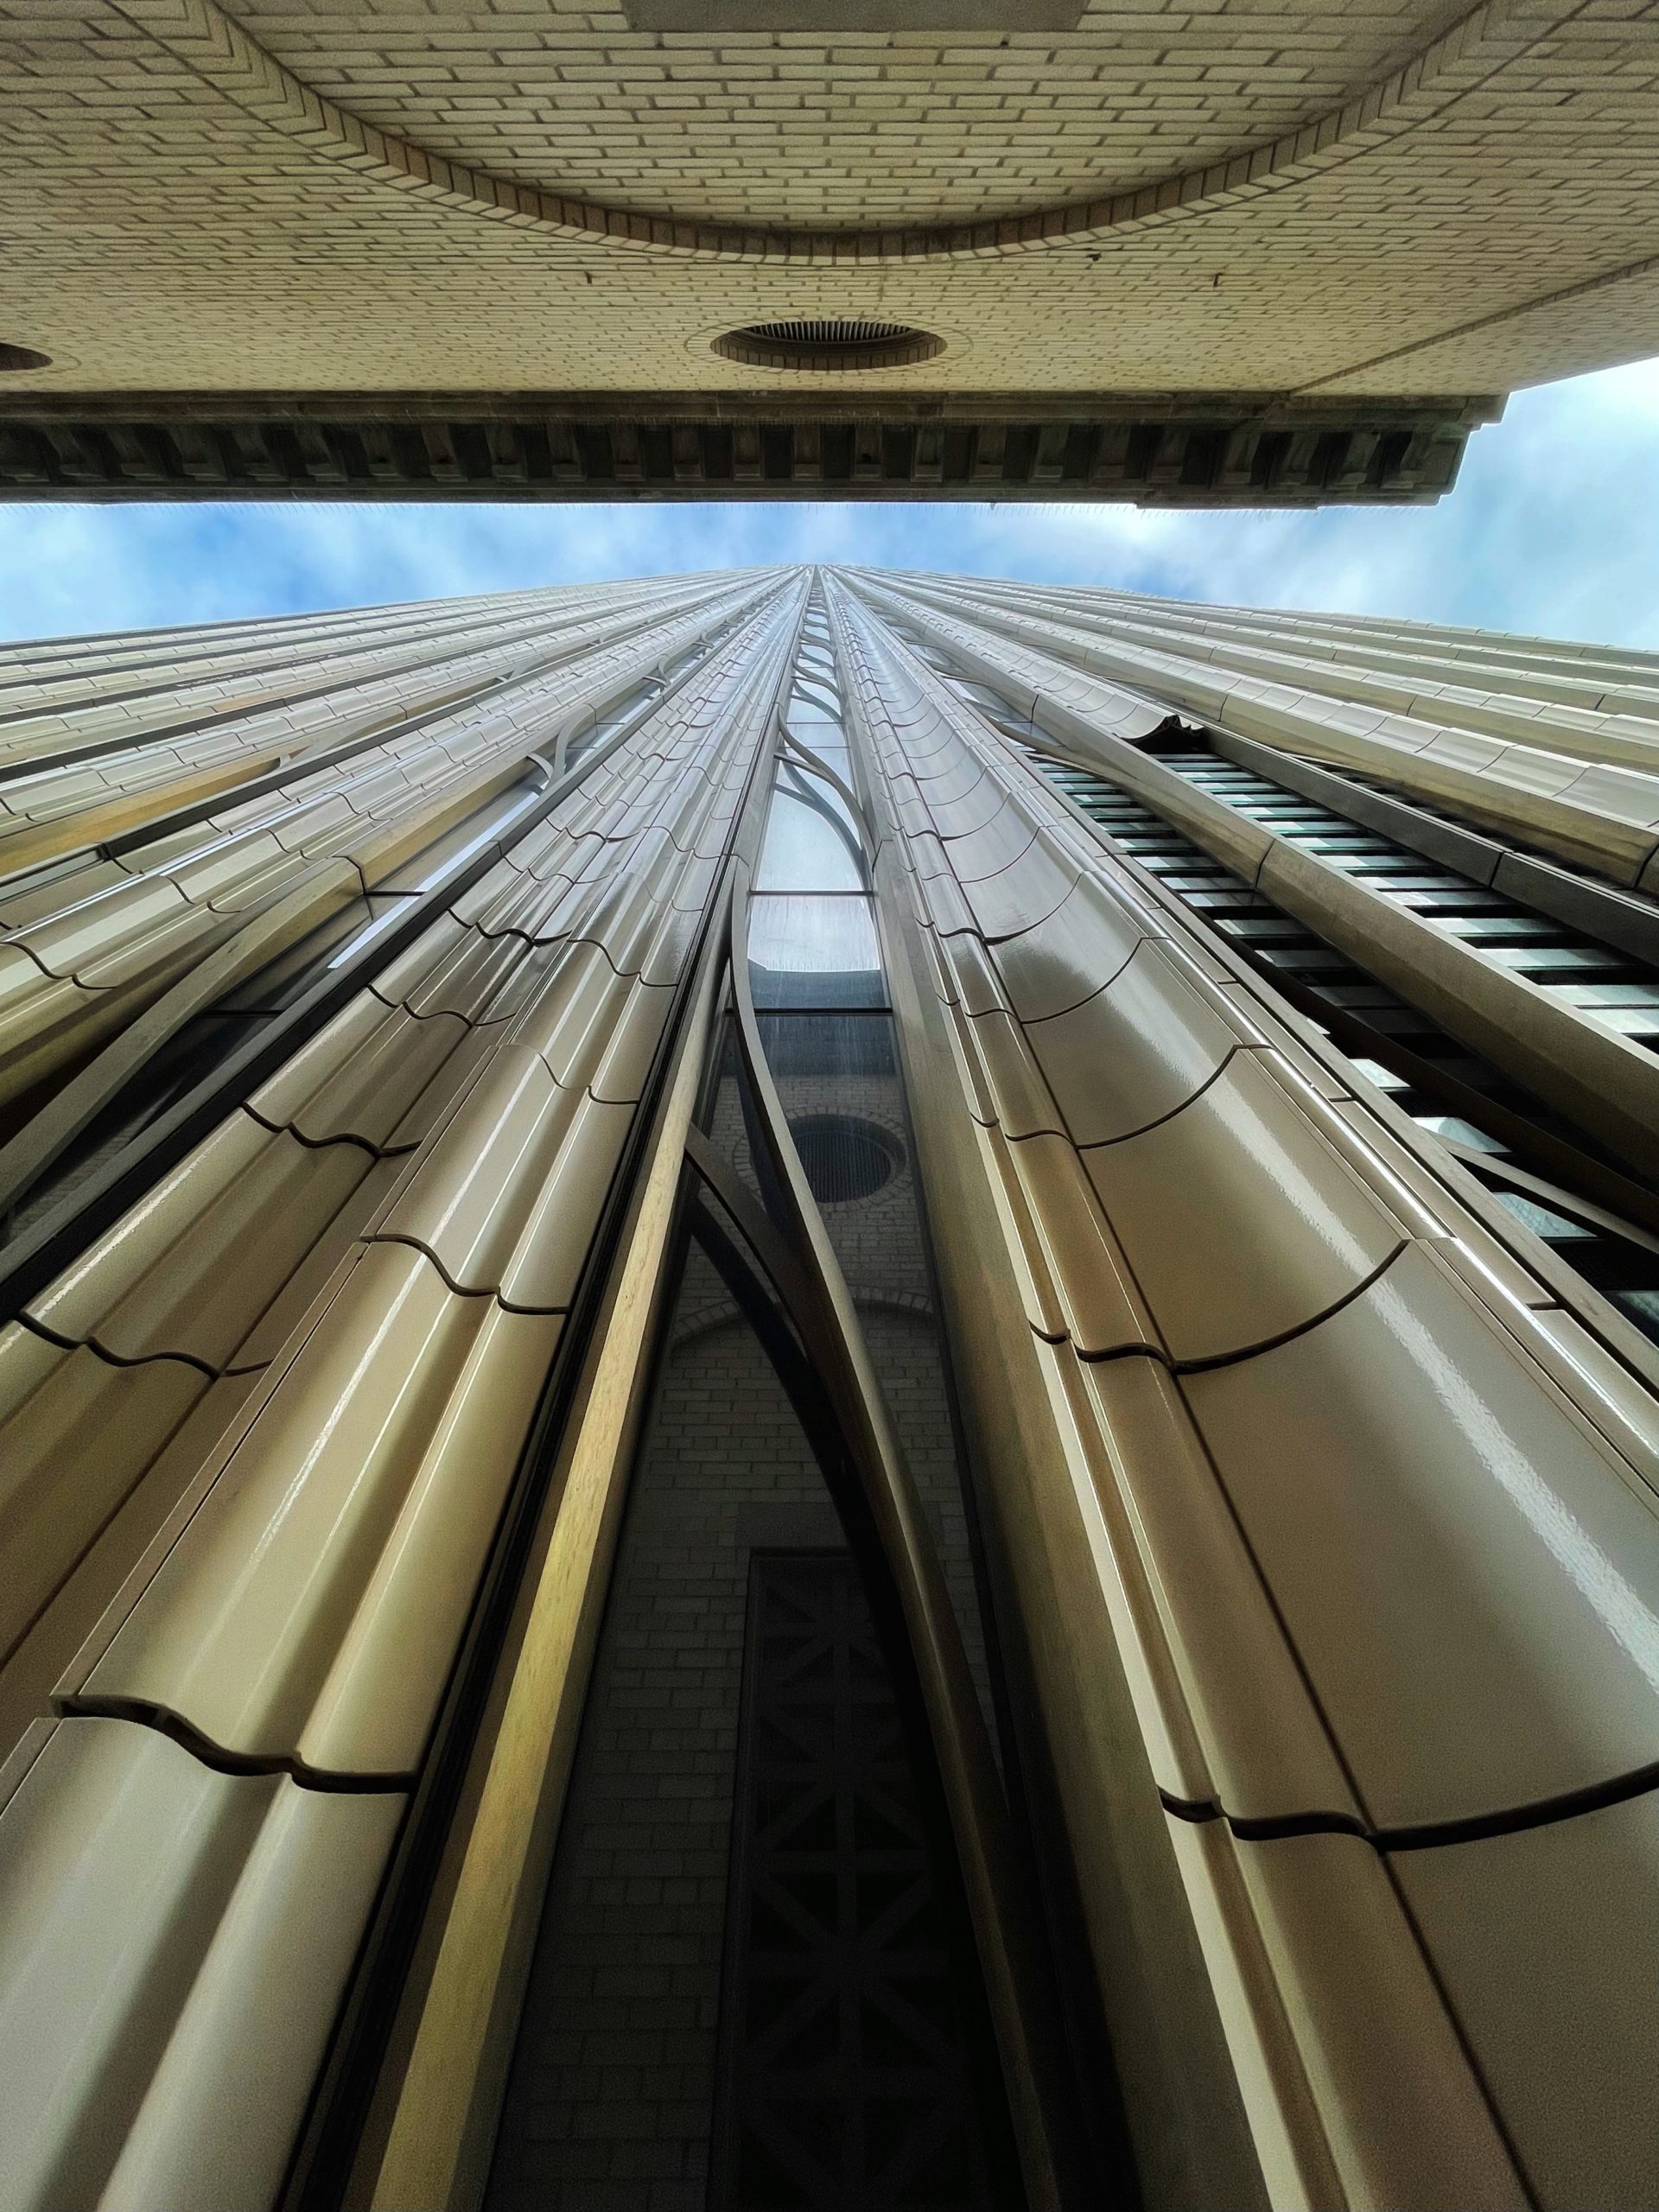
Photo by Michael Young
Average floor area per permit filing by borough
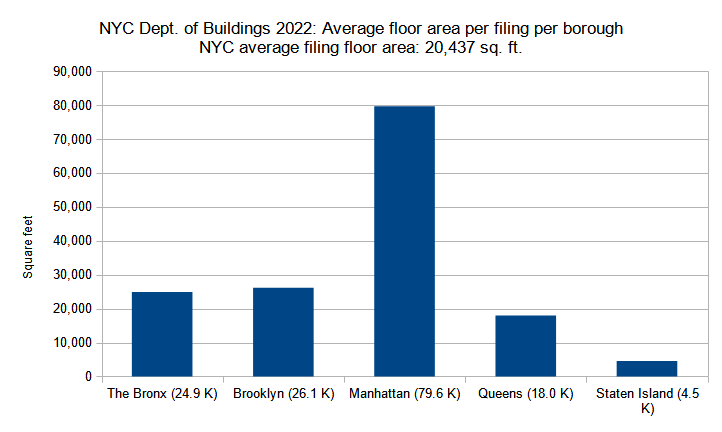
Average floor area per new construction permit per borough filed in New York City in 2023. Data source: the NYC Department of Buildings. Data aggregation and graphics credit: Vitali Ogorodnikov
While the total number of new filings surged by 60 percent in 2022 in comparison to 2021 (from 2,017 to 3,225 permits), the relative increase of filed-for floor area has been more modest, rising from 53 million square feet in 2021 to 66 million square feet in 2022. This indicates that the average filing size has become smaller, shrinking from 26,447 square feet per filing in 2021 to 20,437 square feet in 2022.
Borough figures generally reflect this trend. The average for The Bronx lowered from 37.3 thousand square feet in 2021 to 24.9 thousand square feet in 2022, Brooklyn decreased from 36.9 thousand in 2021 to 26.1 thousand in 2022, Manhattan dropped from 128.2 thousand in 2021 to 79.6 thousand in 2022, and Staten island dipped from 4.6 thousand in 2021 to 4.5 thousand in 2022.
Only Queens registered an increase, with the size of an average filing growing from 15.7 thousand square feet in 2021 to 18 thousand square feet in 2022.

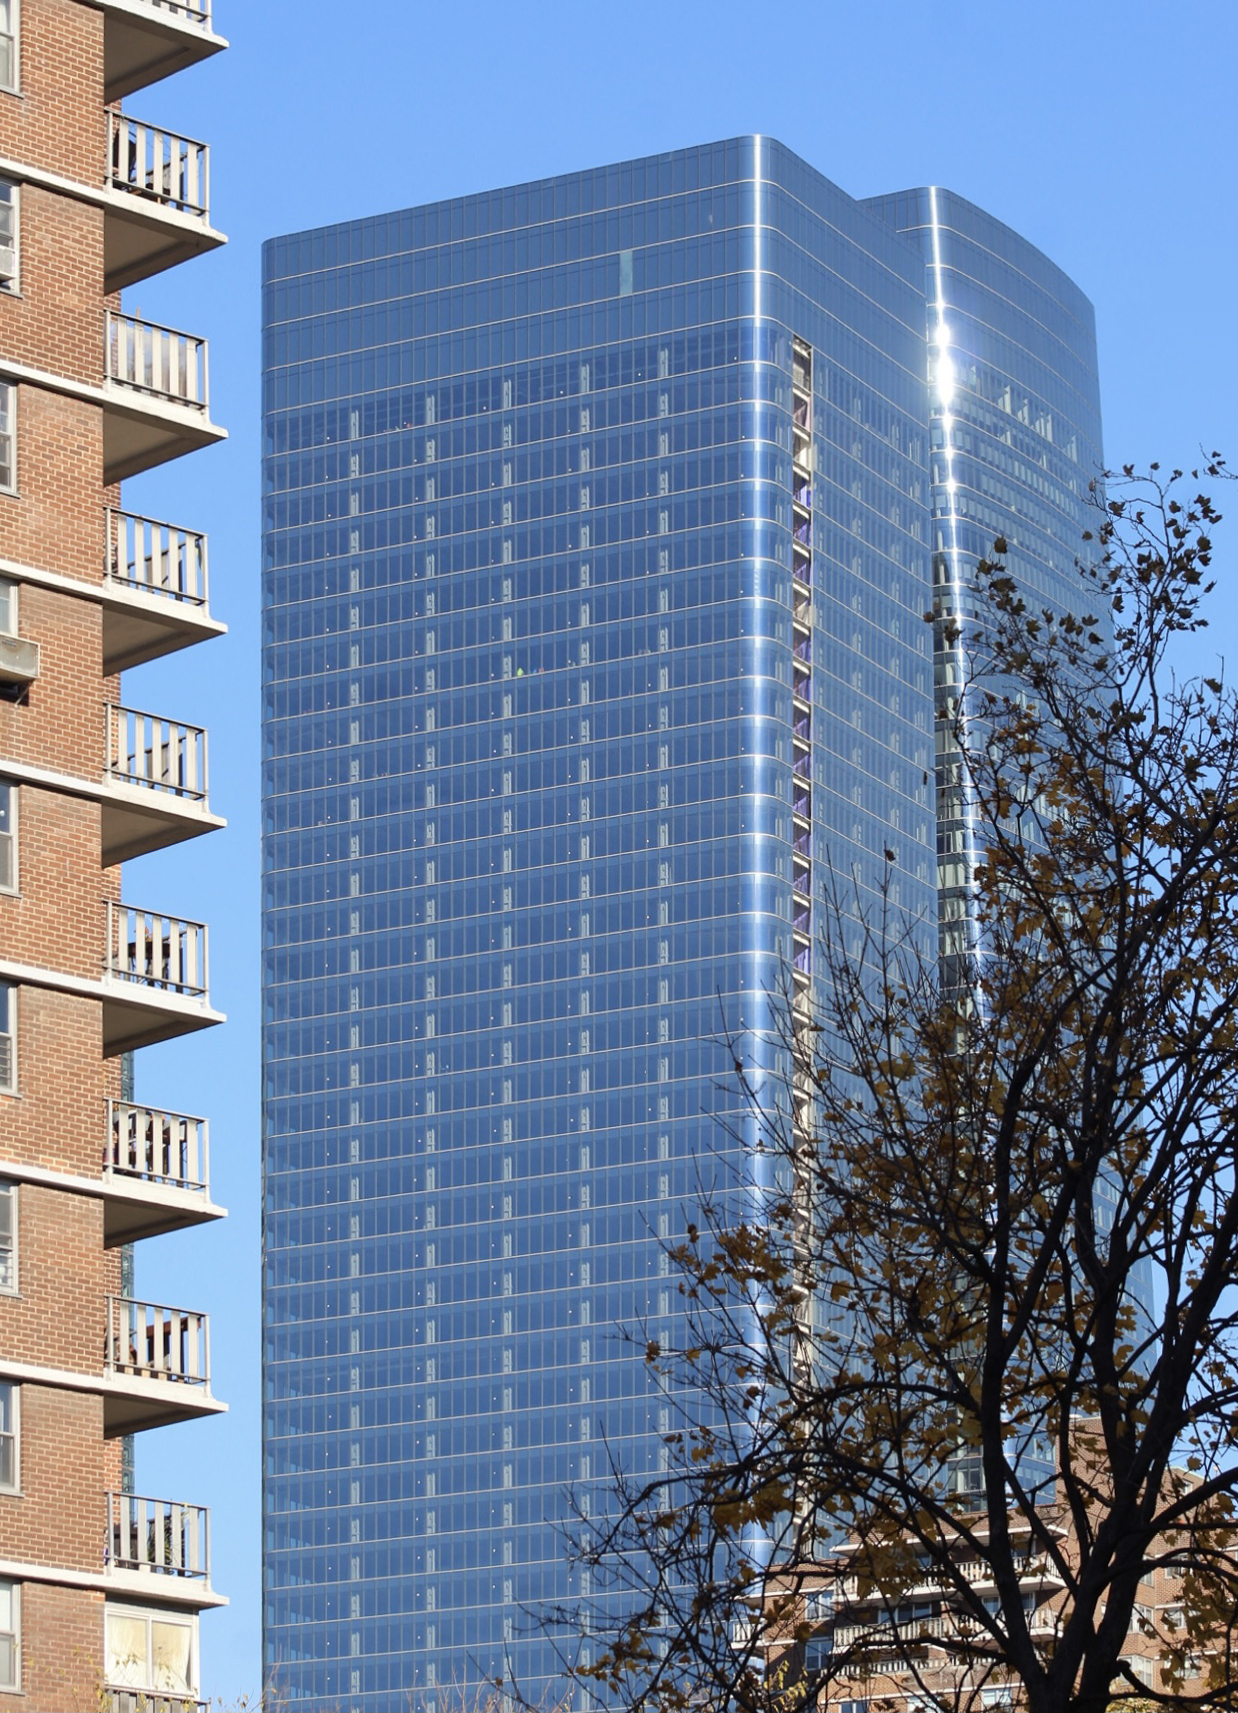
50 West 66th Street. Photo by Michael Young
Permits listed by floor area per filing
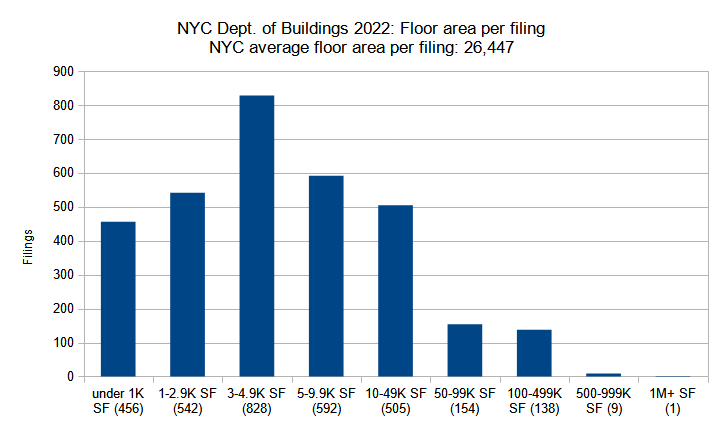
New construction permits filed in New York City in 2023 grouped by total floor area. Data source: the NYC Department of Buildings. Data aggregation and graphics credit: Vitali Ogorodnikov
In the analysis that distributes filings by floor count, we noted that 2022 saw a 63 percent increase in filings for low-rise buildings (one to three stories), a near doubling of filings for mid-rise buildings (four to nine stories), yet more modest gains, if any, for the taller filing categories.
As height and floor area are generally correlated, it is expected that the numbers of building filings grouped by floor area would reflect a similar trend. The five categories with buildings under 50,000 square feet each saw hundred-plus gains in filing counts, with smaller gains in the three categories with building filings spanning from 50,000 to 1 million square feet. Both years registered only one million-square-foot-plus building filing.
Photo by Michael Young.
The significant 60 percent increase in filing counts from the previous year spells excellent news for New York City, while the increase from roughly 45 to 50 thousand in total filed-for units is also encouraging. However, estimated figures for the city’s population list 8.46 million New Yorkers in 2021 and 8.49 million in 2022, with the city gaining 30,000 new residents.
While it is encouraging to see the filed-for unit count outpace population growth, the volume is still inadequate to relieve the city’s acute housing crisis and highest-ever rent rates. As such, the city still has much work ahead to encourage a significantly greater volume of new housing construction by easing zoning restrictions, streamlining construction approval processes, and making massive investments in transit and infrastructure.
Photo by Michael Young.
509 Third Avenue. Photo by Michael Young
Eastlight (right). Photo by Michael Young
TSX Broadway (right). Photo by Michael Young

TSX Broadway. Photo by Michael Young
41-47 West 57th Street. Photo by Michael Young
41-47 West 57th Street. Photo by Michael Young
740 Eighth Avenue. Photo by Michael Young
740 Eighth Avenue. Photo by Michael Young
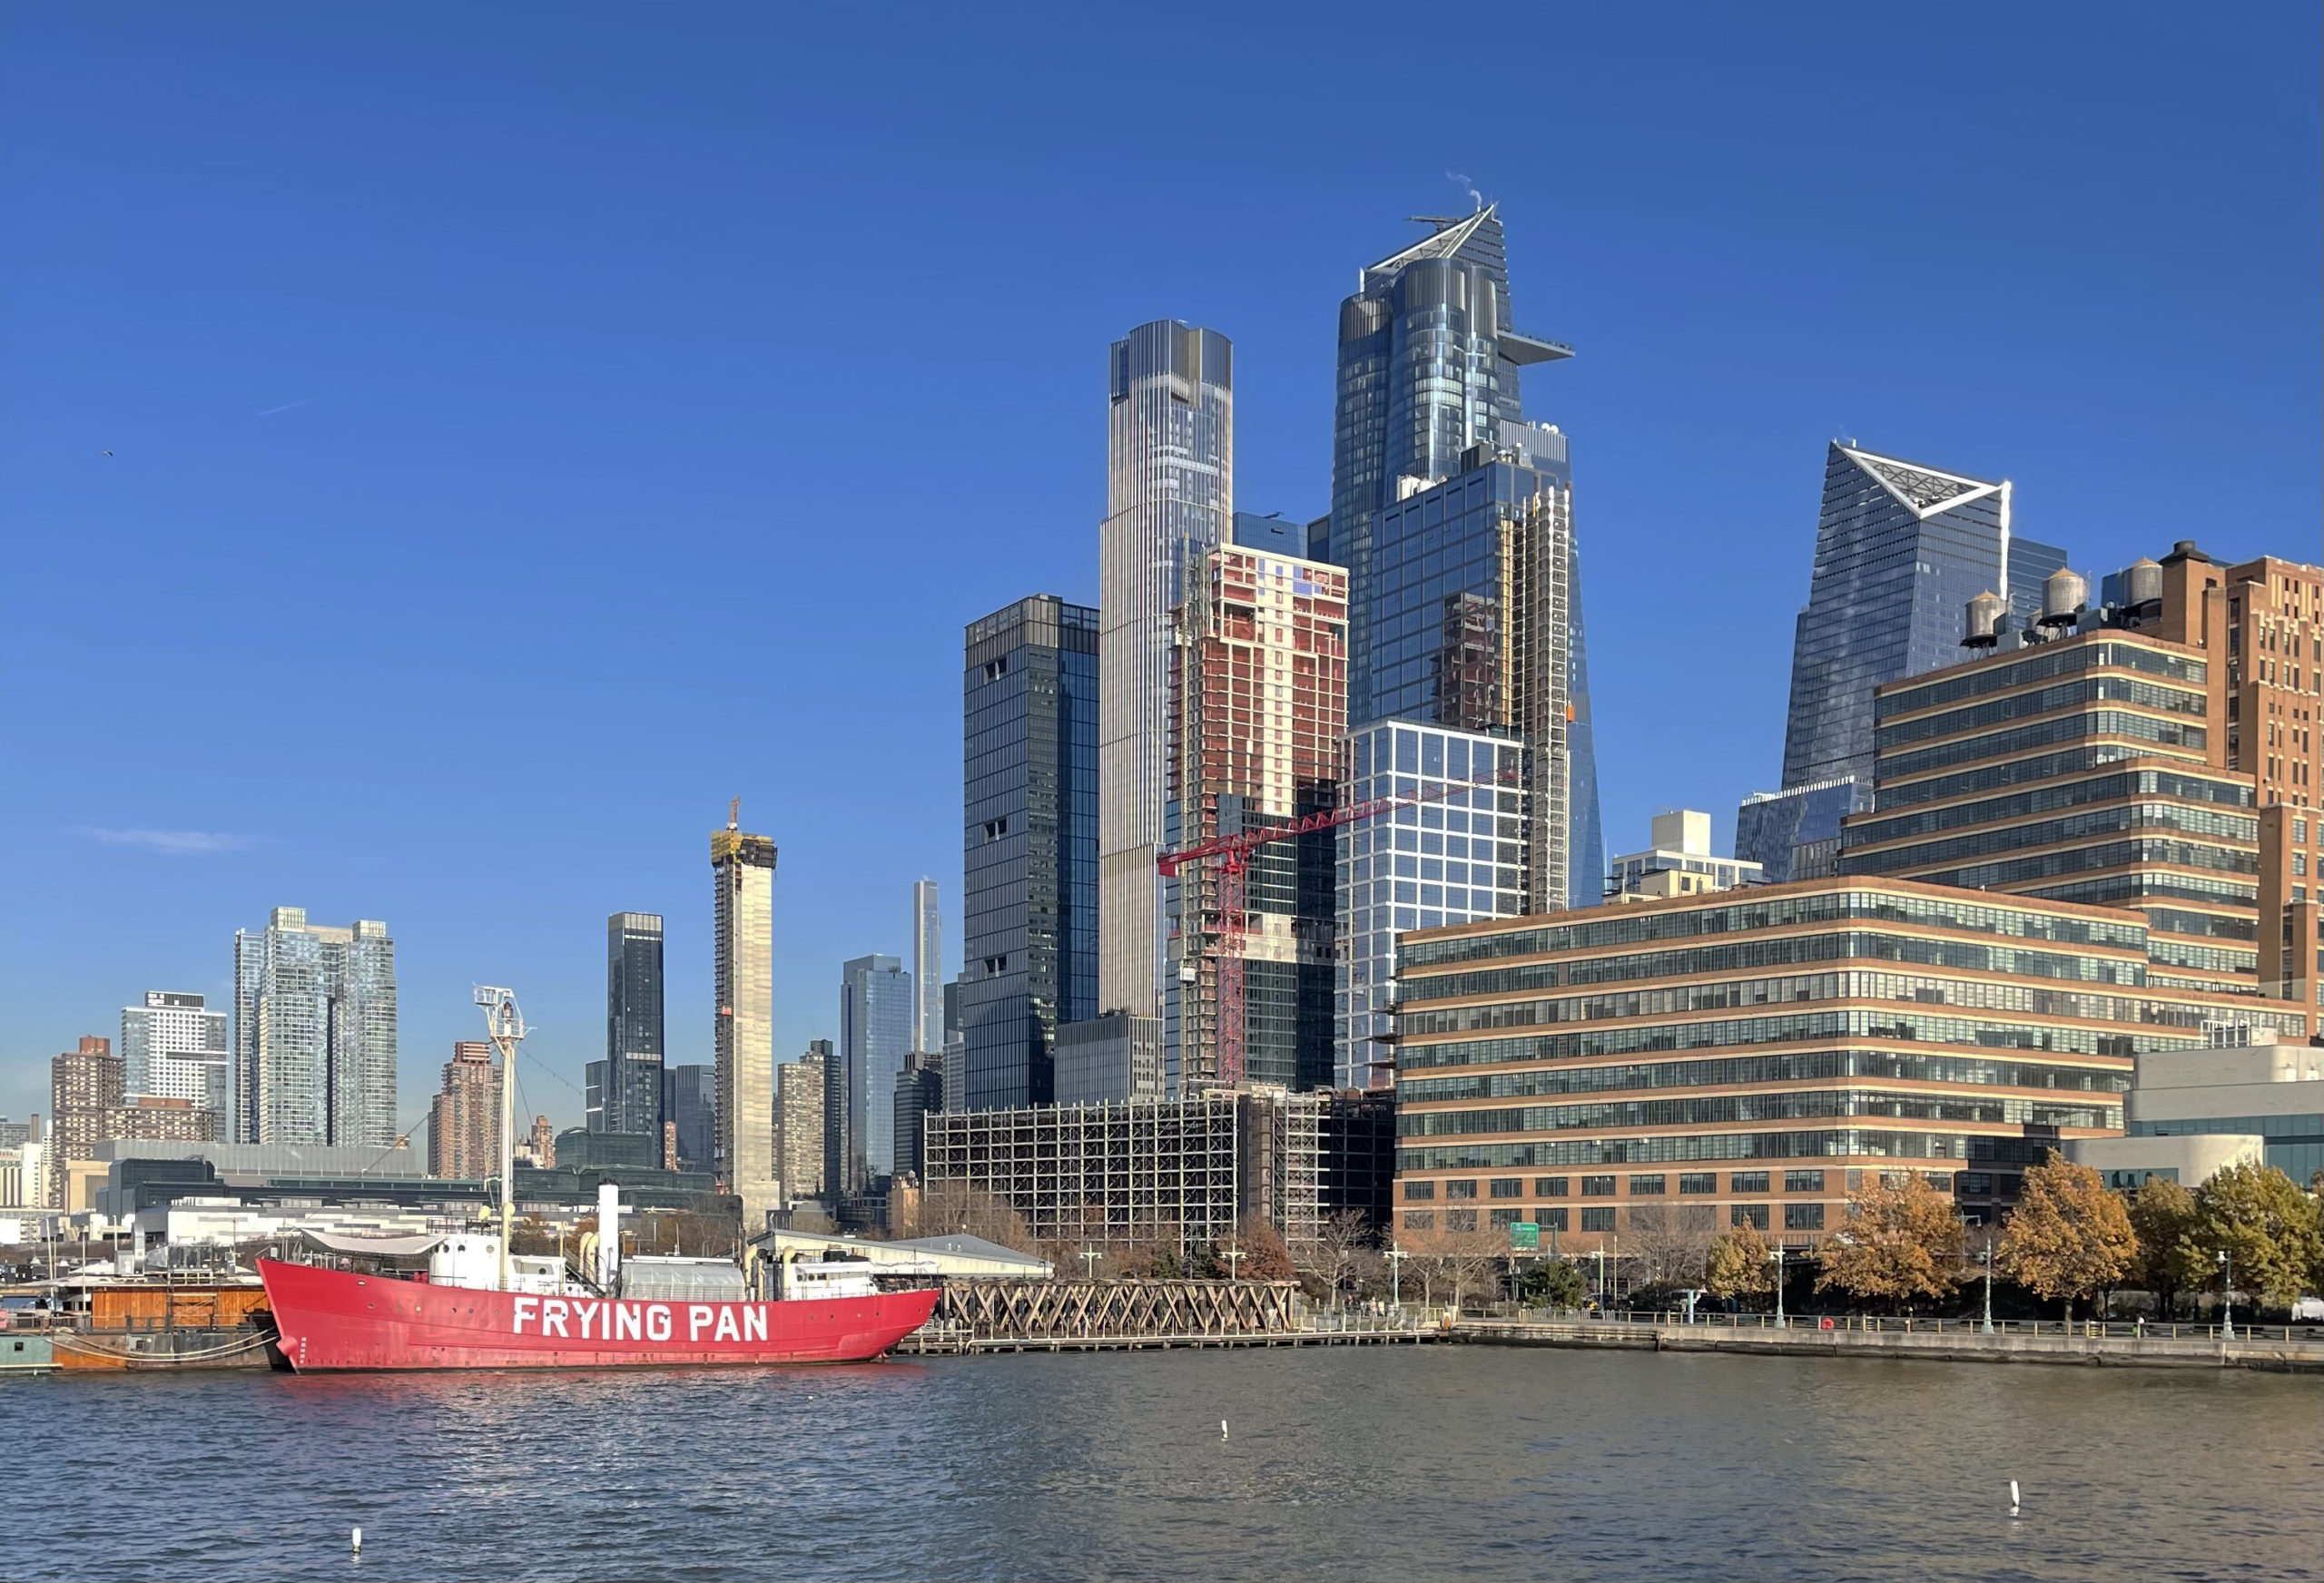
Manhattan West. Photo by Michael Young

The Spiral (right). Photo by Michael Young

The Spiral. Photo by Michael Young
Two Manhattan West. Photo by Michael Young

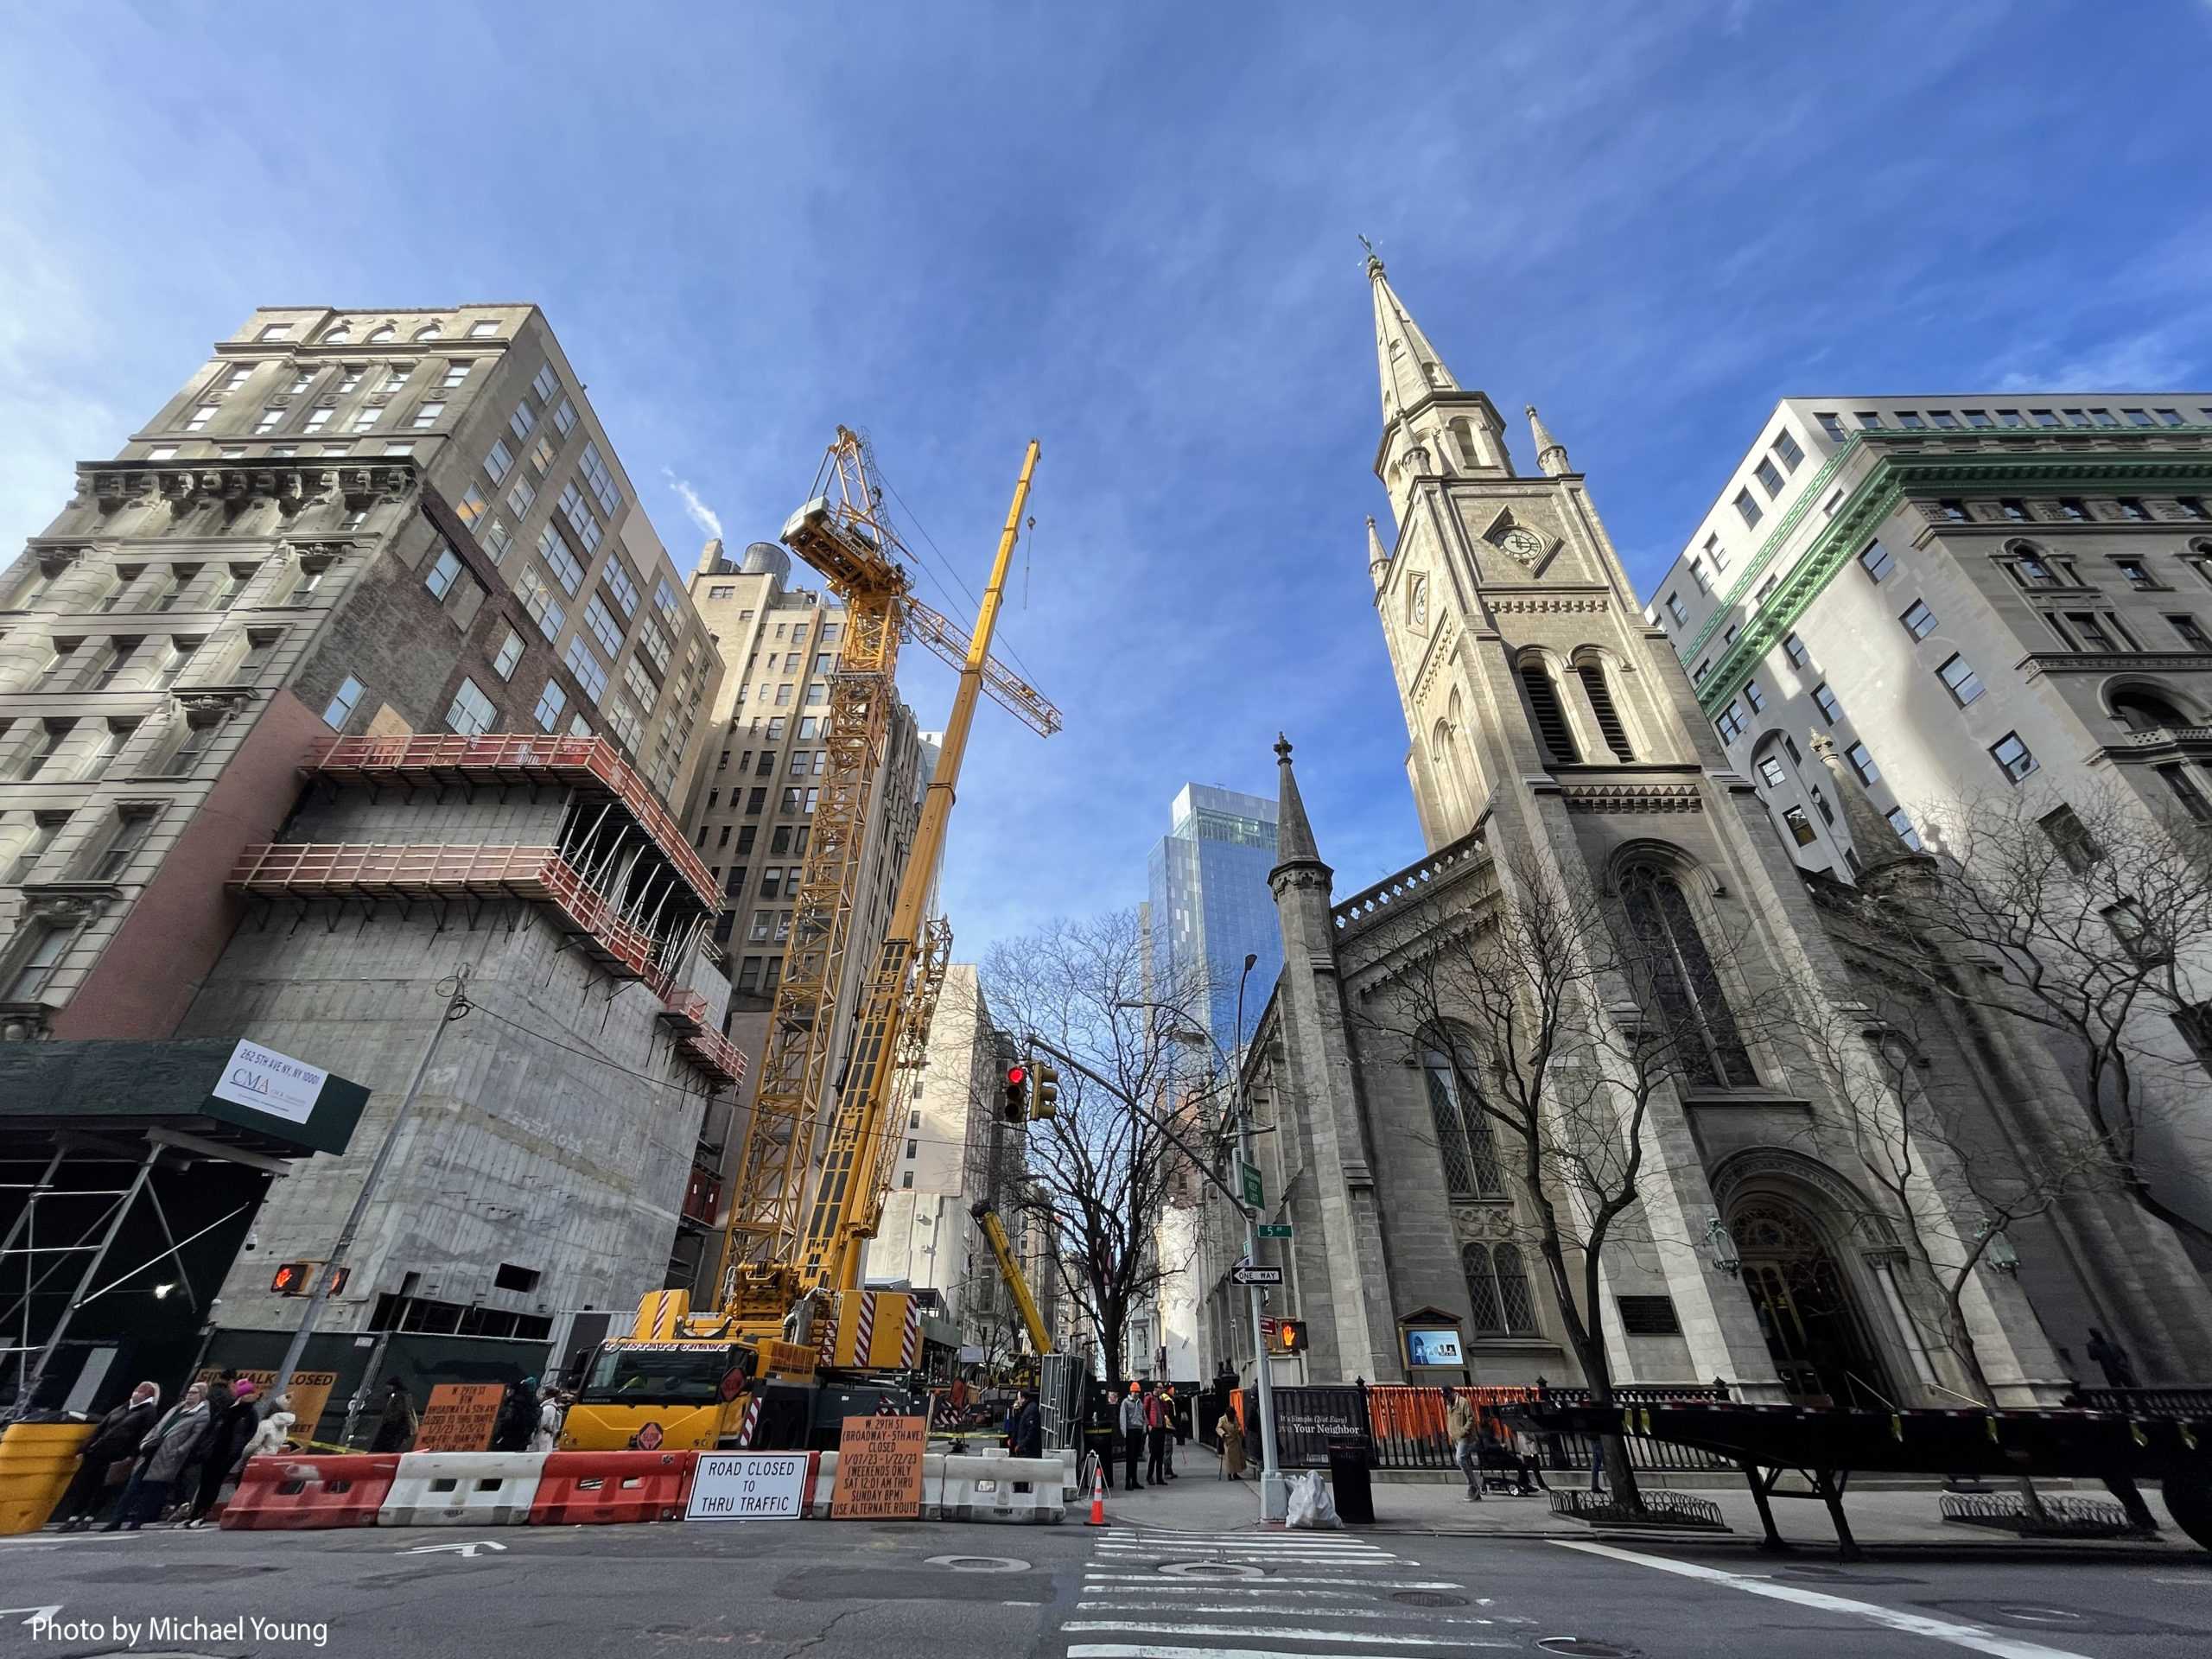
St. Nicholas Greek Orthodox Church. Photo by Michael Young
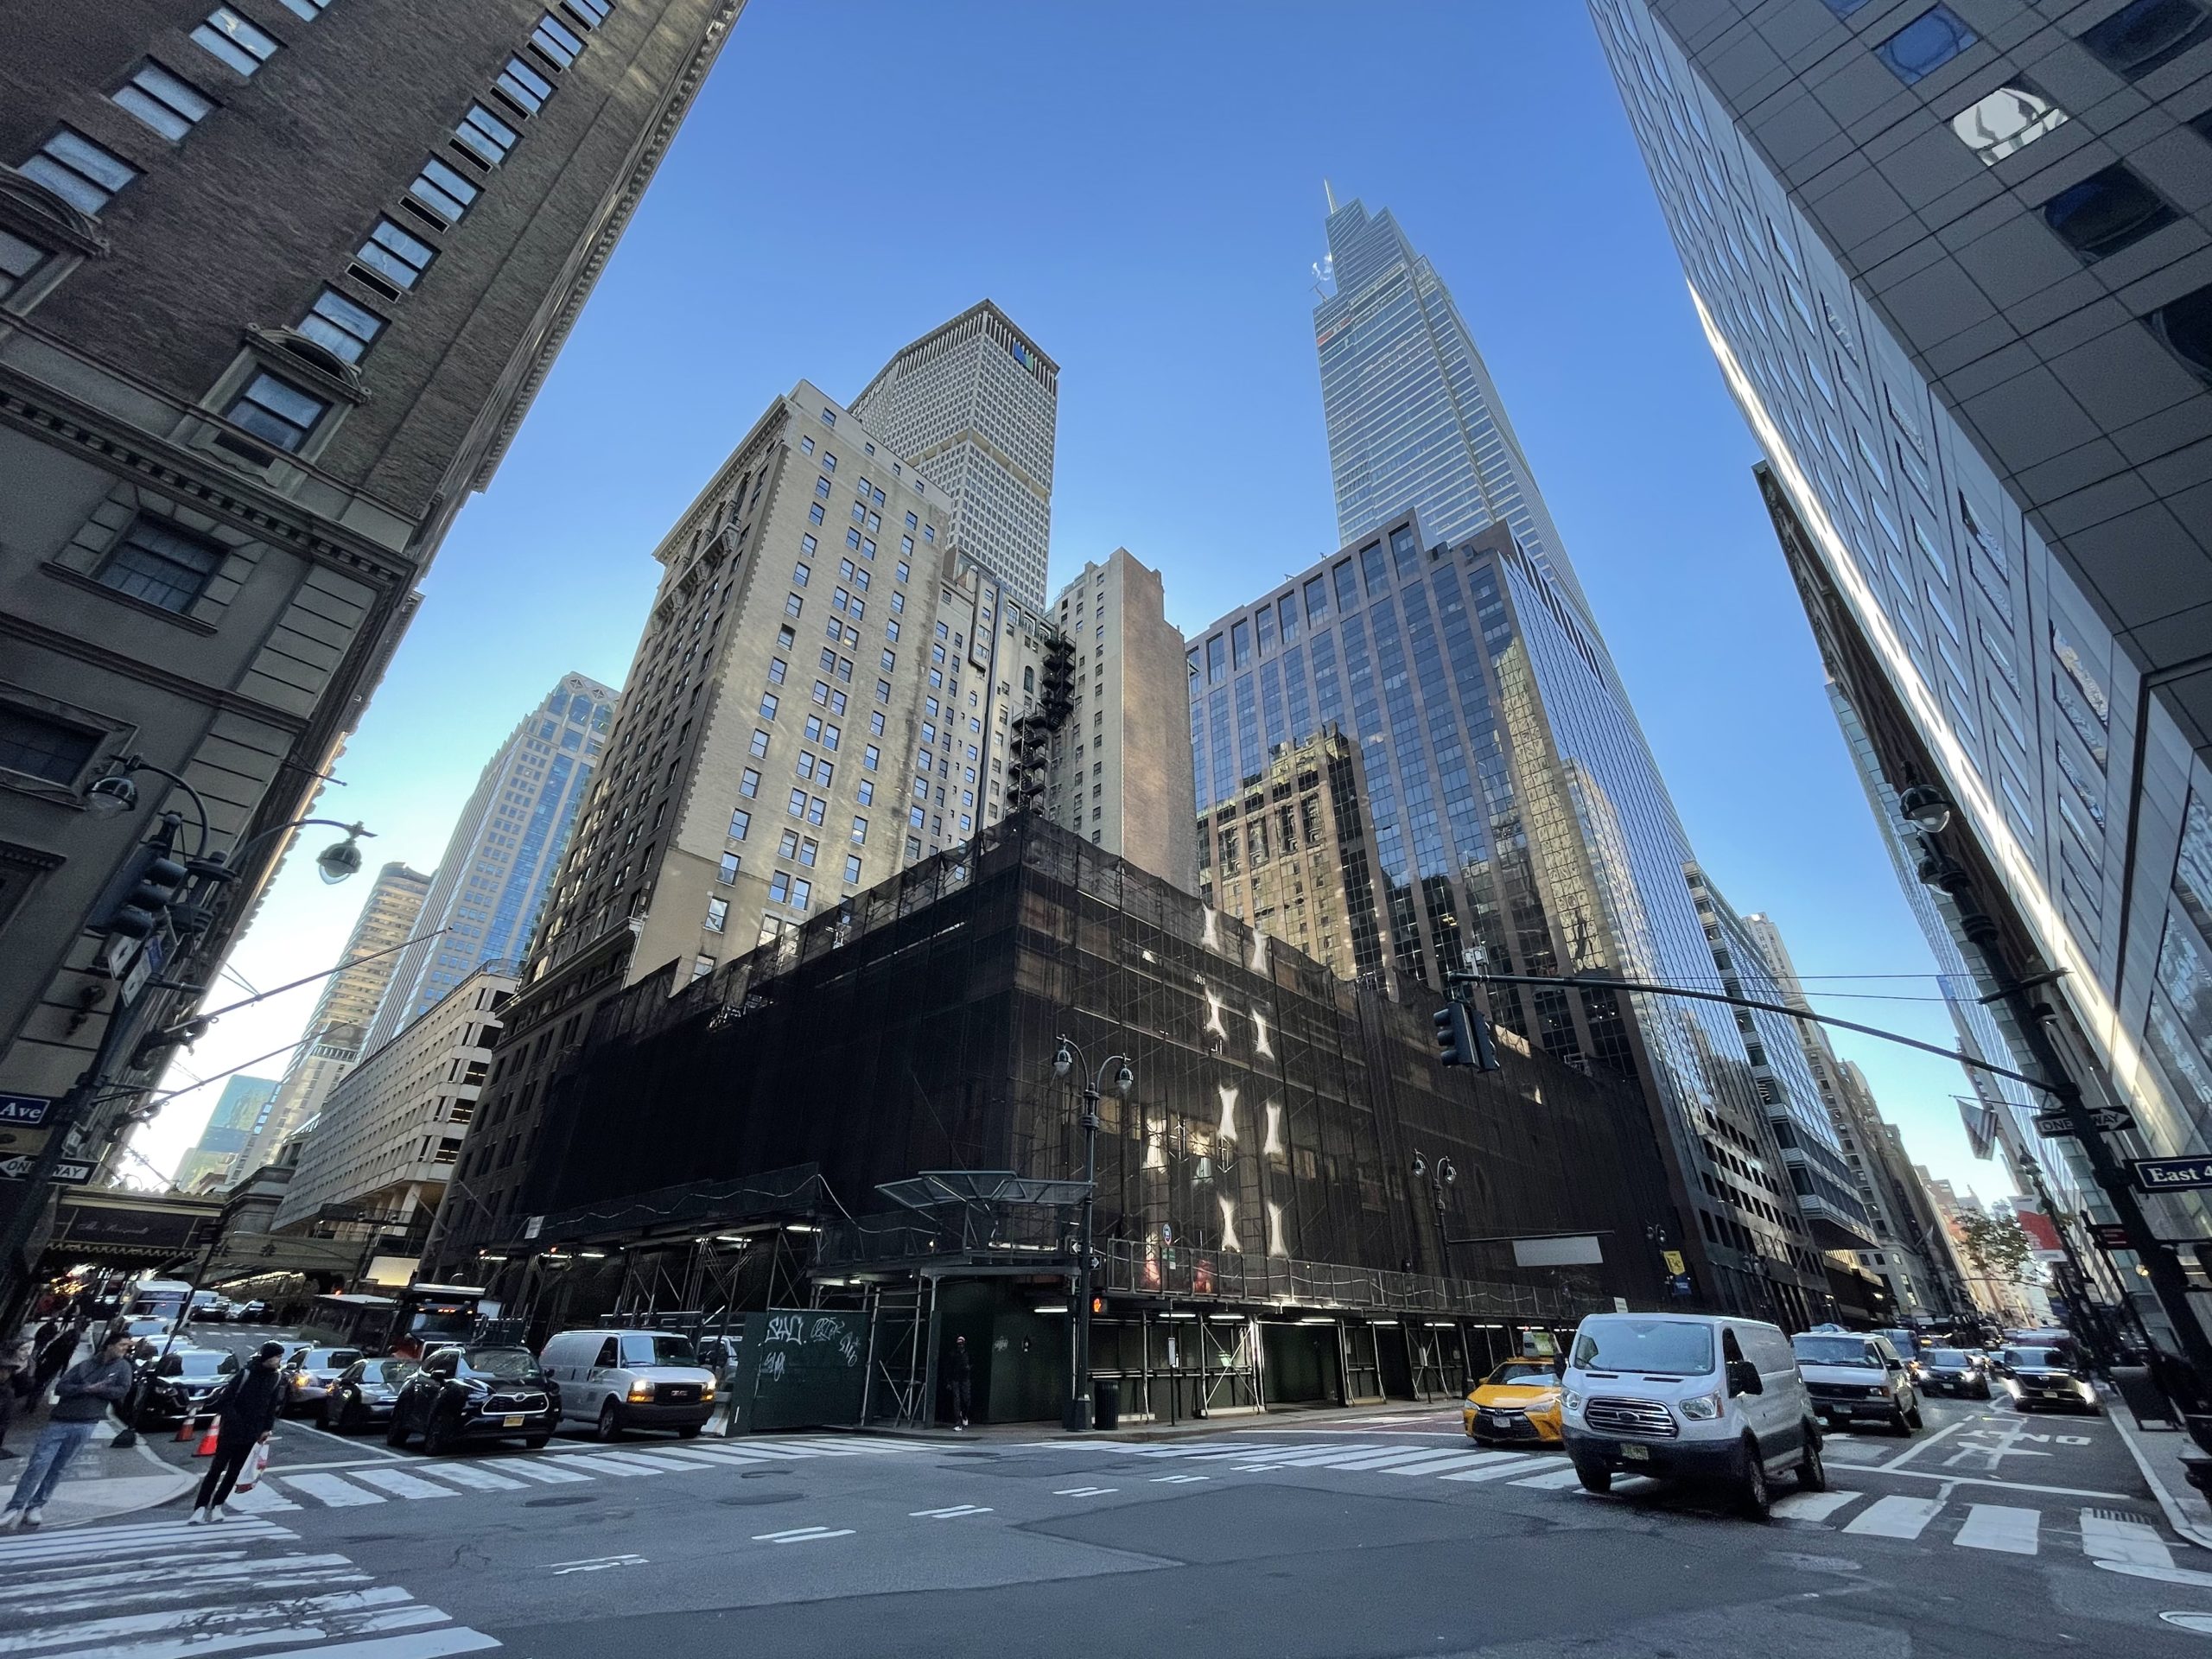
343 Madison Avenue. Photo by Michael Young

Photo by Michael Young
606 West 30th Street. Photo by Michael Young
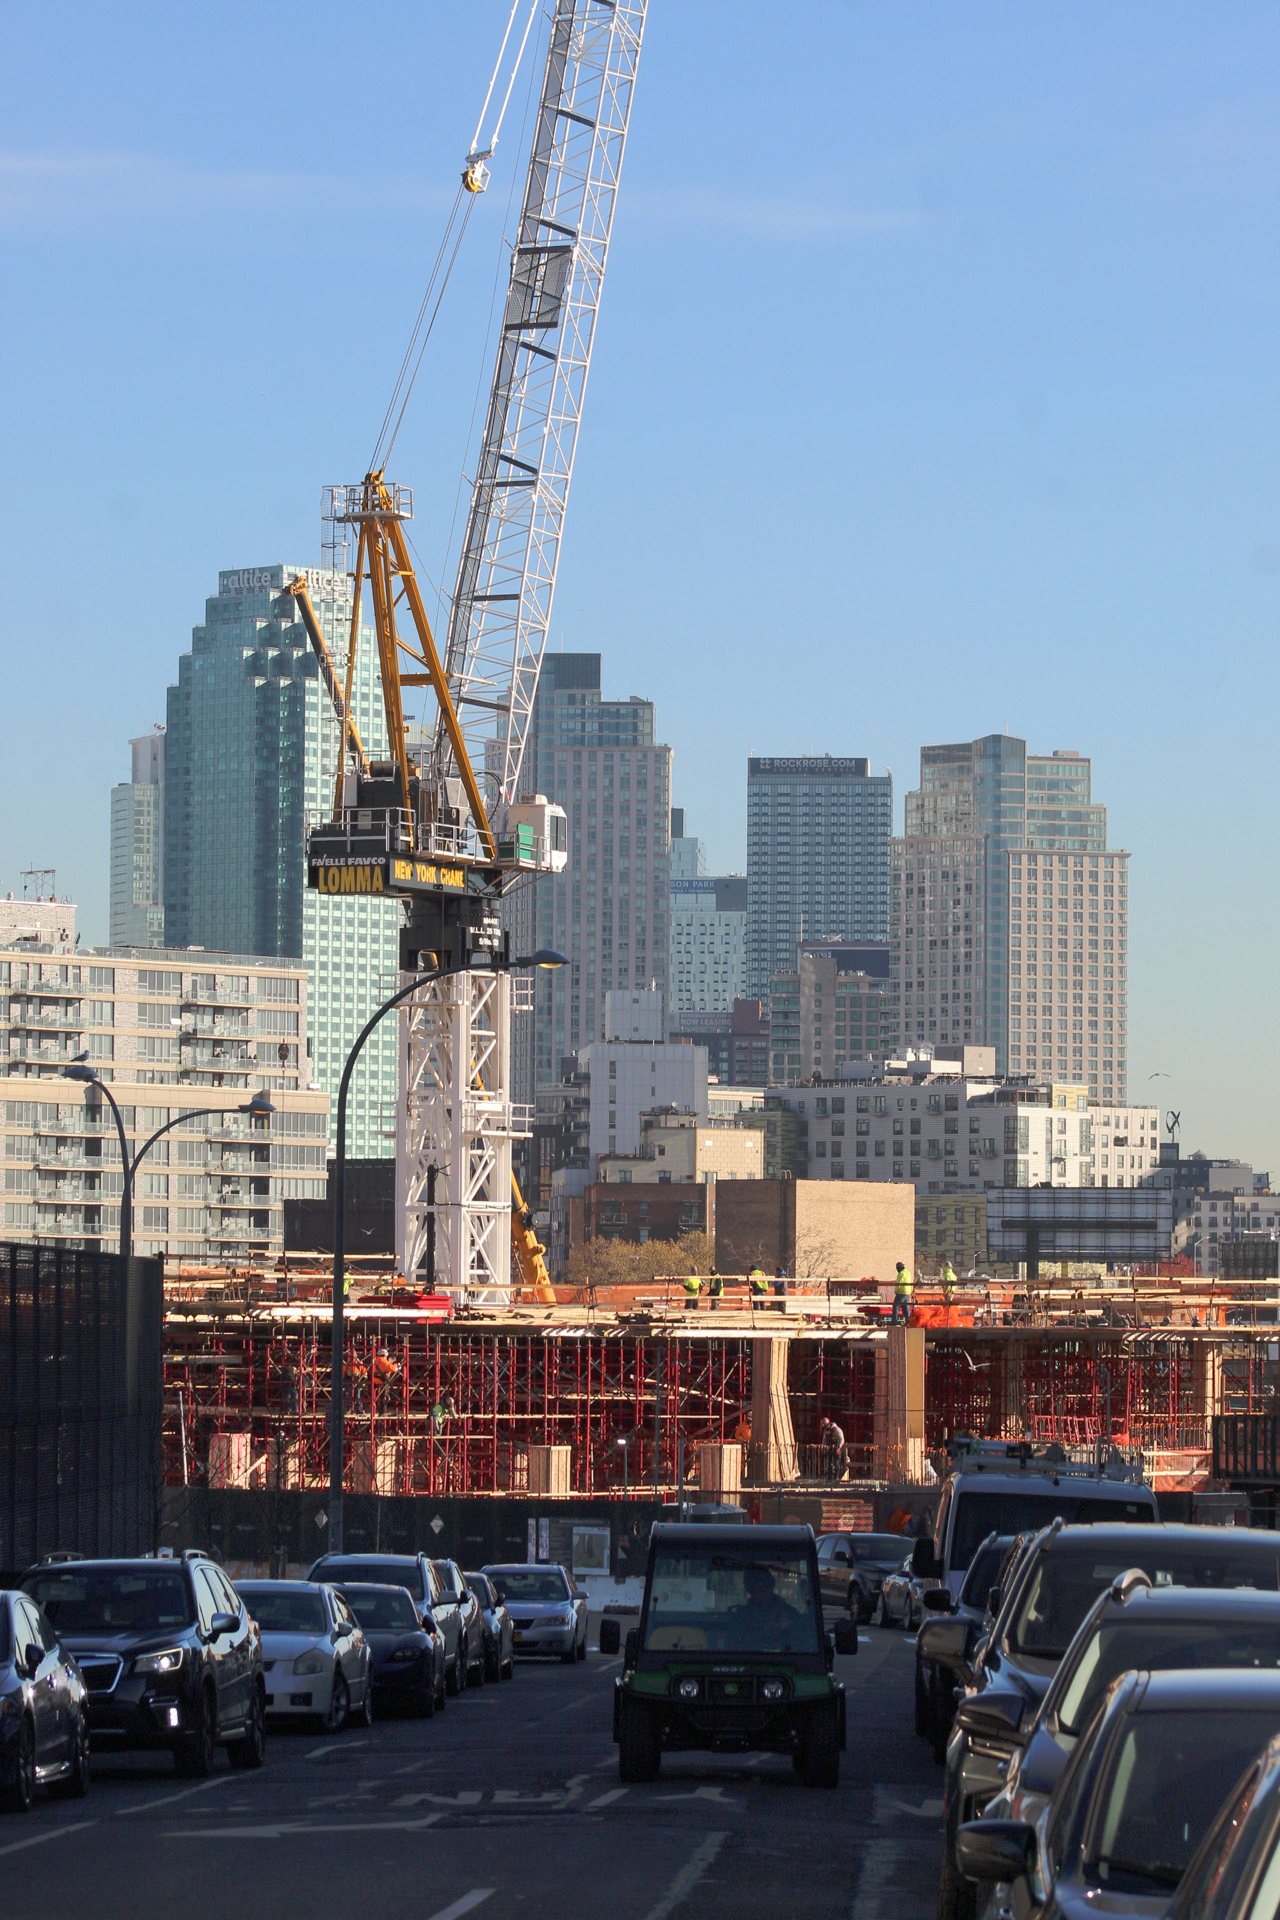
2-20 Malt Drive. Photo by Michael Young
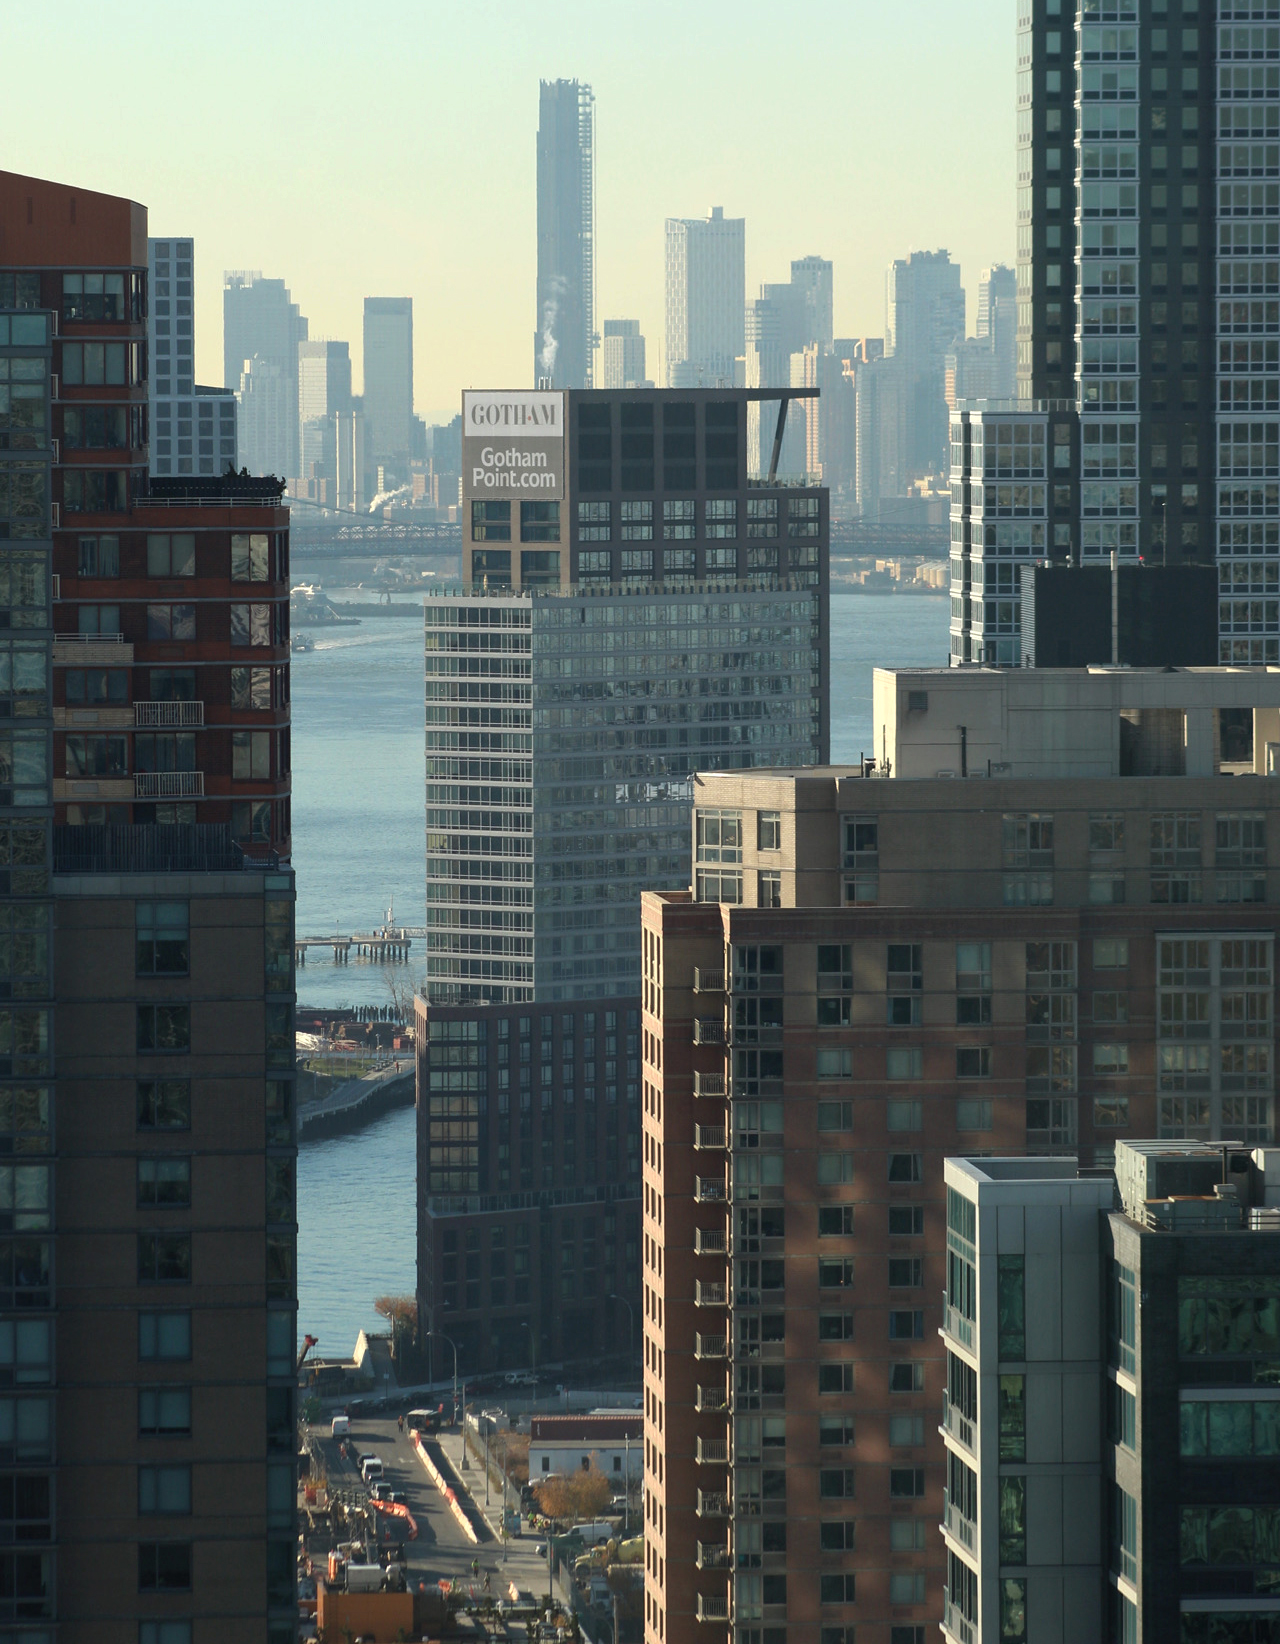
Parcel F at Gotham Point. Photo by Michael Young
Virgin Hotels New York City. Photo by Michael Young

Photo by Michael Young
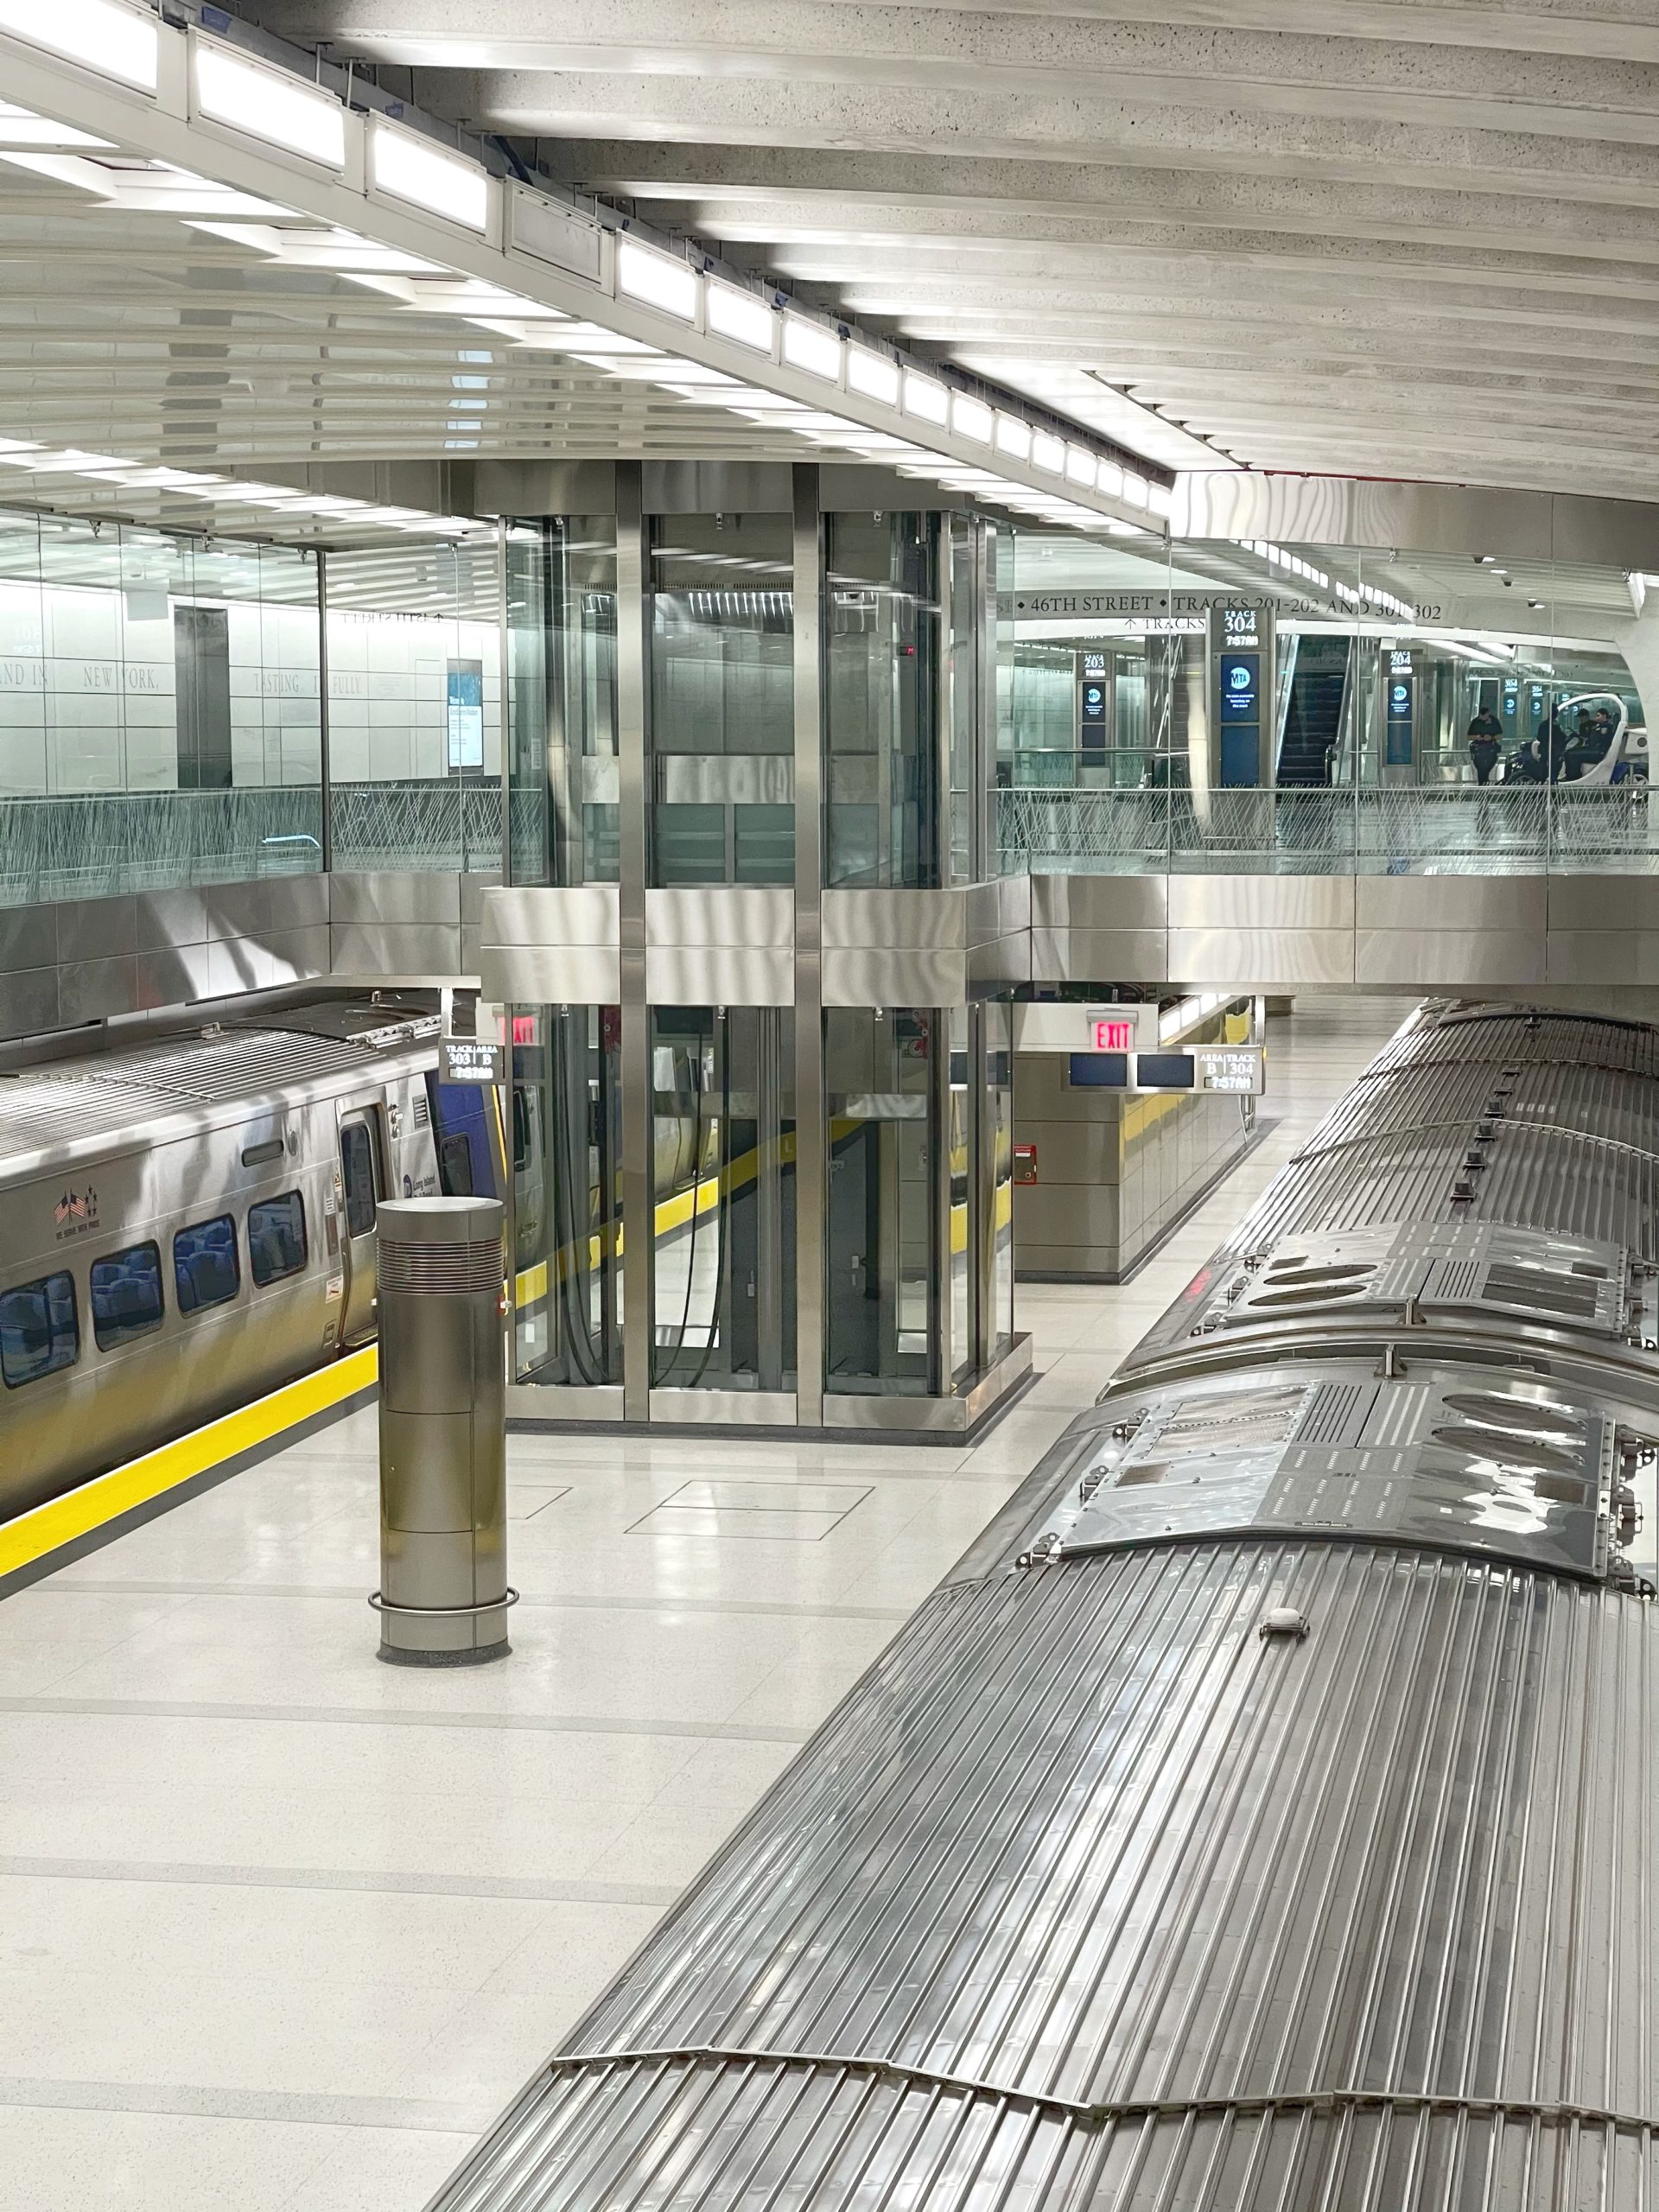
Grand Central Madison. Photo by Michael Young
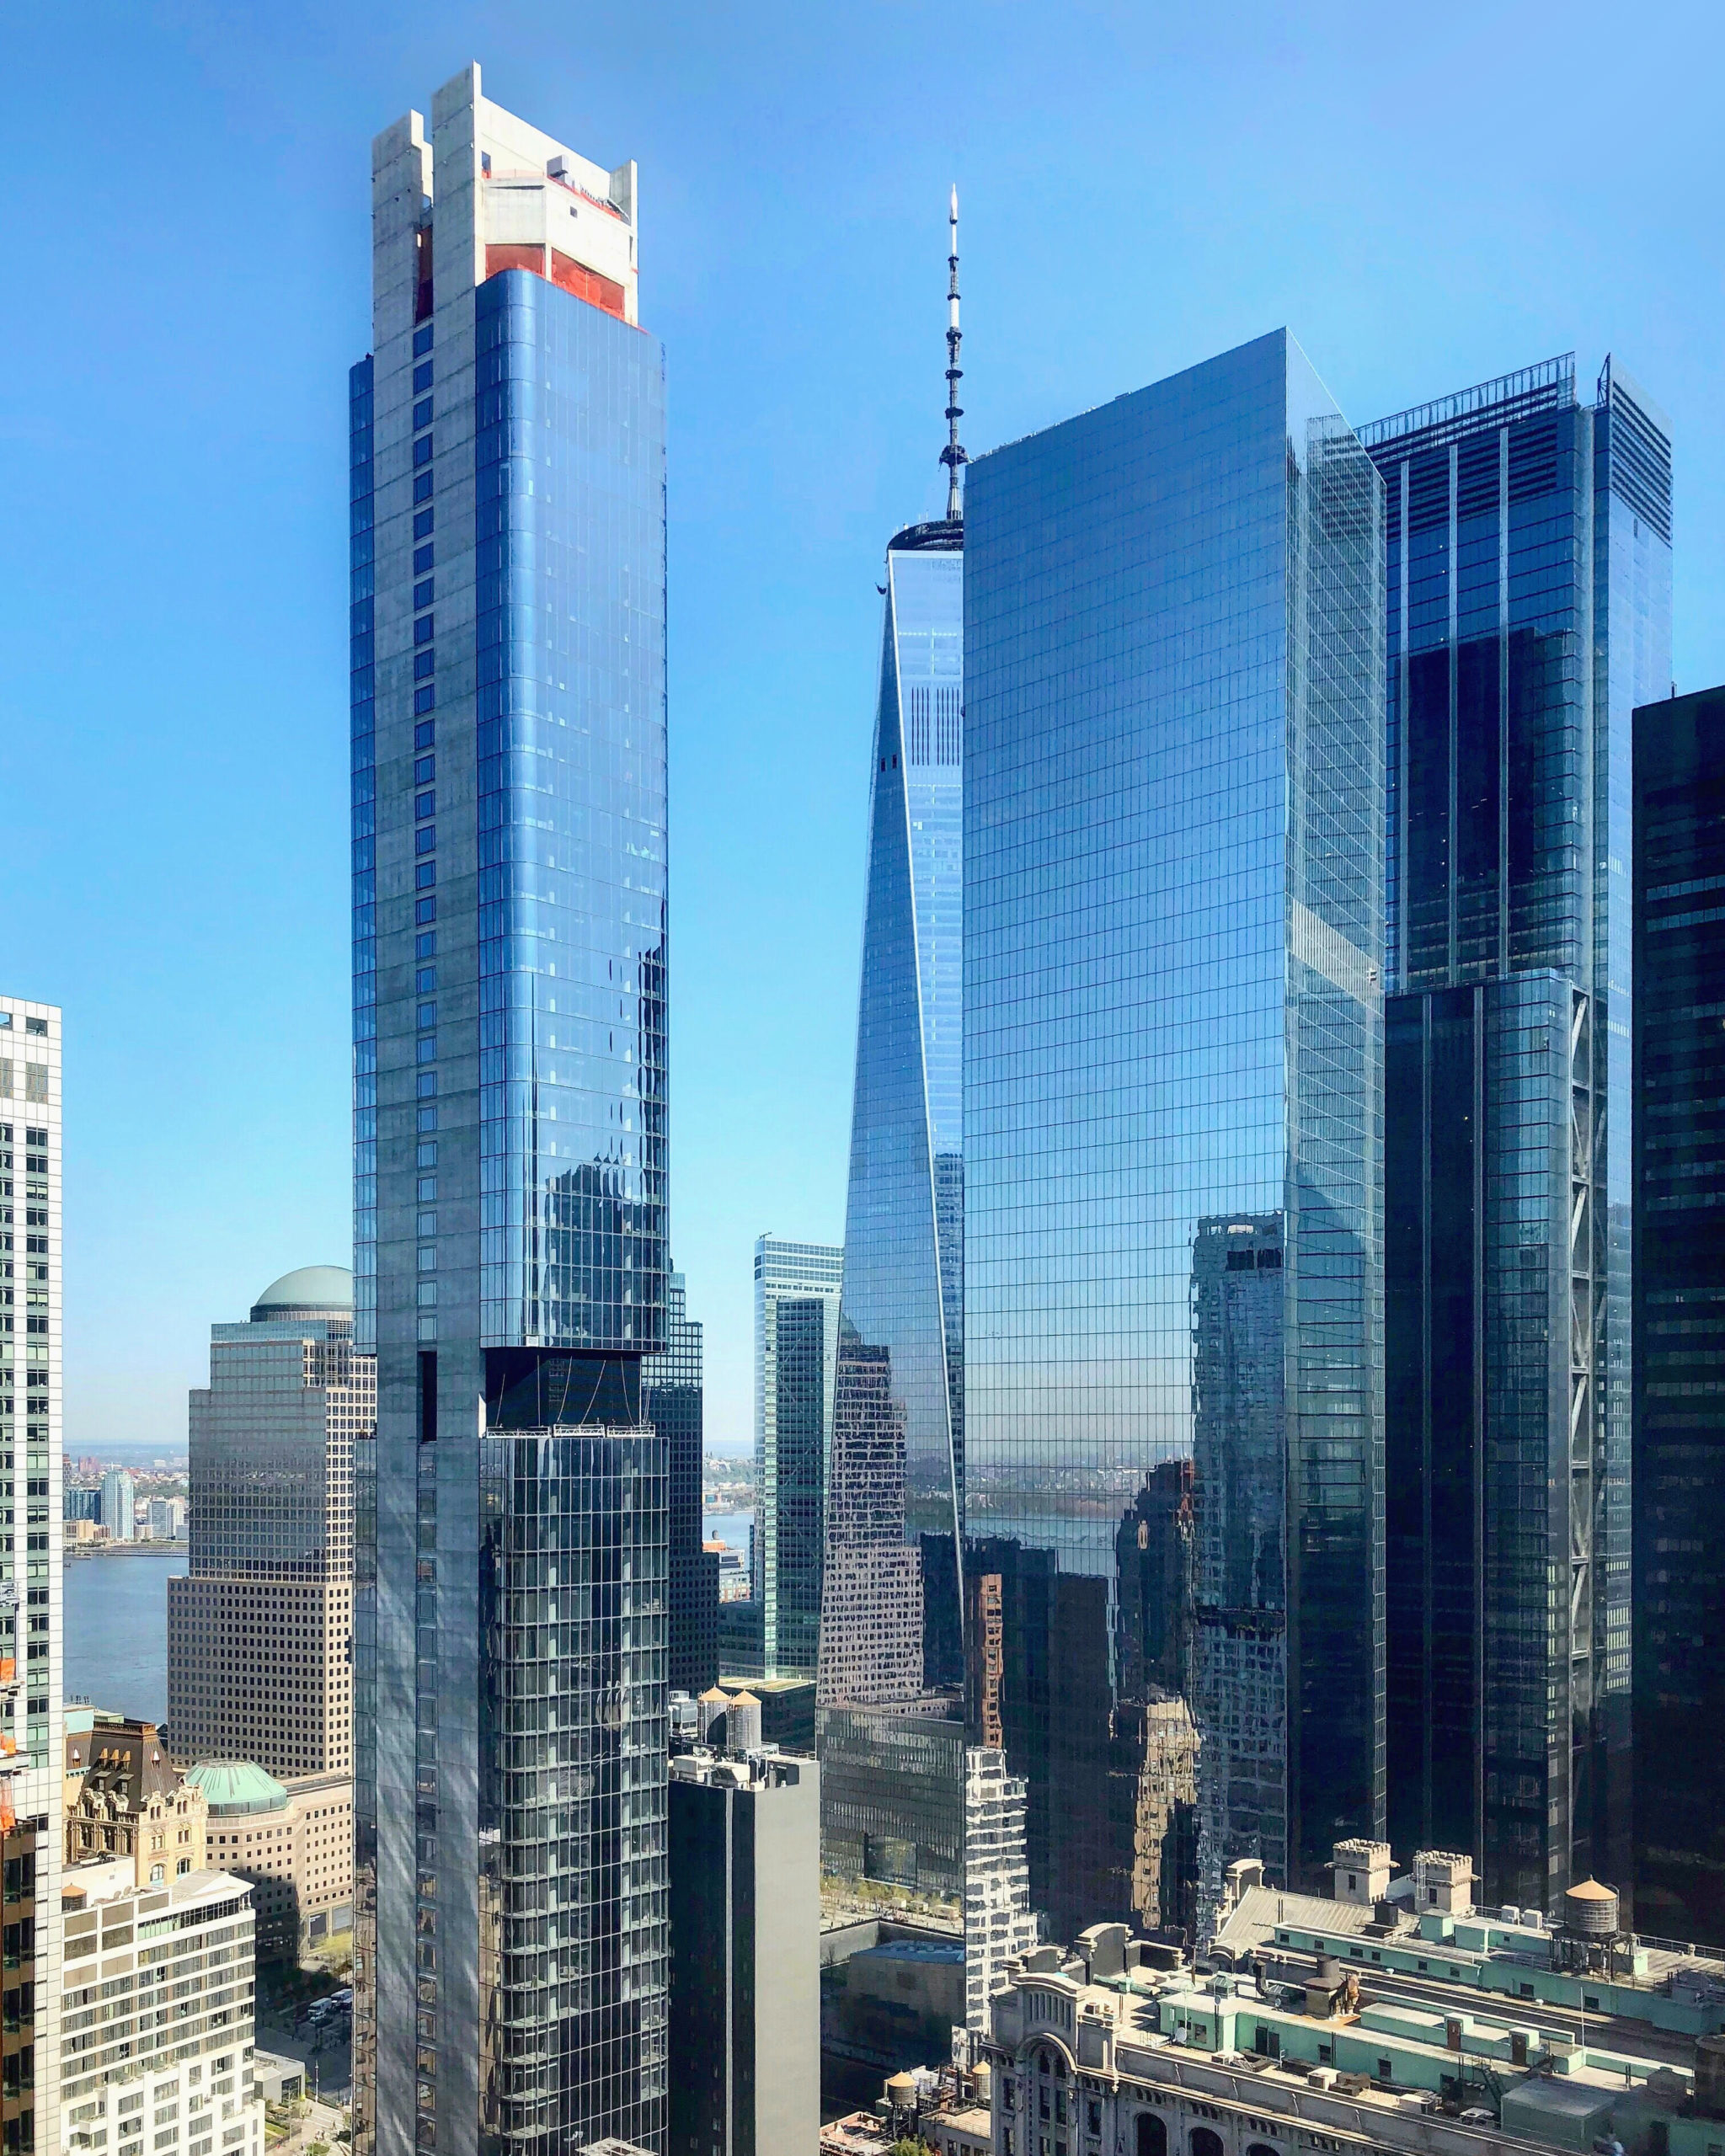
125 Greenwich Street. Photo by Michael Young
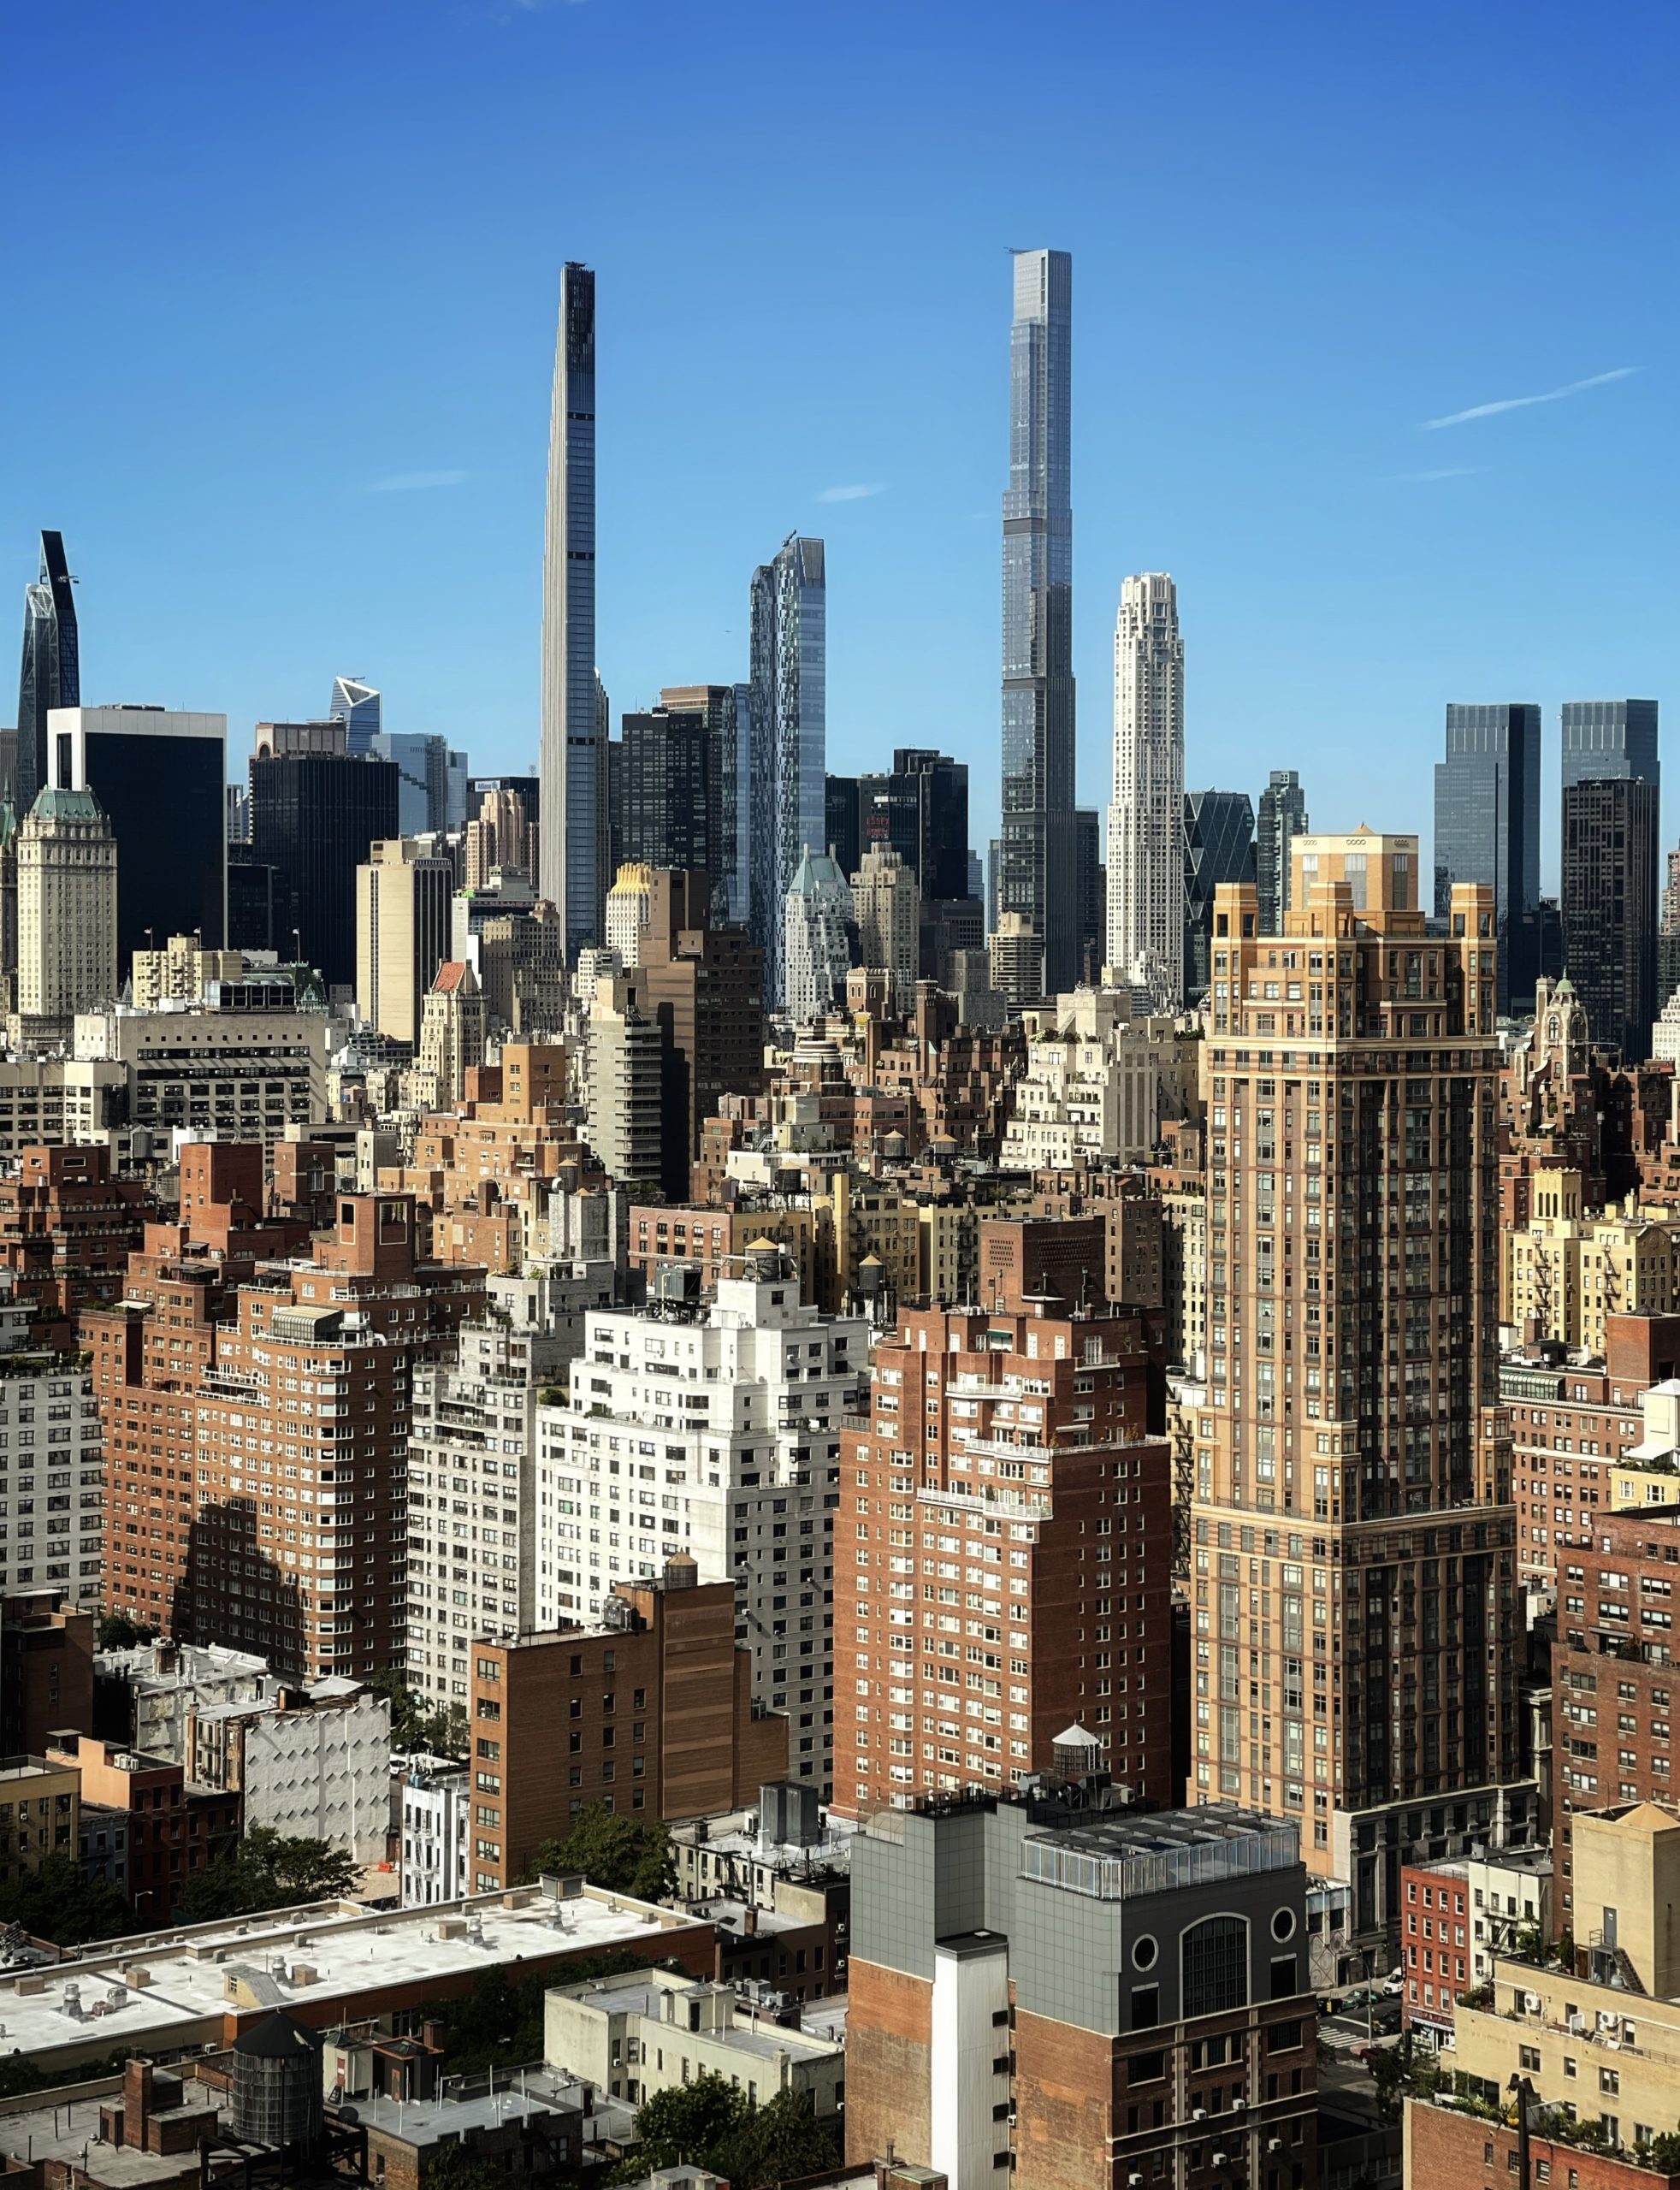
111 West 57th Street (center left) Photo by Michael Young
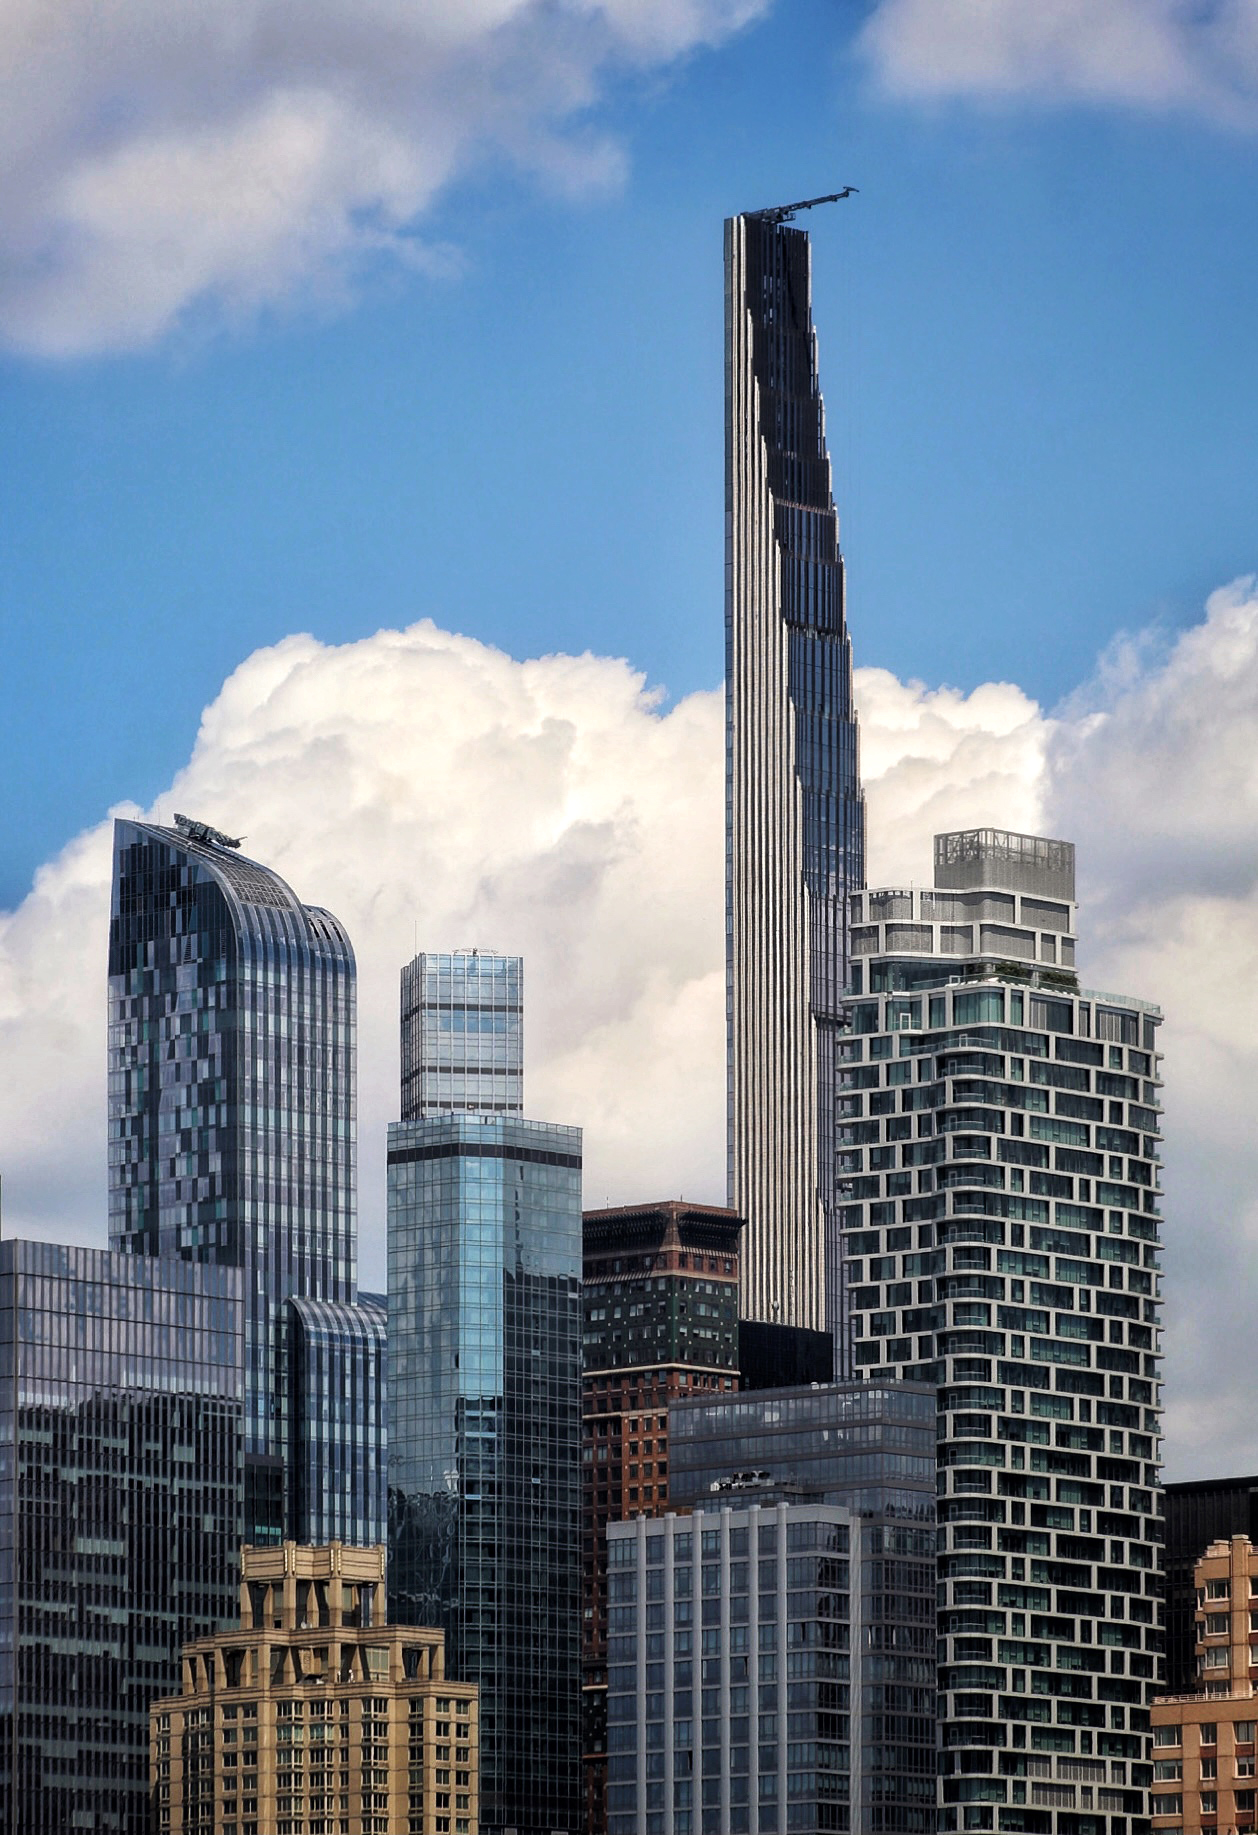
Photo by Michael Young
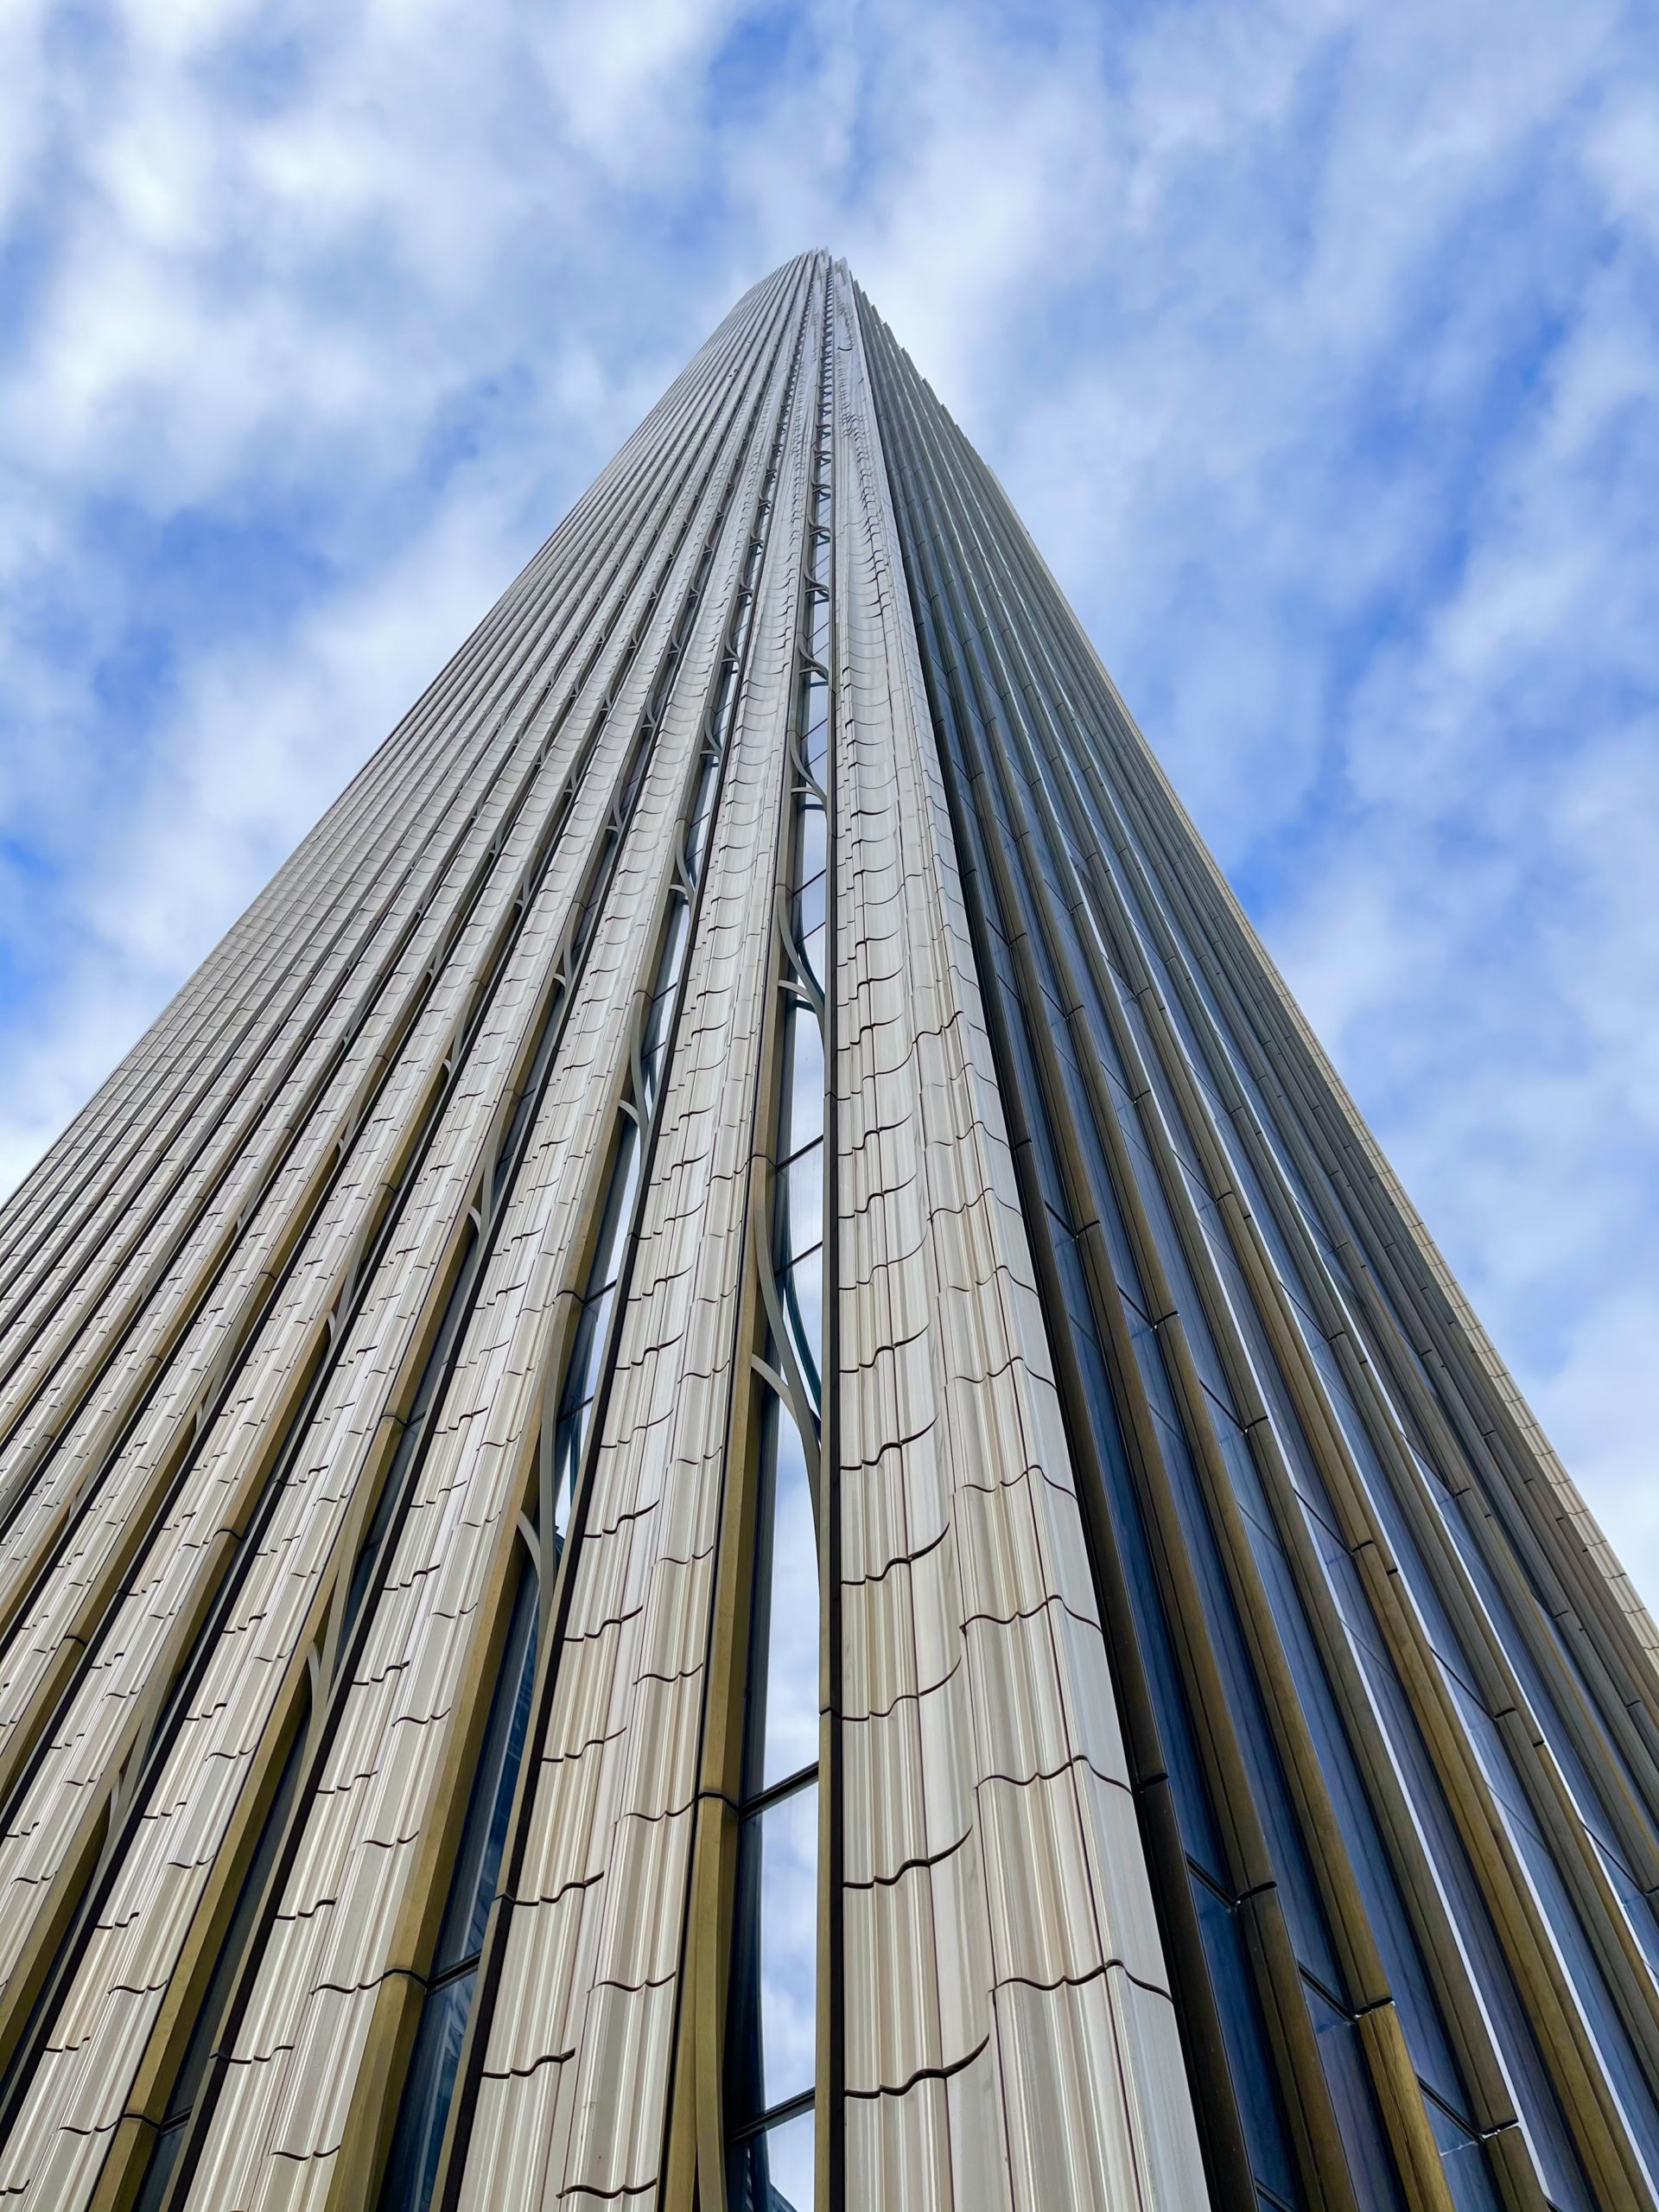
Photo by Michael Young
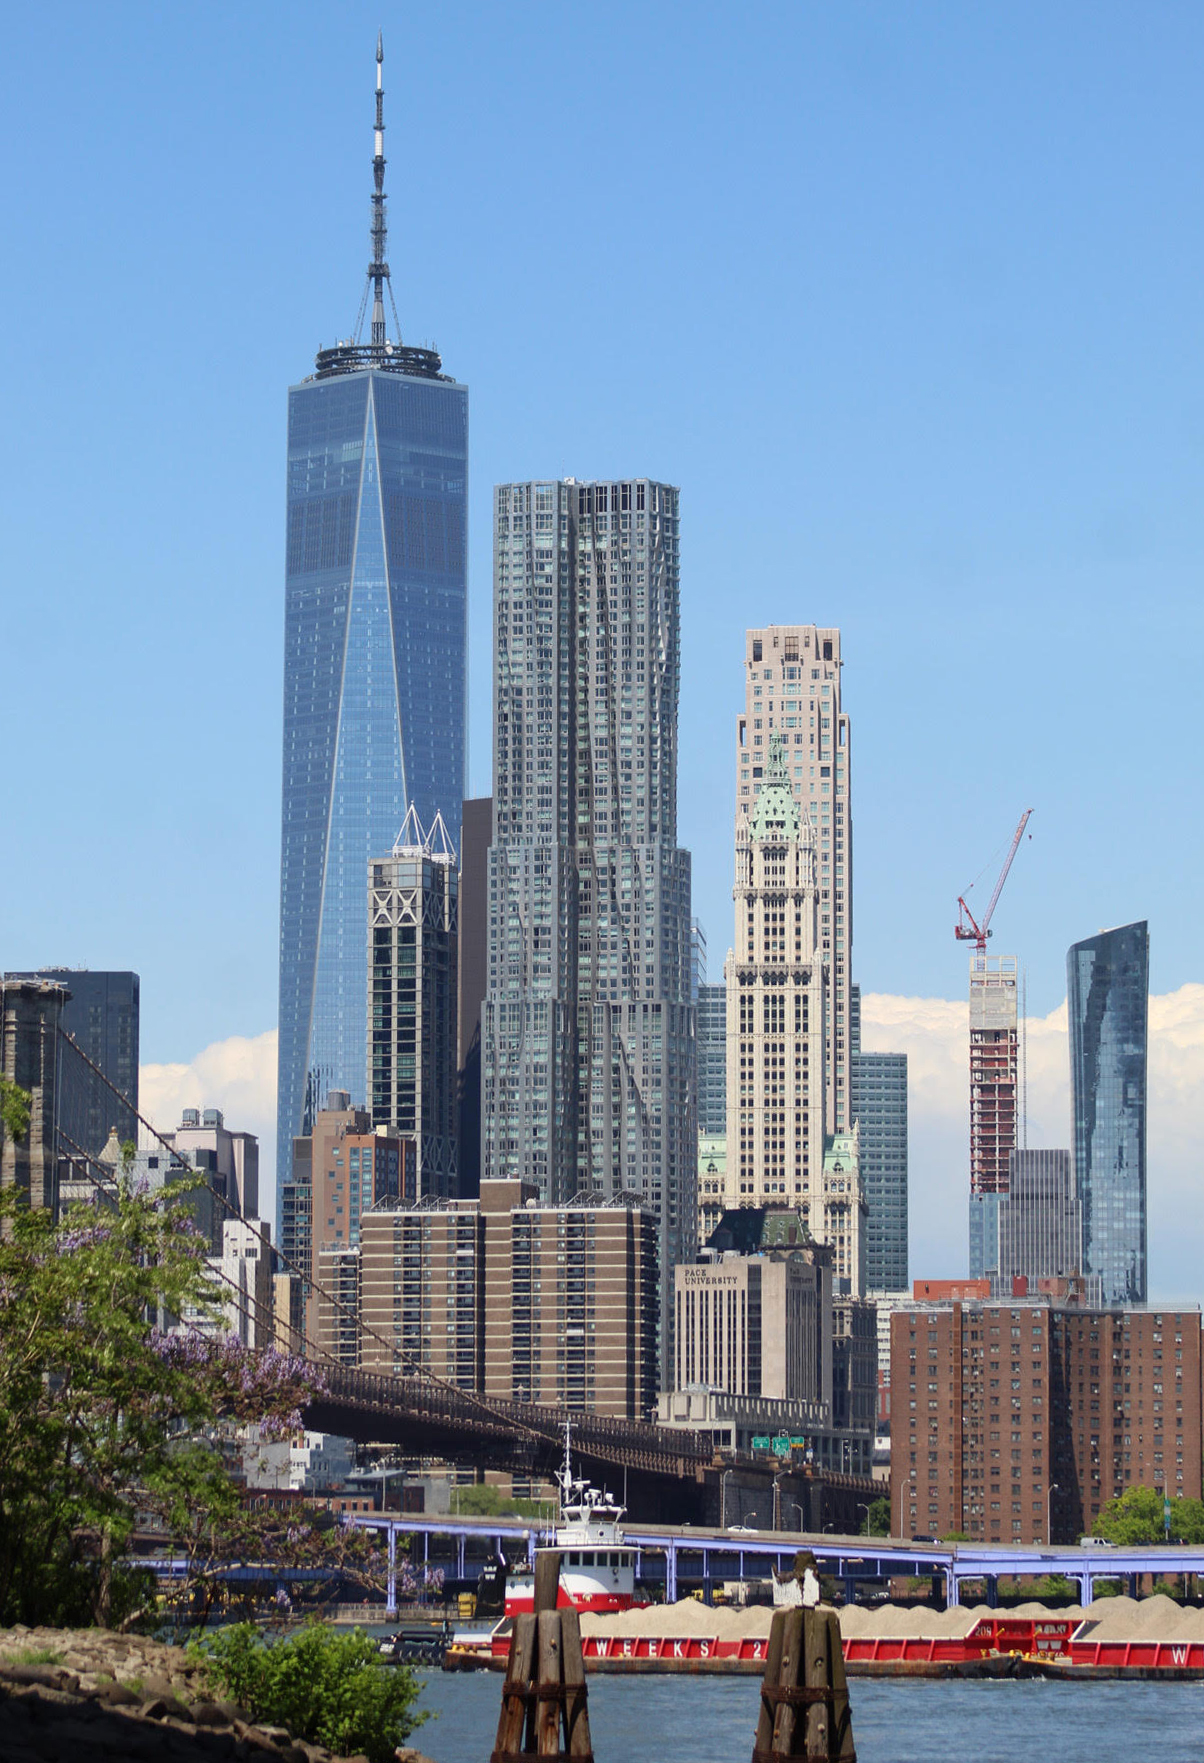
45 Park Place (right) seen from Brooklyn. Photo by Michael Young
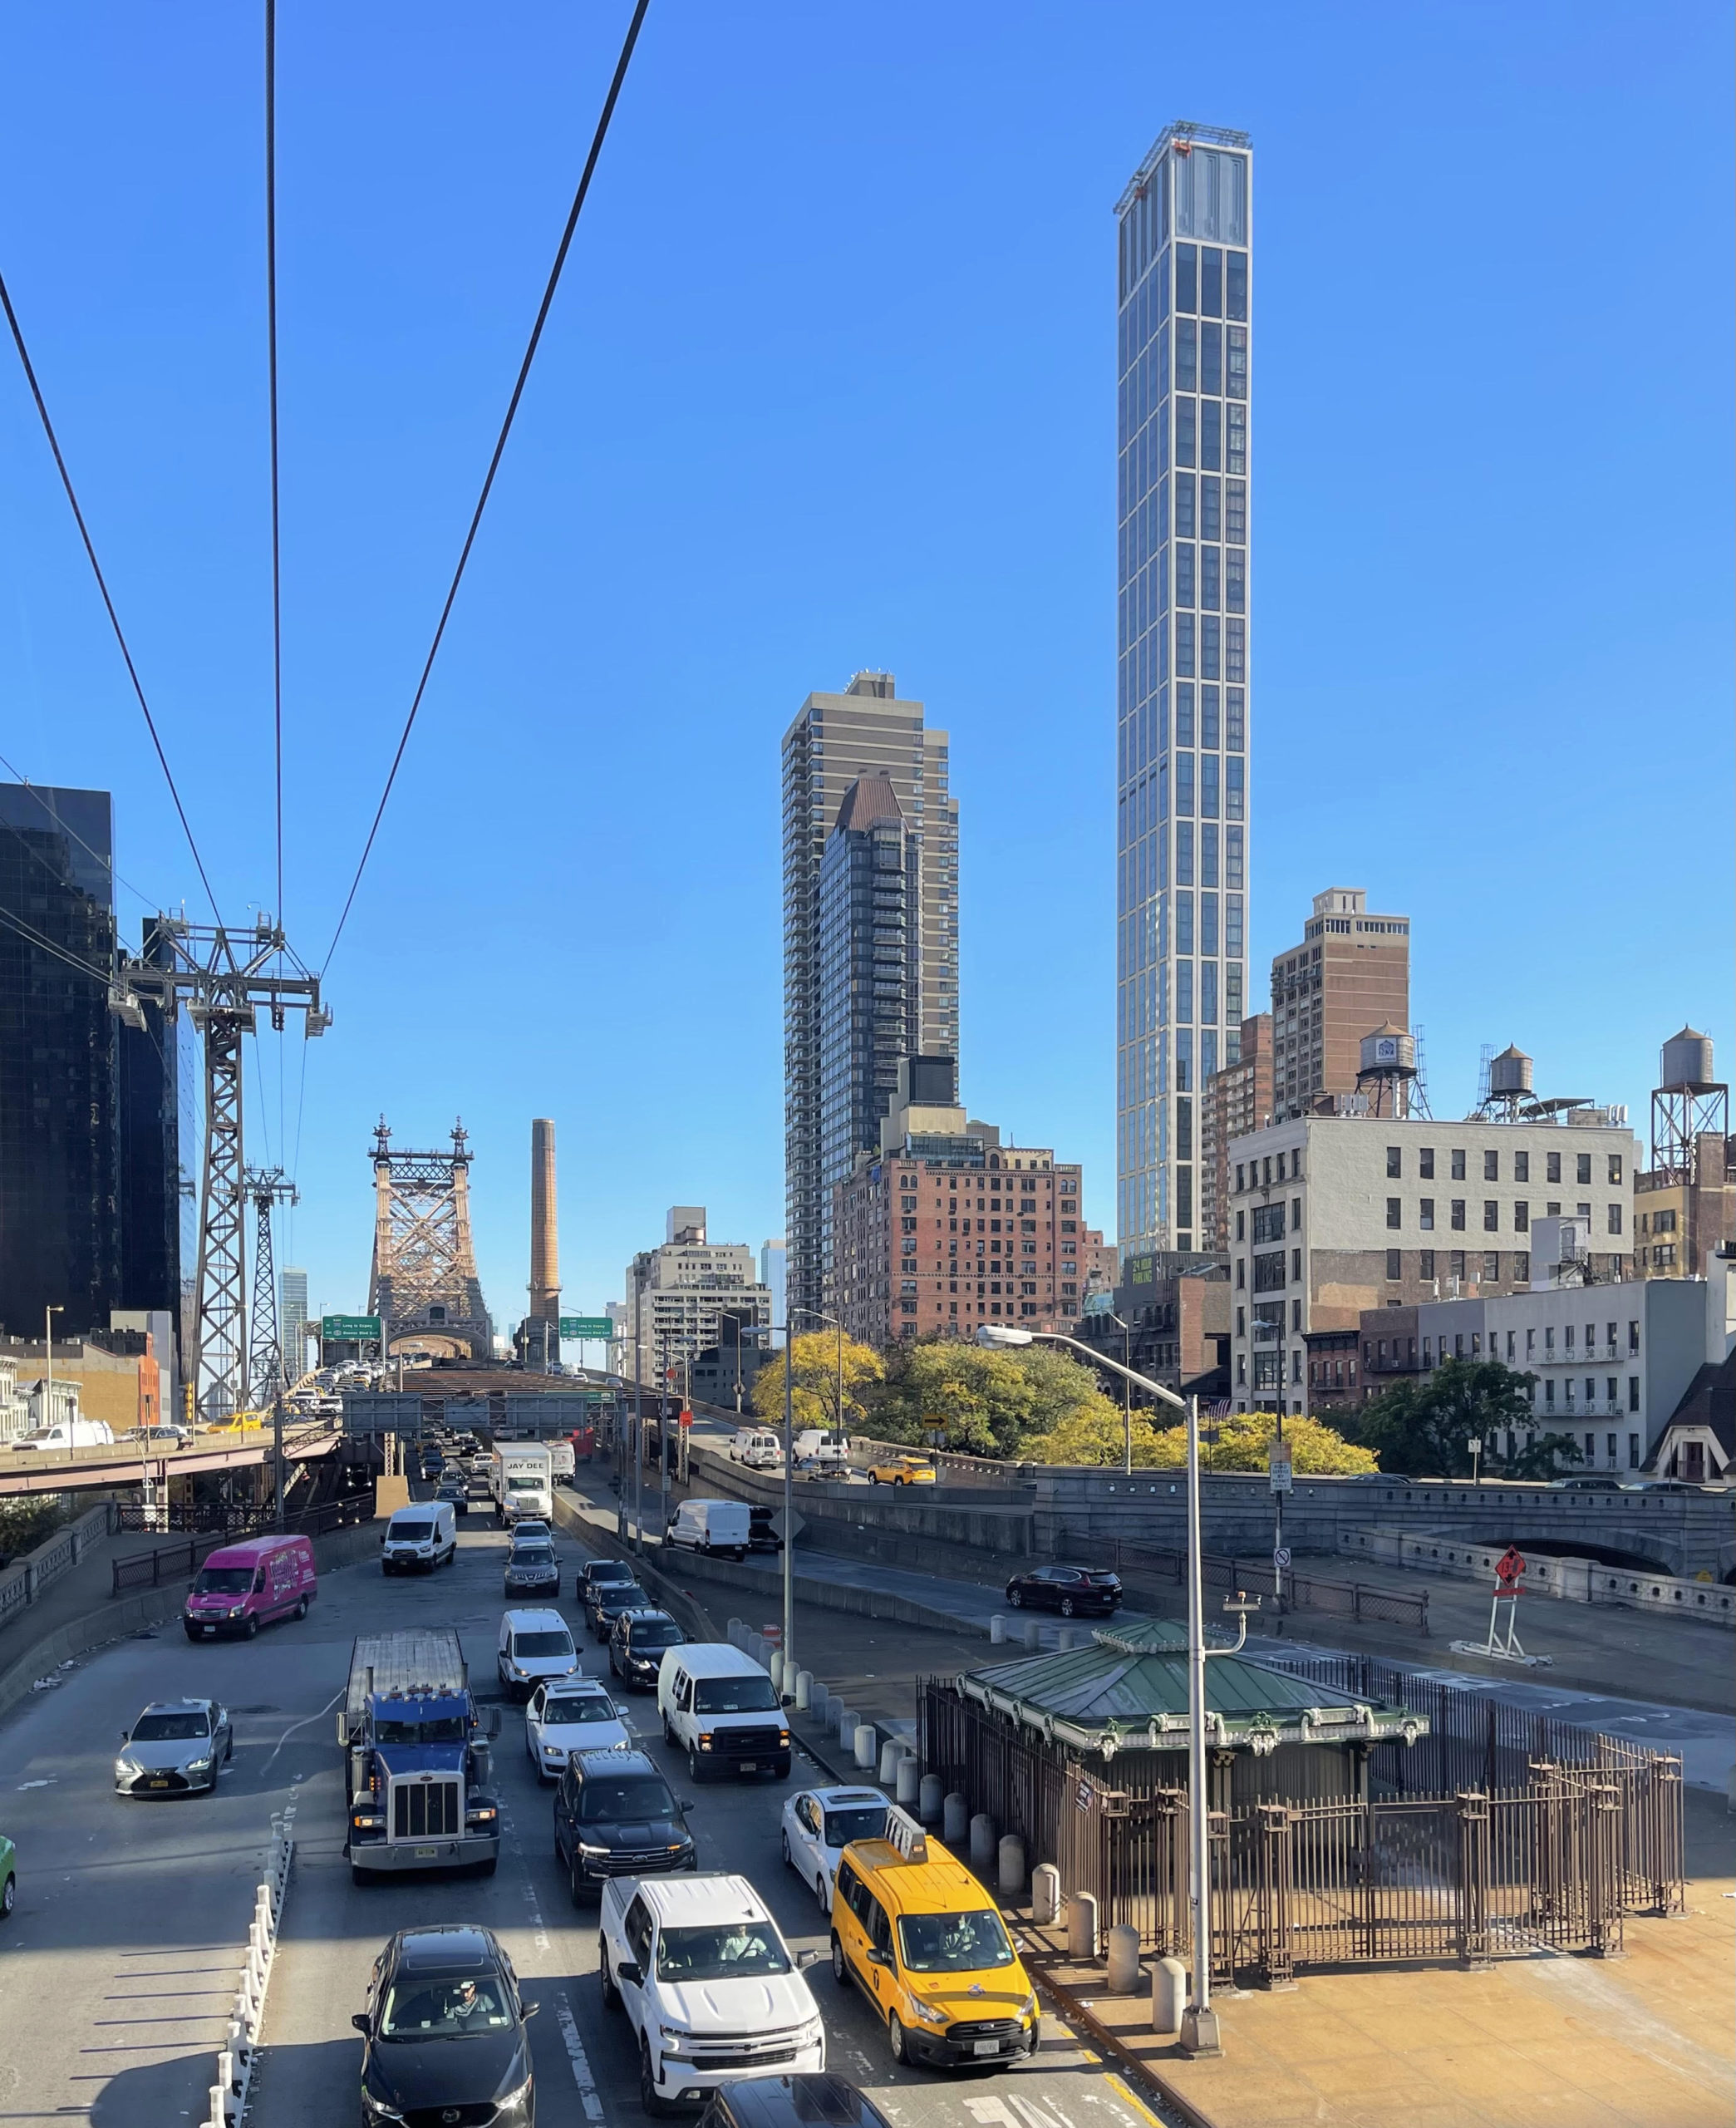
Sutton Tower. Photo by Michael Young
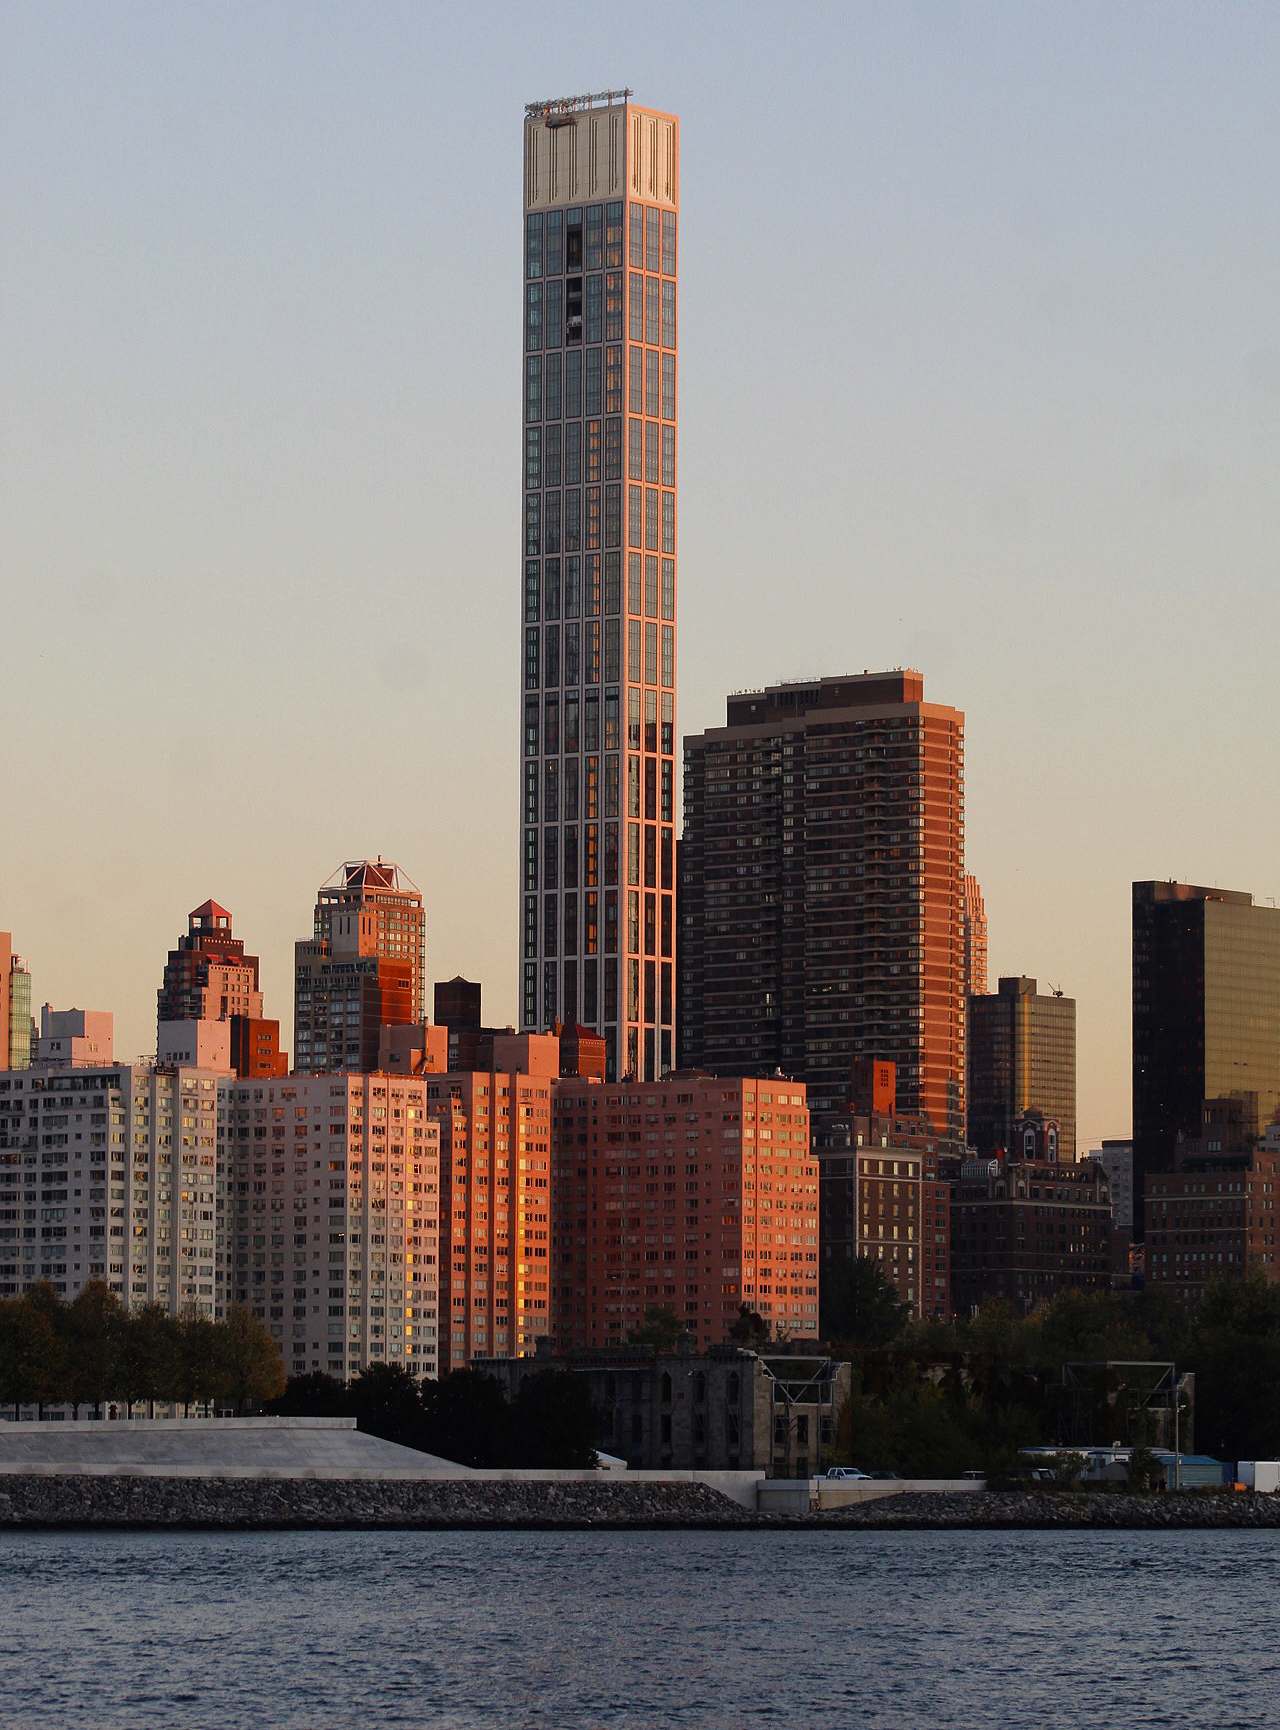
Sutton Tower. Photo by Michael Young
Photo by Michael Young
Photo by Michael Young
Photo by Michael Young
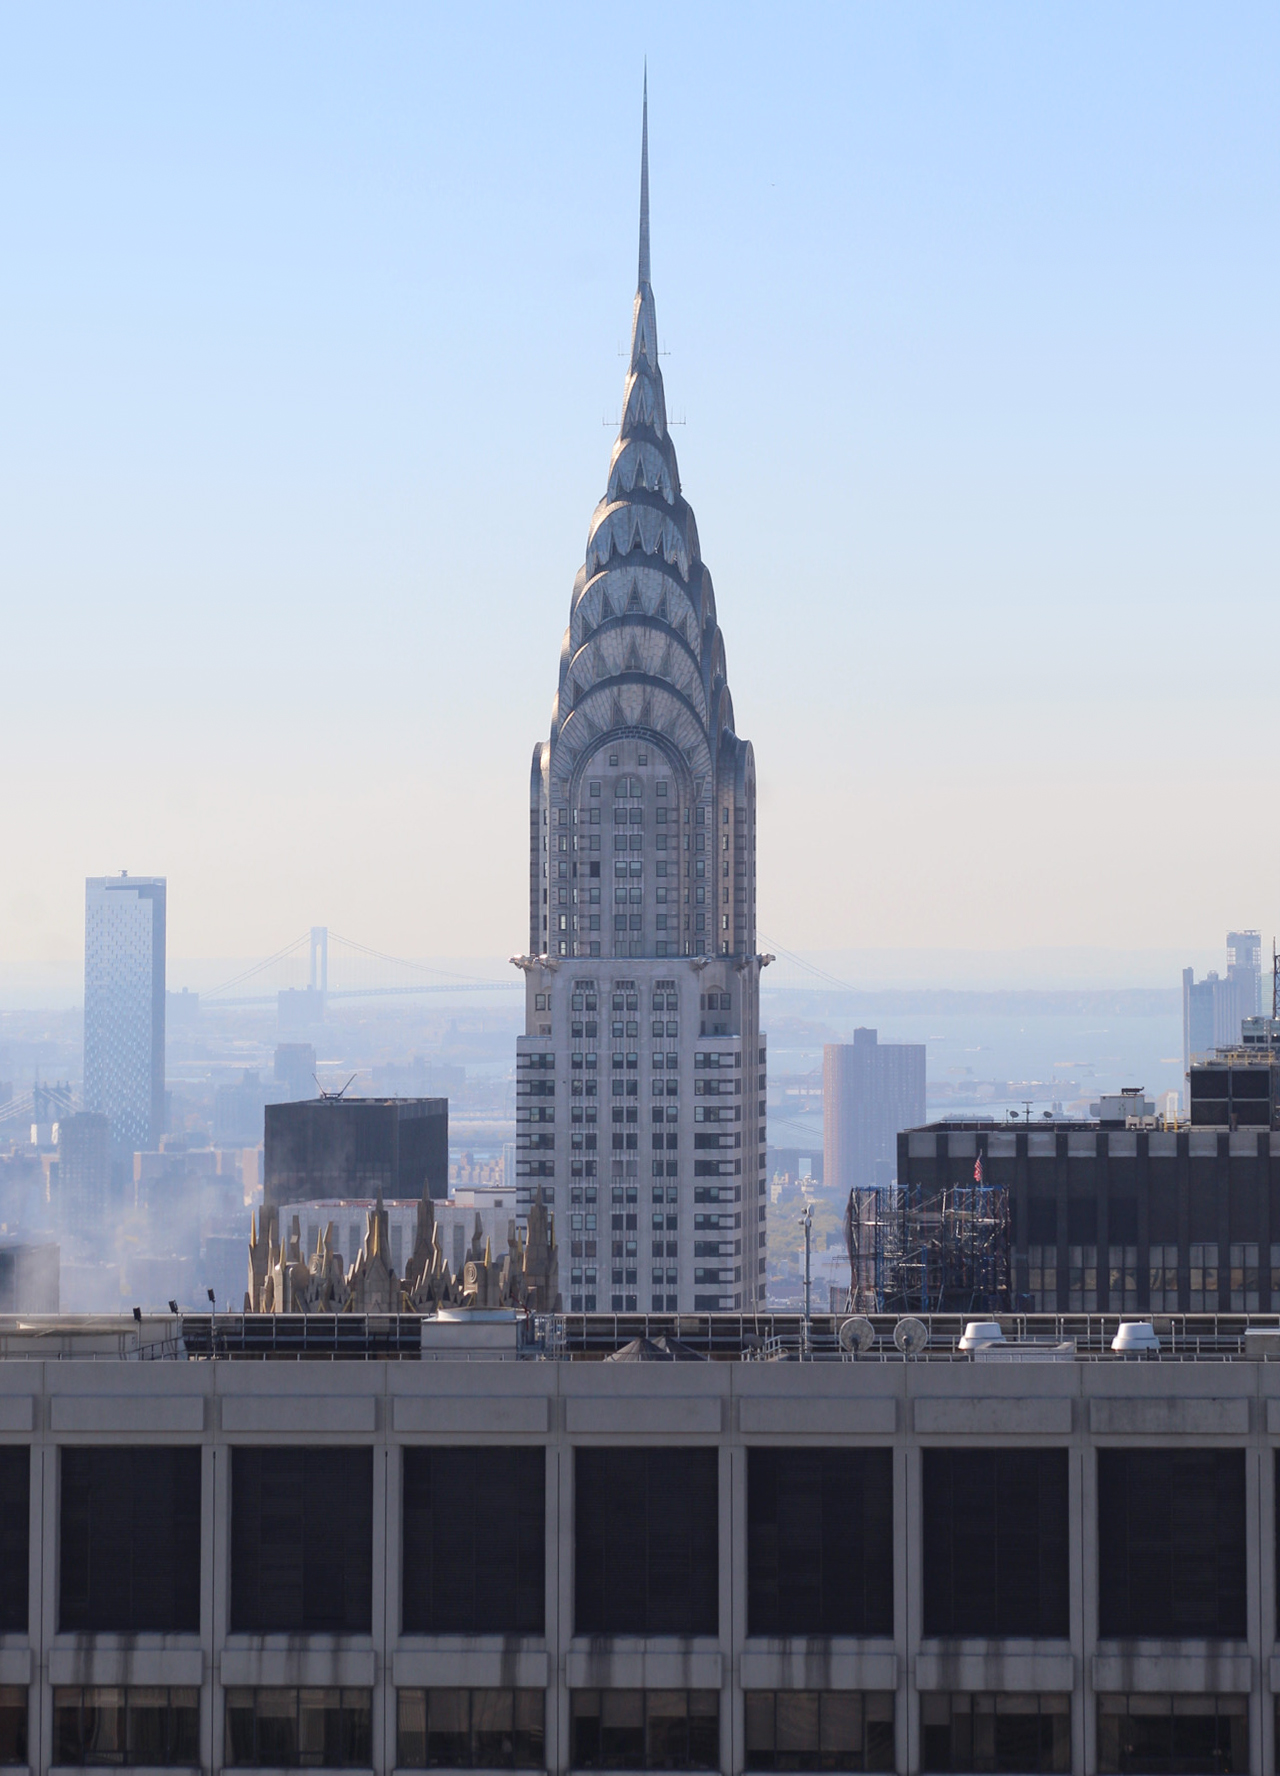
The Chrysler Building.Photo by Michael Young
Photo by Michael Young
Photo by Michael Young
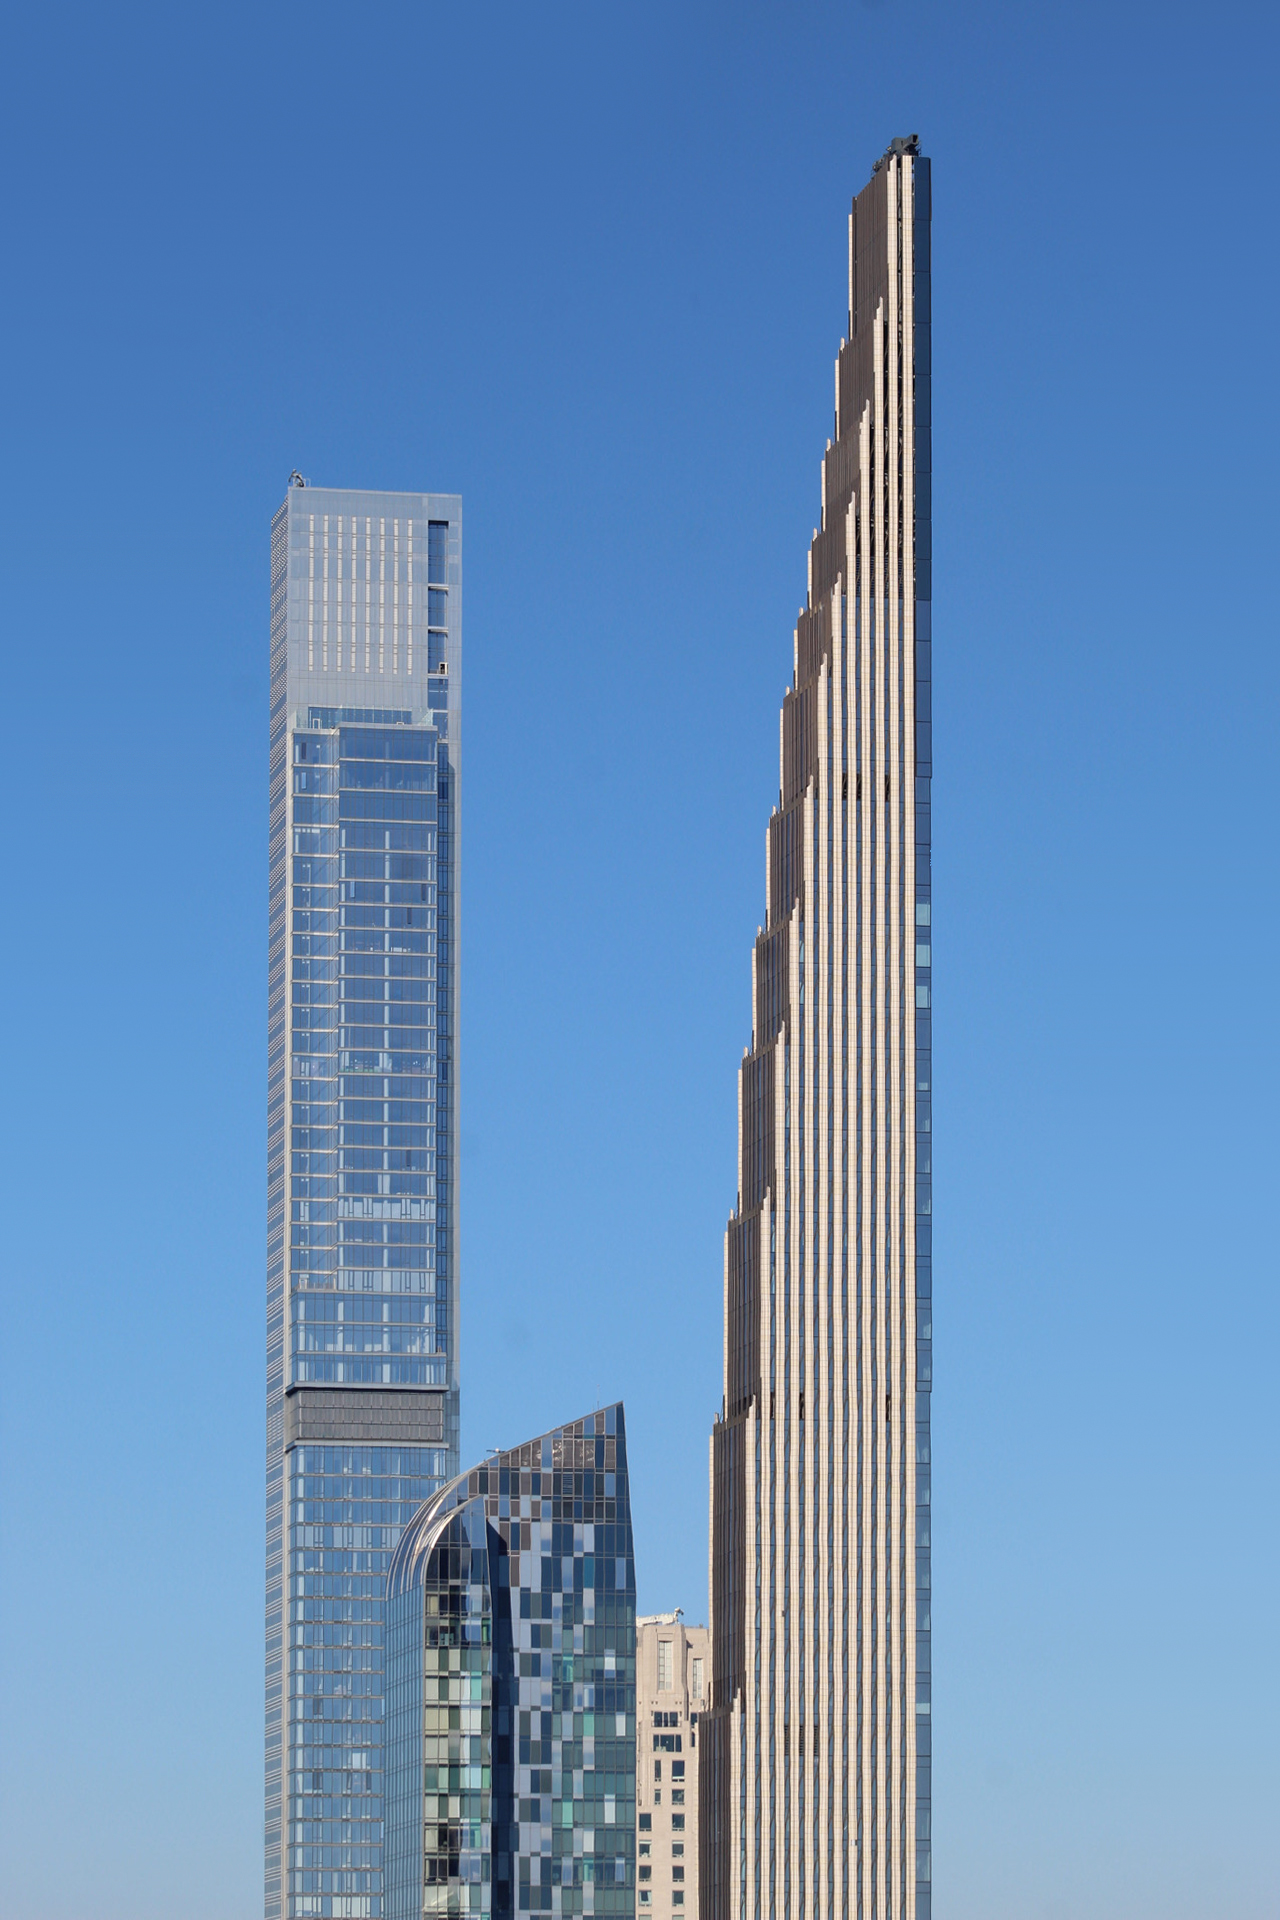
Photo by Michael Young
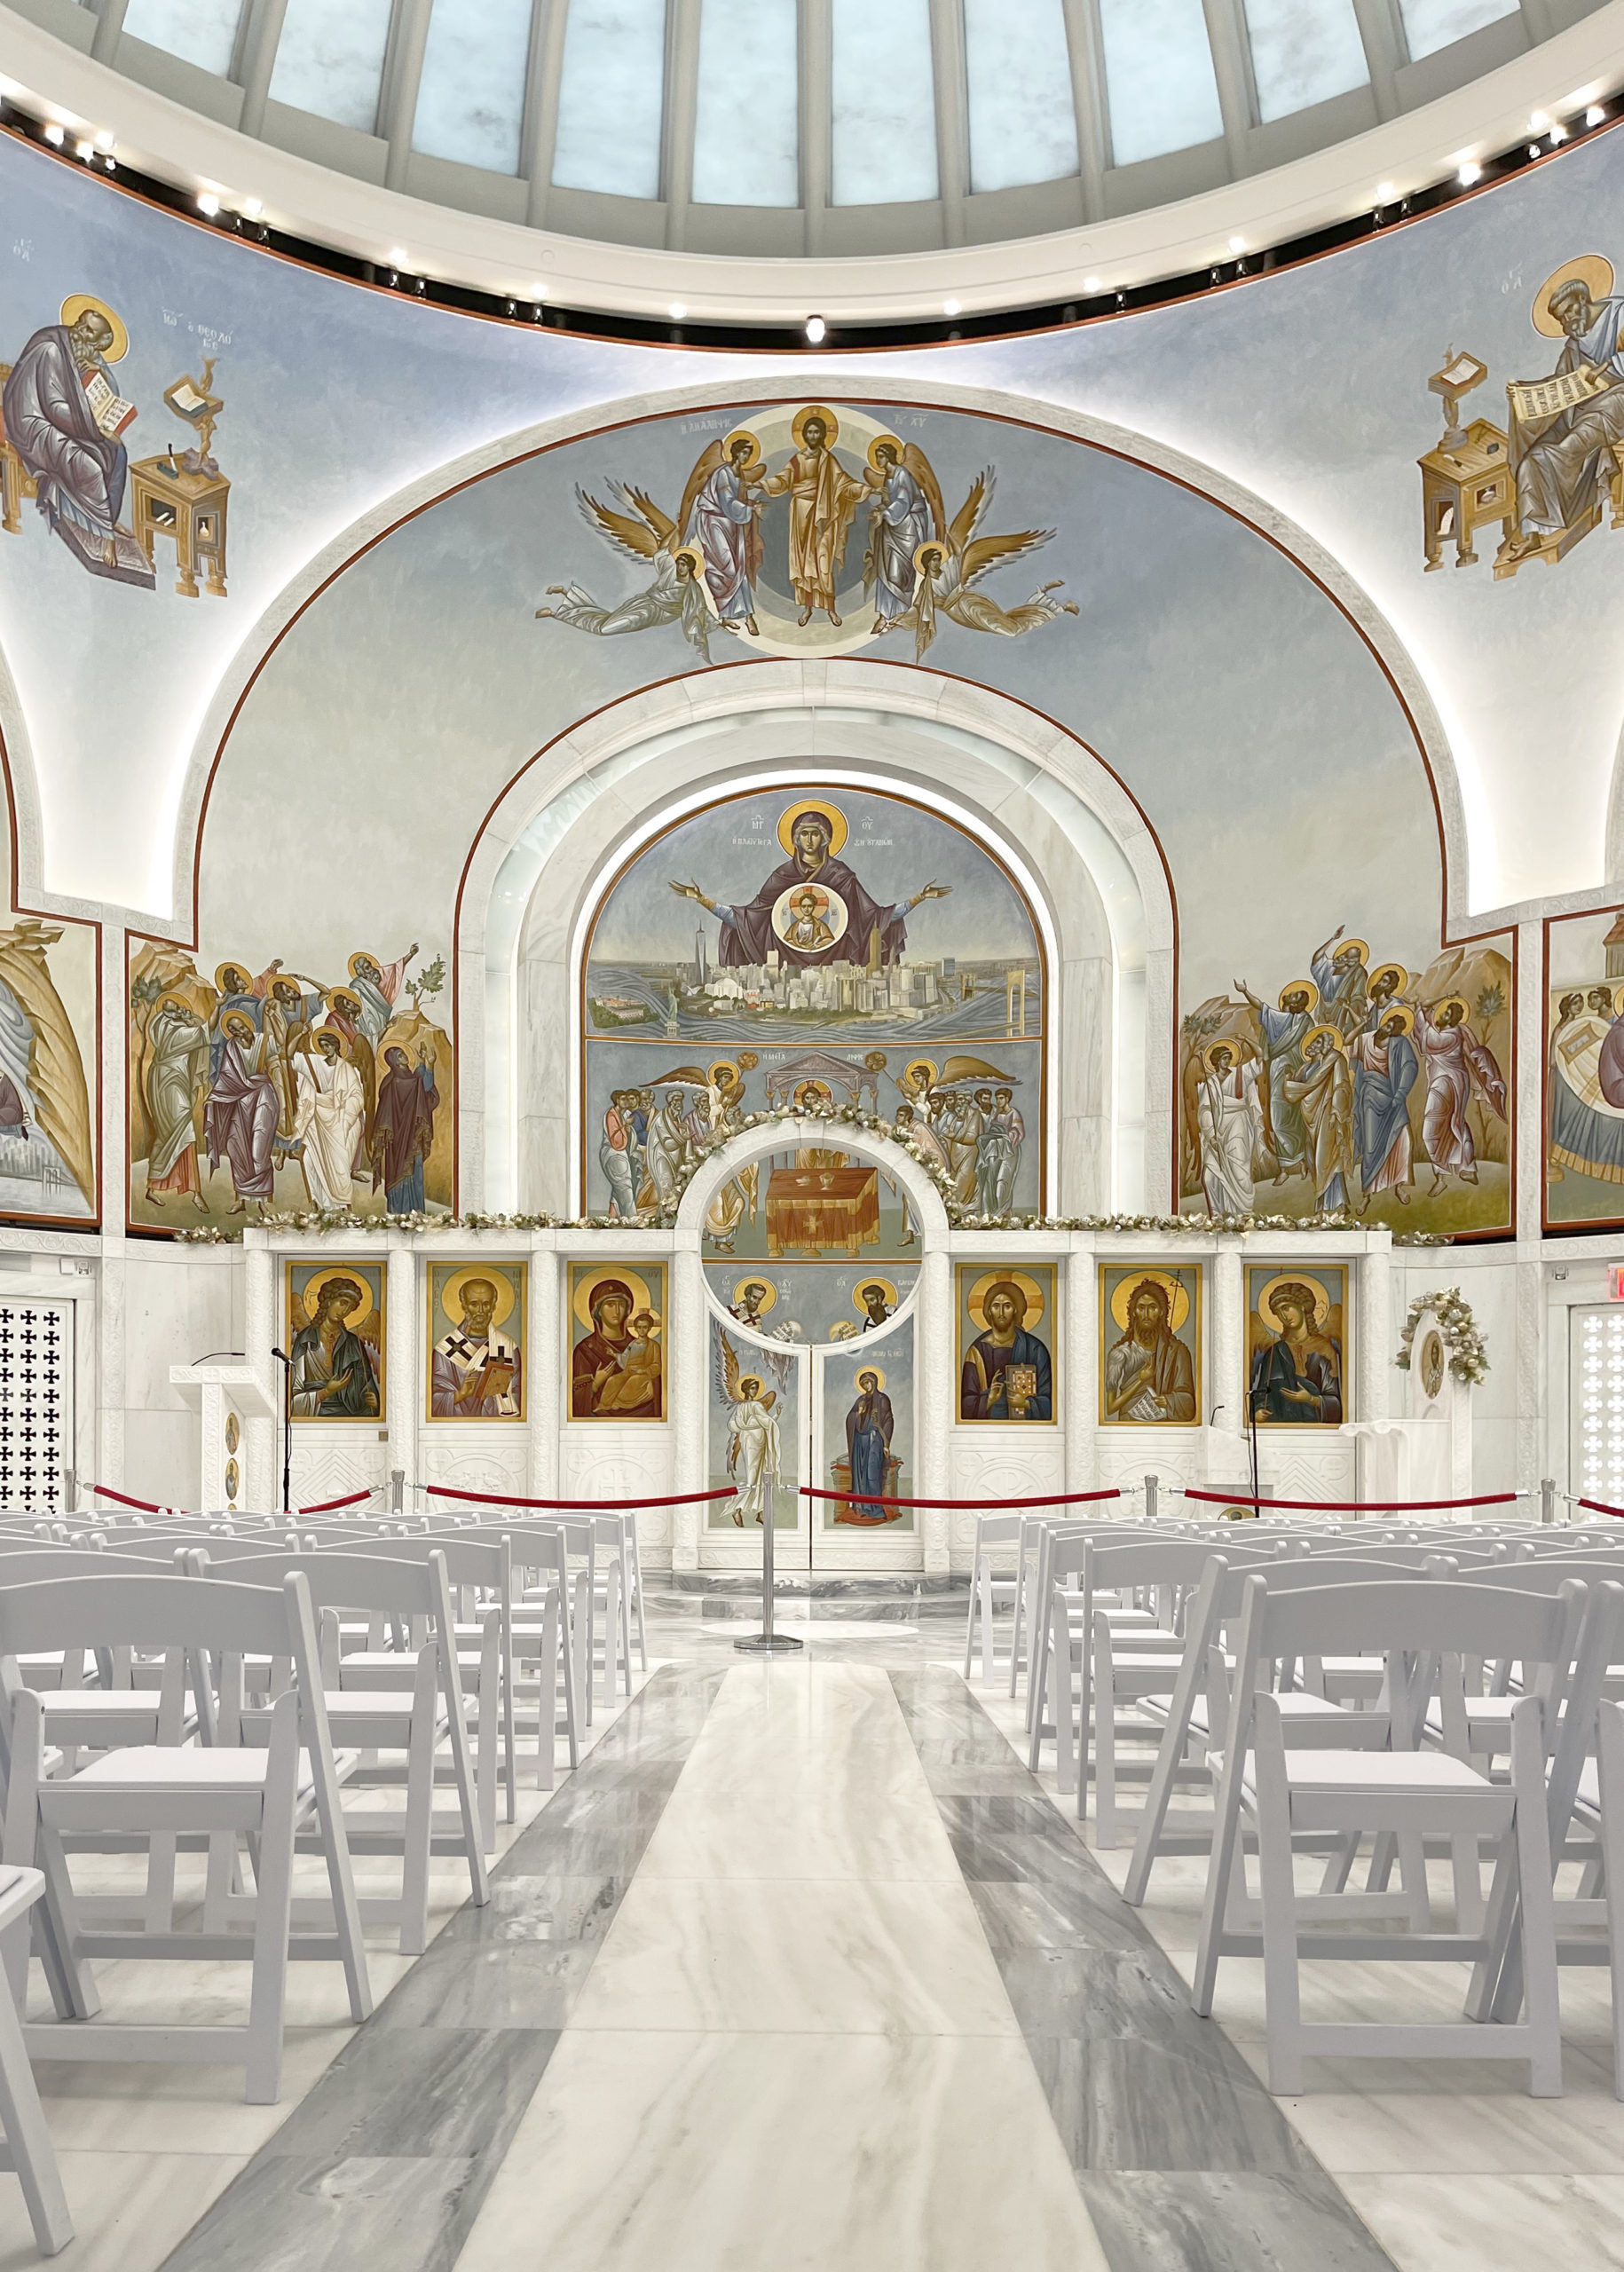
Photo by Michael Young

Photo by Michael Young
Photo by Michael Young
Photo by Michael Young
Subscribe to YIMBY’s daily e-mail
Follow YIMBYgram for real-time photo updates
Like YIMBY on Facebook
Follow YIMBY’s Twitter for the latest in YIMBYnews
your illustrated info-mails are absolutely wonderful. I read and follow everything closely. inspired me to vacation in NYC again in May!
Beautiful photographs of our flourishing Twenty First Century city.
Awesome photography!
Yep, great photos.