
As New York City simmers in some of the year’s hottest weeks, the city’s construction and real estate markets remain equally hot. The second quarter of the year, which spans the period from April through June, registered a total of 1,077 new building permits filed with the city’s Department of Buildings. As such, Q2 2024 counts the second-highest number of new permit filings since YIMBY began its tally at the start of the decade and continues the strong trend established in the two preceding quarters, which now count the first- and third-highest permit filing totals. The 14,795 filed-for residential and hotel units also make for one of the highest quarterly counts of the decade, as do the 21.5 million filed-for square feet of new building floor area. YIMBY has meticulously vetted each of the thousand-plus new building permits submitted to the city in the second quarter and compiled a series of charts and analyses that look at emergent overarching trends.
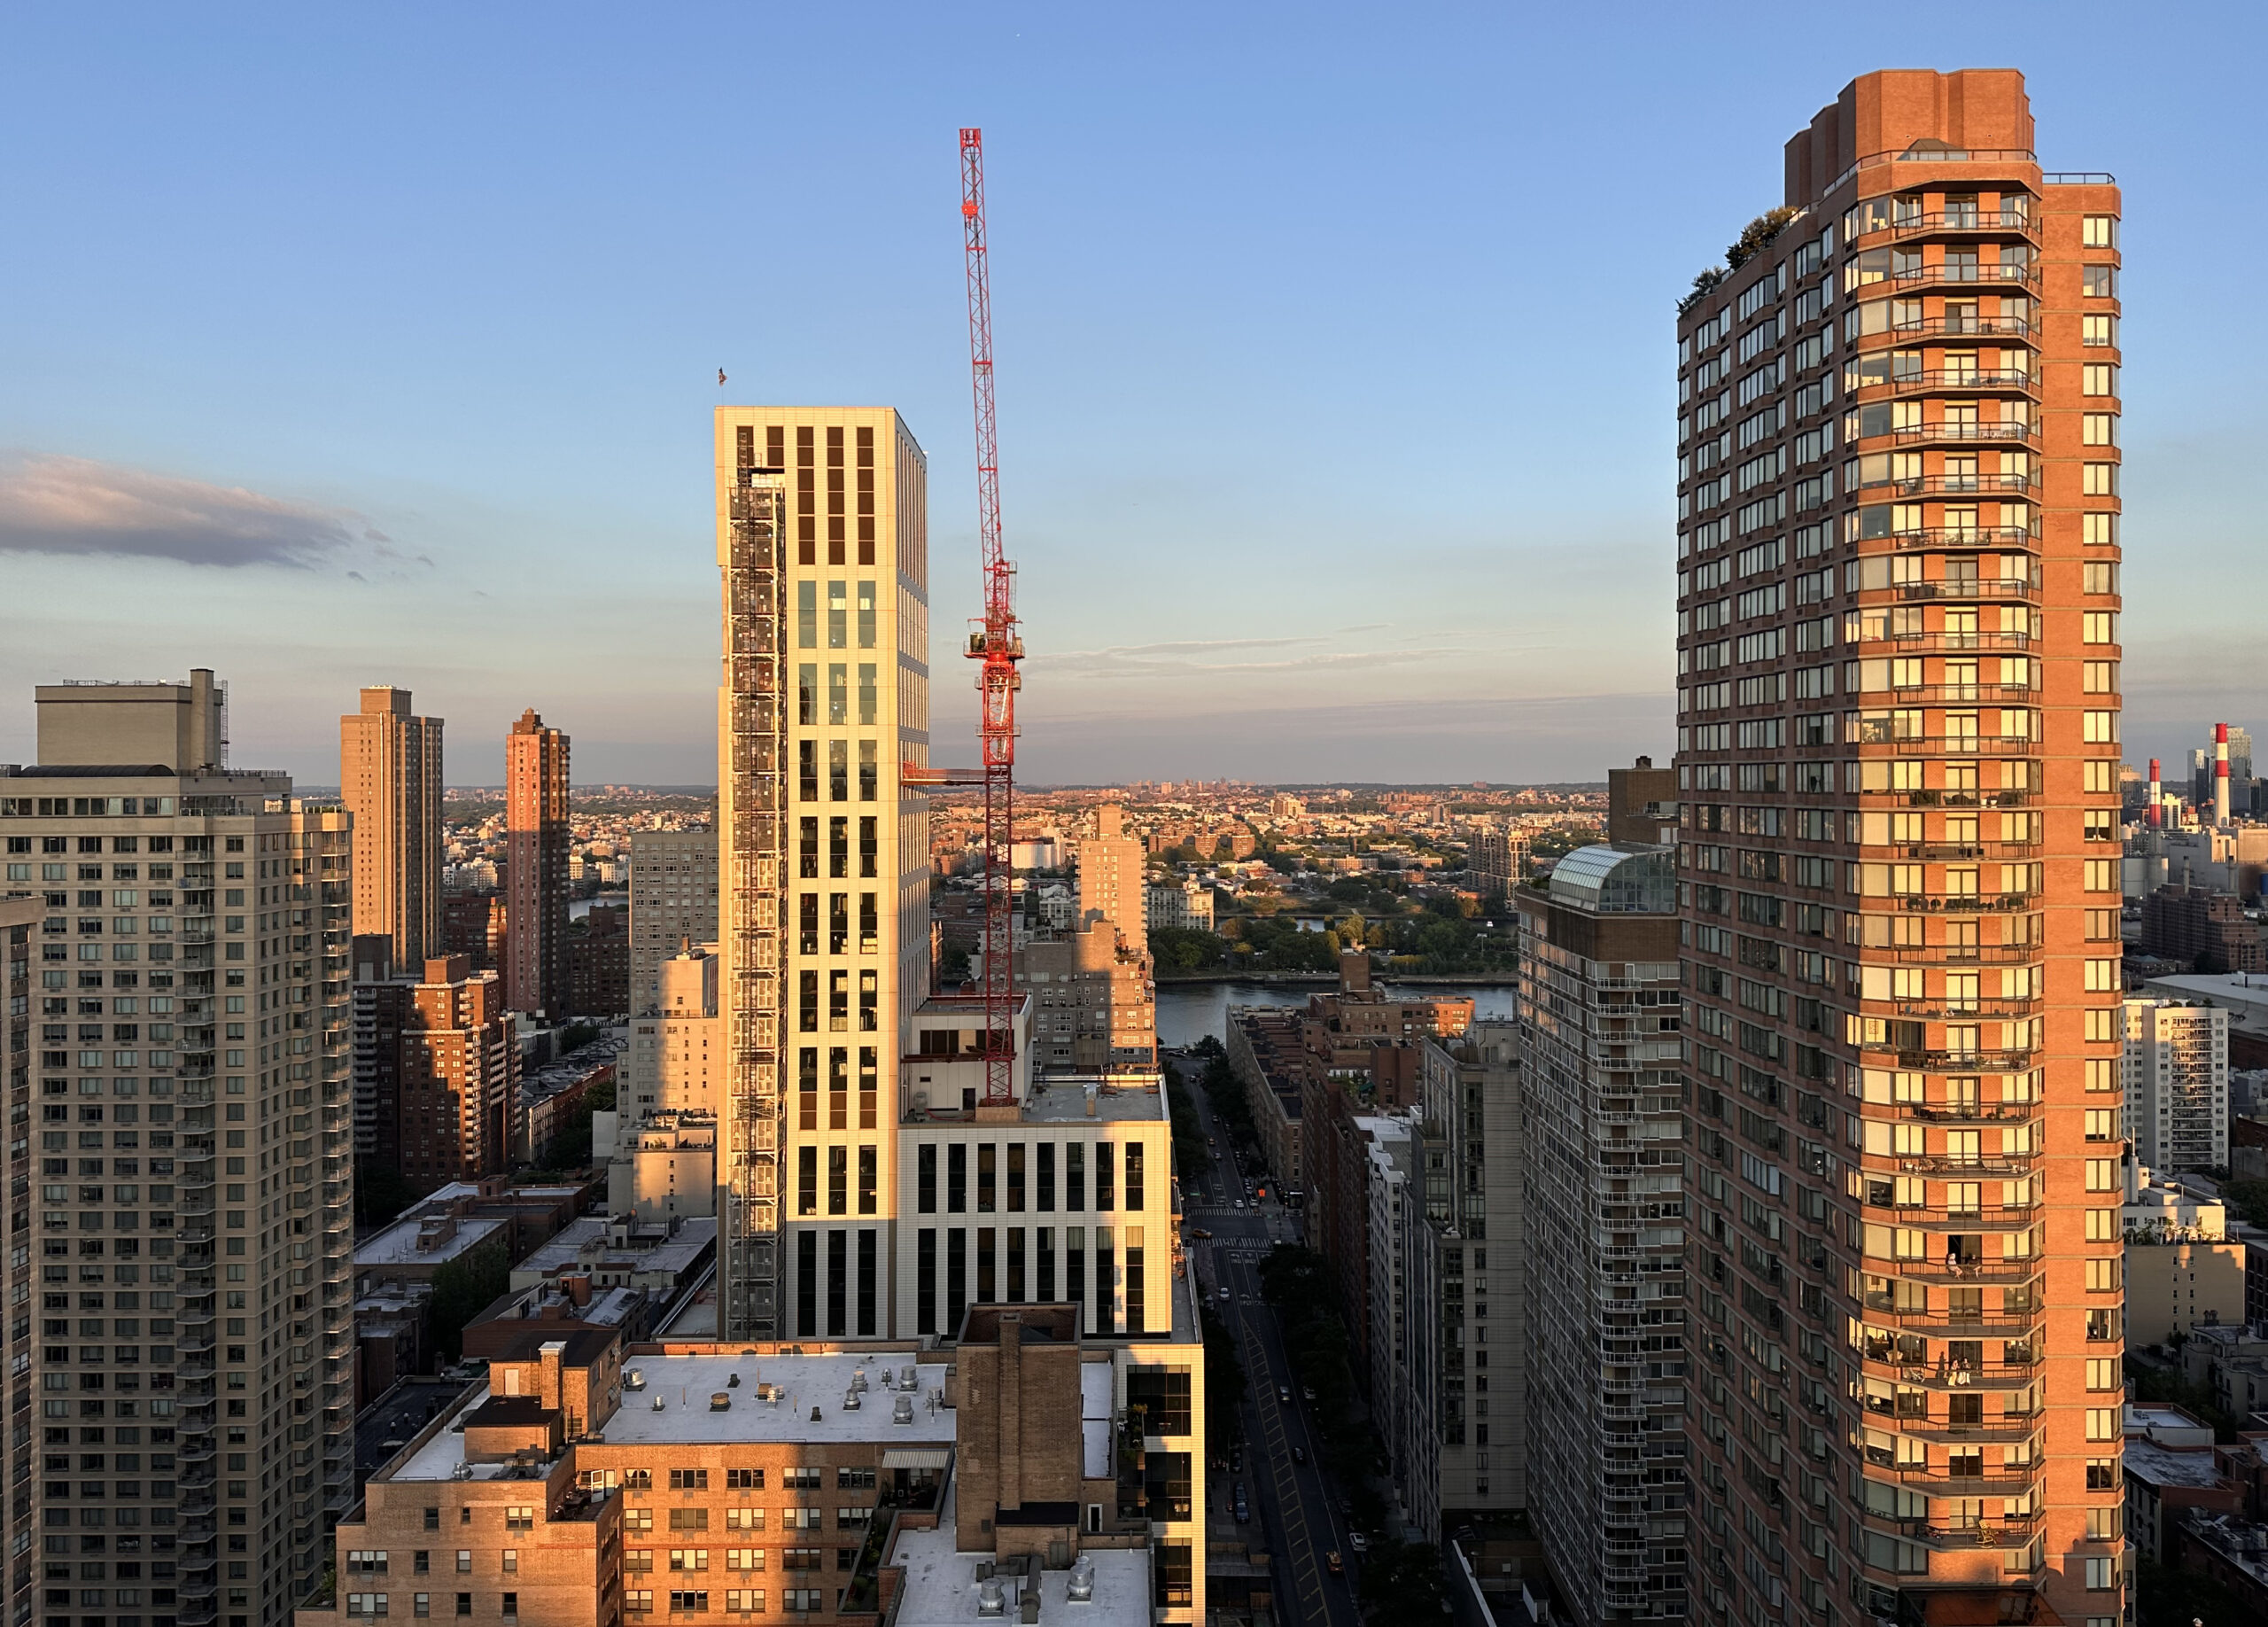
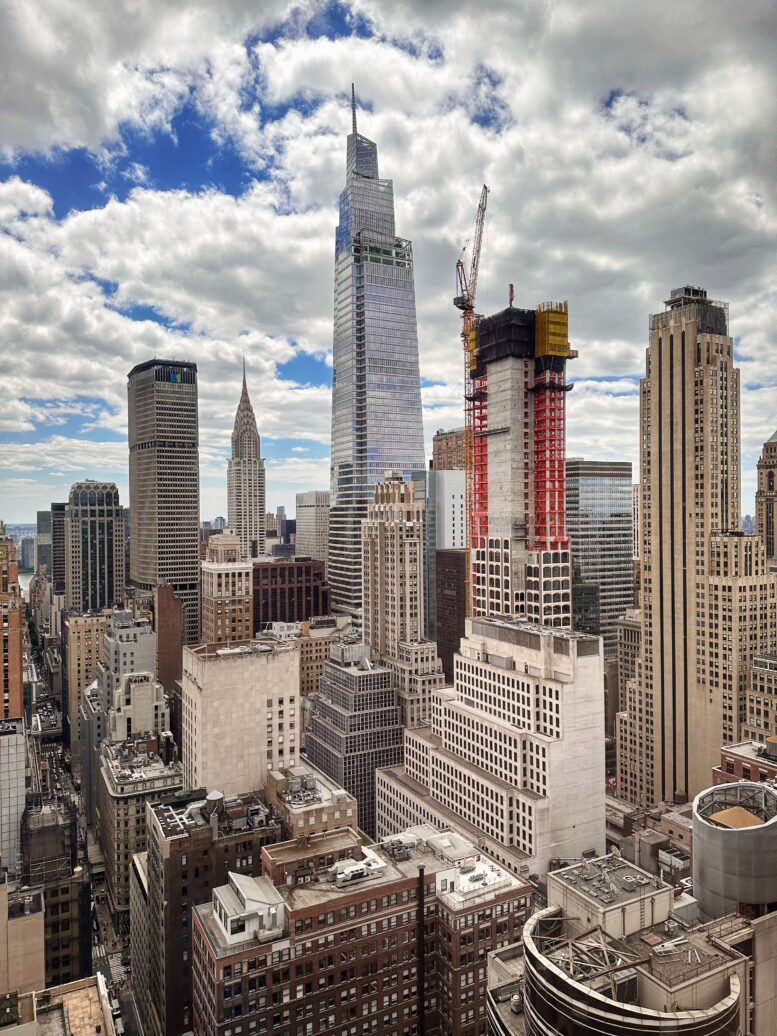
Photo by Michael Young
Number of permit filings per month
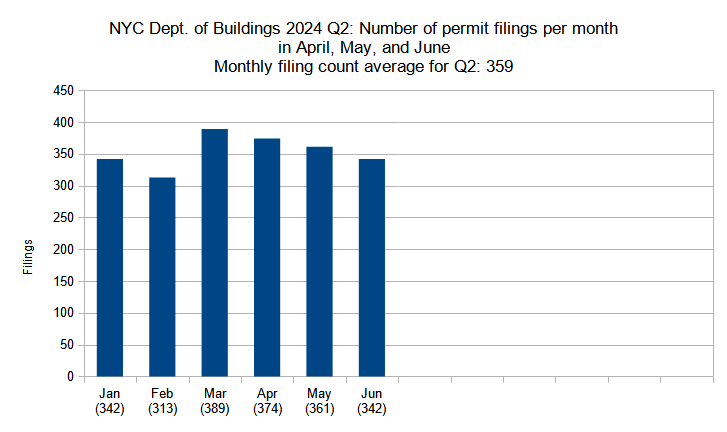
Number of new construction permits filed per month in New York City in Q1 and Q2 (January through June) 2024. Data source: the Department of Buildings. Data aggregation and graphics credit: Vitali Ogorodnikov
The second quarter of 2024 saw an average of 359 permits filed per month in the period spanning from April through June. These numbers reflect a sustained pace of strong permit filing counts that we have observed over the past year or so. As it stands, Q2 2024 currently registers the second-highest monthly permit count average since YIMBY began tracking the statistic at the start of this decade, trailing behind the two immediately preceding quarters (Q4 2023 with an average of 507 permits and Q1 2024 with an average of 345 permit filings).
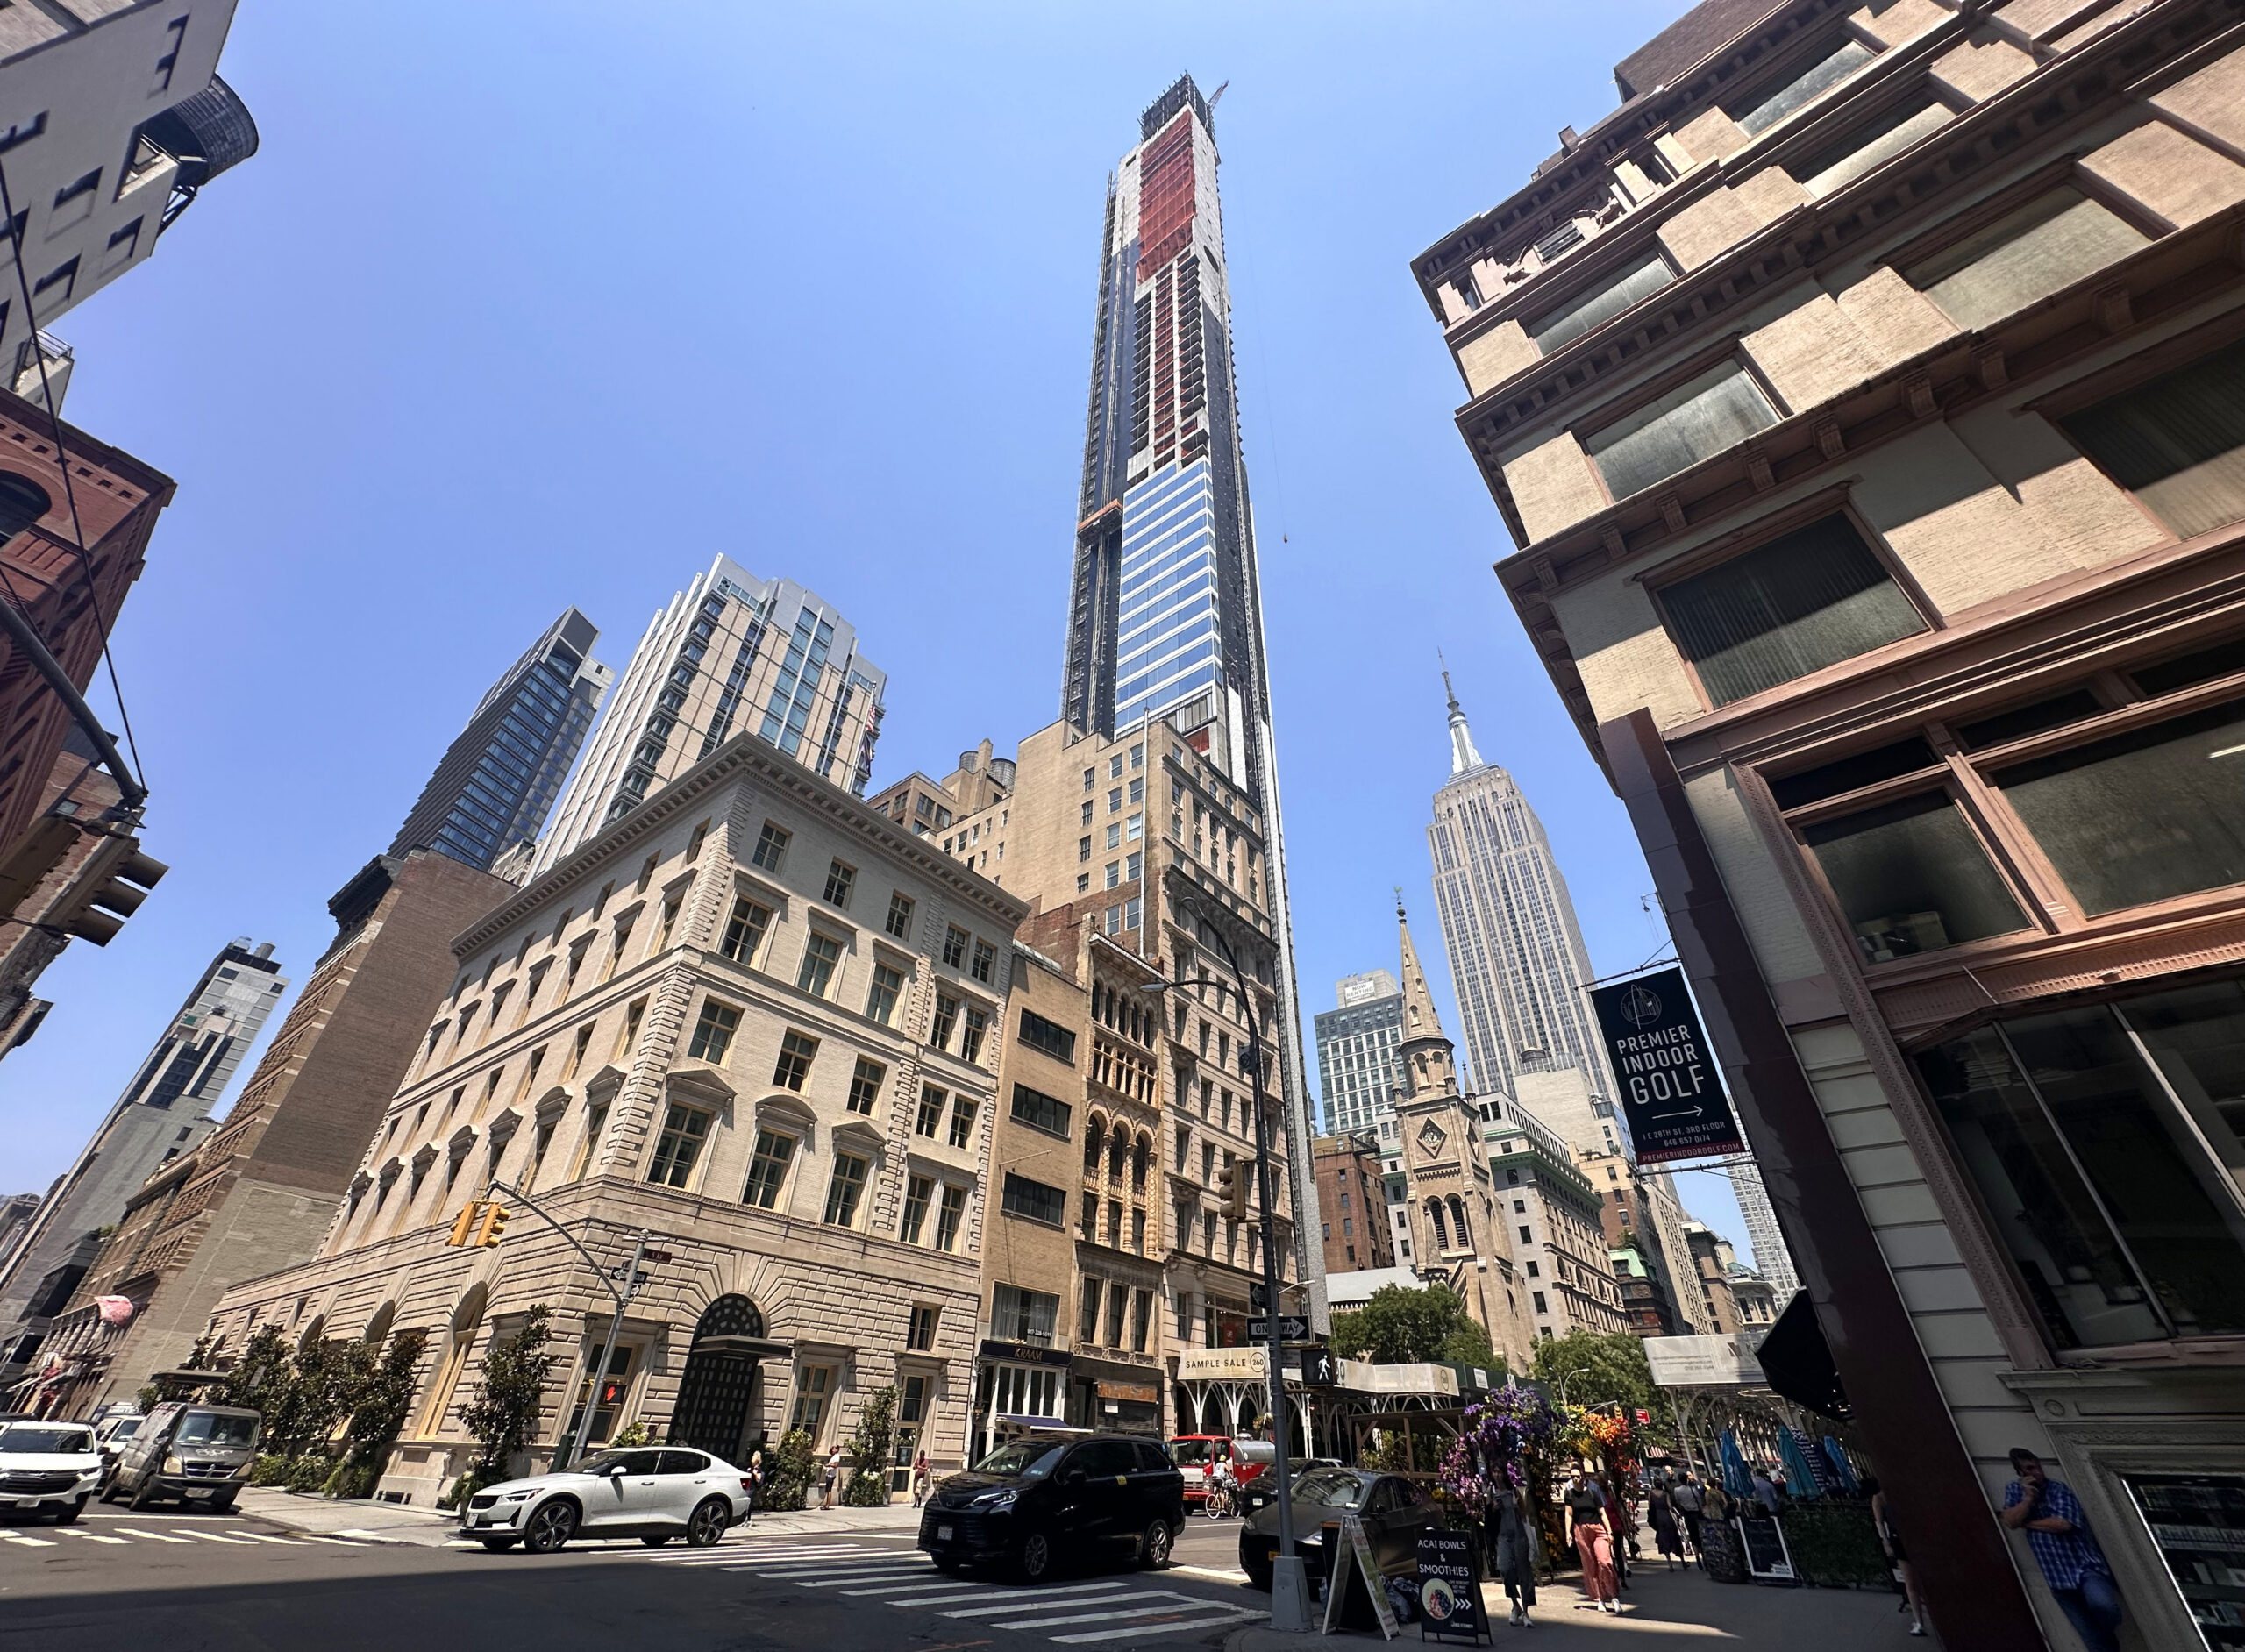
Photo by Michael Young
Number of permit filings by borough
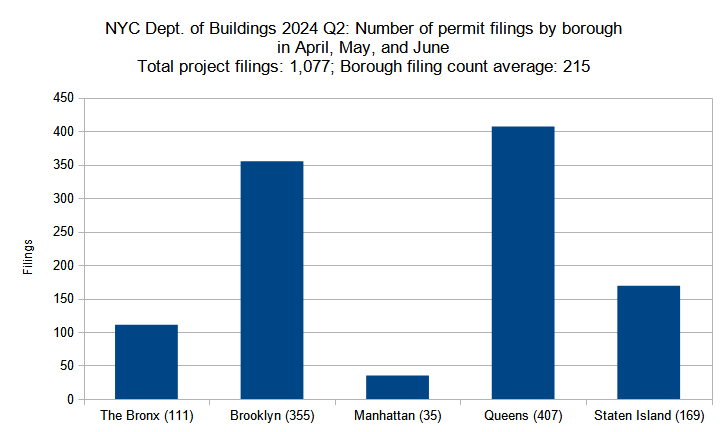
Number of new construction permits filed per borough in New York City in Q2 (April through June) 2024. Data source: the Department of Buildings. Data aggregation and graphics credit: Vitali Ogorodnikov
As the overall permit filing numbers have remained generally consistent with the previous quarter, so have their totals per each individual borough. The overall trend has remained the same, where Brooklyn and Queens together account for more than two-thirds of the city’s total filed-for permits for the quarter.
Below is the breakdown of borough statistic changes between the year’s second and third quarters:
- The Bronx – 4-percent decrease (116 to 111 permits)
- Brooklyn – 3-percent increase (345 to 355)
- Manhattan – 15-percent decrease (41 to 35)
- Queens – 3-percent increase (395 to 407)
- Staten Island – 15-percent increase (147 to 169)
Since the previous quarter, The Bronx, Brooklyn, and Queens notched minor variations in permit counts, within low single-digit percentage fluctuations. The greatest gain was observed in Staten Island, which registered a 15-percent increase in permit counts between Q1 and Q2, while Manhattan noted a 15-percent decrease during the period.
Photo by Michael Young
Permits listed by unit count per filing
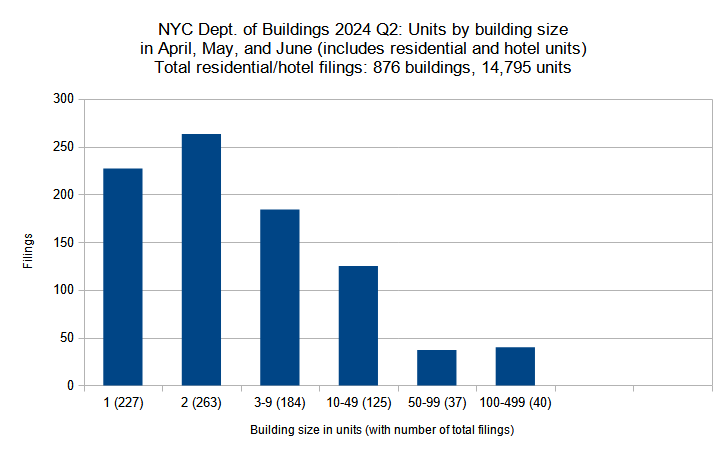
New residential and hotel construction permits filed in New York City in Q2 (April through June) 2024 grouped by unit count per filling. Data source: the Department of Buildings. Data aggregation and graphics credit: Vitali Ogorodnikov
Though the city’s mighty skyline is defined by verticality, low-rise buildings predominate in New York, as they do in just about every other US city. Just as we saw in the preceding quarters, filings for smaller residential buildings, particularly those of the single- and two-family variety, far outnumber their larger counterparts in terms of the number of permit filings. However, as expected, the largest proposed buildings still contain the bulk of proposed new apartments: although the 40 filings in the largest category (buildings with 10 to 500 apartments) comprise less than 5 percent of the 876 total residential and hotel filings, they hold slightly more than half of the 14,795 units filed for during the second quarter.
Below, the filing size categories are compared between the two quarters individually:
- Single-family – 36-percent increase (167 to 227 units)
- Two-family – 17-percent increase (224 to 263)
- Three to nine units – 4-percent increase (177 to 184)
- Ten to 49 units – 17-percent decrease (150 to 125)
- 50 to 99 units – no change (37 in Q1 and Q2 each)
- 100 to 499 units – 11-percent decrease (45 to 40)
Although the largest building category accounts for more than half of all filed-for units in Q2, the overall share of large residential and hotel filings dropped slightly since the preceding quarter. Between Q1 and Q2 of 2024, the three categories of permits with under ten unit filings all saw increases; on the other hand, each of the larger categories either saw no change or a decrease in permit filing counts. In contrast to the four buildings with 500 or more units registered in Q1, no such filings were noted in Q2.
Photo by Michael Young
Residential and hotel units filed per borough
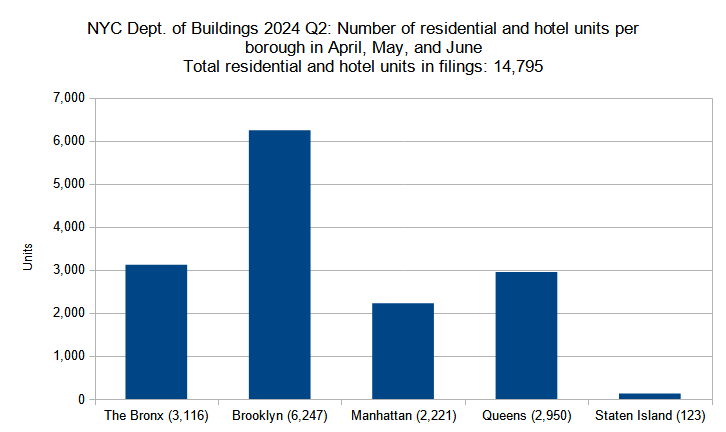
Number of residential and hotel units in new construction permits filed per borough in New York City in Q2 (April through June) 2024. Data source: the Department of Buildings. Data aggregation and graphics credit: Vitali Ogorodnikov
The 14,795 residential and hotel units filed for in the second quarter of 2024 fall short of the 19,819 units filed-for in the preceding quarter, but the Q2 number still registers one of the highest quarterly tallies on YIMBY’s records for the decade. Receding from the record-setting surge in the previous quarter, Q2 notes comparative decreases in total unit filings in four out of five boroughs.
Below is a by-borough comparison between the two quarters:
- The Bronx – 32-percent decrease (4,552 to 3,116 residential and hotel units)
- Brooklyn – 12-percent decrease (7,074 to 6,247)
- Manhattan – 3-percent increase (2,166 to 2,221)
- Queens – 49-percent decrease (5,748 to 2,950)
- Staten Island – 56-percent decrease (279 to 123)
Aside from Manhattan, which registered a modest, three-percent increase between Q1 and Q2, every other borough saw double-digit percentage drops. The steepest decline took place in Queens, which dropped by 49 percent from 5,748 to 2,950 filed-for units between the two quarters, slipping from second to third place among the boroughs. This drop is rather surprising, as Queens is both the city’s largest and one of its less densely developed boroughs, meaning that it has ample real estate for new, high-density construction, though an increase in city and state investment in the borough’s relatively sparse subway and regional rail systems is definitely much needed.
Photo by Michael Young
Permits listed by average unit count per filing
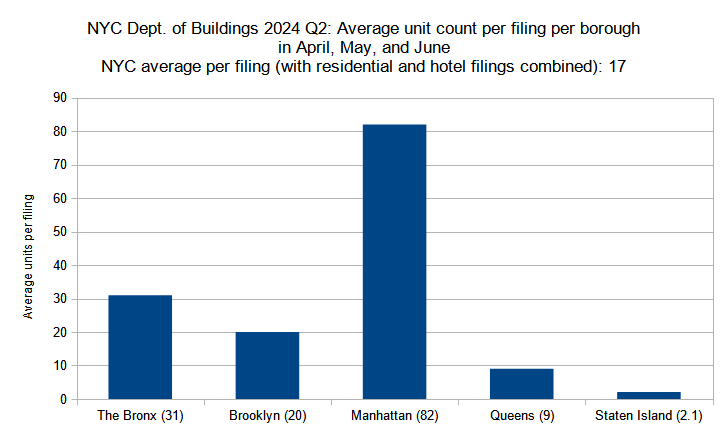
Average unit count (residential and hotel) per new construction permit per borough filed in New York City in Q2 (April through June) 2024. Data source: the Department of Buildings. Data aggregation and graphics credit: Vitali Ogorodnikov
Given the increase in the total count of permit filings for residential and hotel buildings between the first and second quarters of the year (from 804 in Q1 2024 to 876 in Q2) and the drop in total number of filed-for units by around one-quarter (from 19,819 units in Q1 down to 14,475 in Q2), the average unit count per filing shrunk both for the city as a whole (from 25 in Q1 to 17 in Q2) and for nearly every borough.
Below is a by-borough comparison between the two quarters:
- The Bronx – 30-percent decrease (44 to 31 residential and hotel units)
- Brooklyn – 17-percent decrease (24 to 20)
- Manhattan – 9-percent increase (75 to 82)
- Queens – 53-percent decrease (19 to 9)
- Staten Island – 36-percent decrease (3.3 to 2.1)
Reflecting the numbers seen in our analysis of residential and hotel units filed for per borough, Manhattan noted a slight increase in the average unit count per filing between the two quarters, while the rest of the boroughs saw double-digit percentage decreases, with the greatest downsizing observed in Queens. However, despite the decreases, the averages are still comparable to those of other quarterly numbers observed so far over the course of this decade.
Photo by Michael Young
Permit filings by floor count category
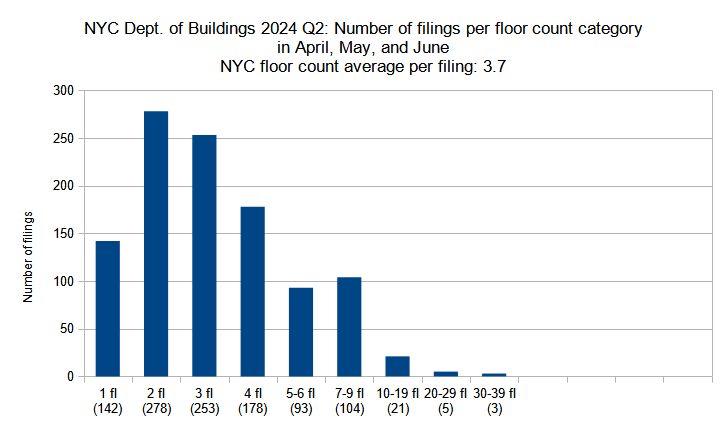
New construction permits filed in New York City in Q2 (April through June) 2024 grouped by floor count. Data source: the Department of Buildings. Data aggregation and graphics credit: Vitali Ogorodnikov
Since the majority of new proposed buildings are residential (more than four-fifths of the total permits for Q2), a general decrease in overall floor counts per filing was to be expected given the drop in filed-for unit counts, with the city’s average slipping from 4.1 average floors per filing in Q1 to 3.7 in Q2.
Below is a comparison per floor-count category between the two quarters:
- Single-story – 20-percent decrease (177 to 142 permits)
- Two-story – 22-percent increase (228 to 278)
- Three-story – 12-percent increase (225 to 253)
- Four-story – 8-percent increase (165 to 178)
- Five to six floors – 4-percent decrease (97 to 93)
- Seven to nine floors- 9-percent increase (95 to 104)
- Ten to 19 floors – 49-percent decrease (41 to 21)
- 20 to 29 floors – 50-percent decrease (10 to 5)
- 30 to 39 floors – 50-percent increase (2 to 3)
In the second quarter, three out of four categories for buildings counting four stories or fewer saw increases in total permit filings. In contrast, three of the five larger floor-count categories saw decreases. During the period, no filings have exceeded a count of 33 stories, while the preceding quarter registered three filings in the 40-49-floor category and one in the 50-59-story group.
Below are the permit filings with the top ten highest floor counts, in order:
- 1 (tie): 255 East 77th Street on the Upper East Side of Manhattan (33 floors)
- 1 (tie): 170 West 48th Street in Midtown Manhattan (33 floors)
- 3: 1026 Third Avenue on the Upper East Side of Manhattan (31 floors)
- 4: 1440 Amsterdam Avenue in Manhattanville, Manhattan (28 floors)
- 5: 19 Rockwell Place in Downtown Brooklyn (27 floors)
- 6 (tie): 275 Atlantic Avenue in Downtown Brooklyn (22 floors)
- 6 (tie): 470 Kent Avenue in Downtown Brooklyn (22 floors)
- 8: 99 Fleet Place in Downtown Brooklyn (21 floors)
- 9 (tie): 205 East 110th Street in East Harlem, Manhattan (18 floors)
- 9 (tie): 1042 Atlantic Avenue in Prospect Heights, Brooklyn (18 floors)
- 9 (tie): 34 East 35th Street in Murray Hill, Manhattan (18 floors)
Manhattan and Brooklyn contain all of the top ten permits with the highest floor counts, with six filled-for buildings in the former and five in the latter (for a total of 11 entries, considering floor-count ties). This stands in contrast with the previous quarter, where three of the top ten entrants were located in Queens.
Photo by Michael Young
Average number of floors per filing per borough
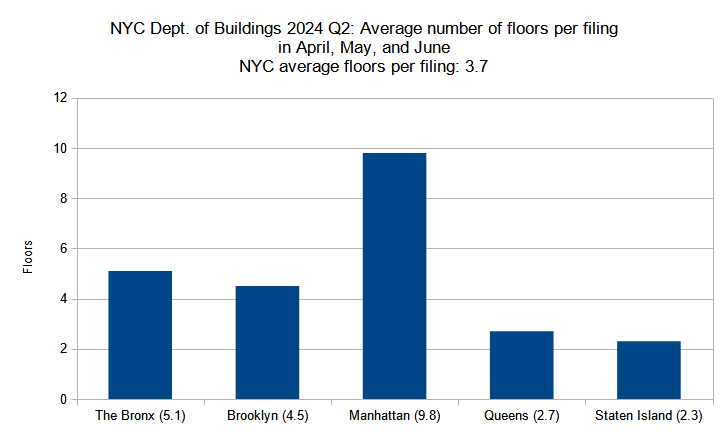
Average number of floors per new construction permit per borough filed in New York City in Q2 (April through June) 2023. Data source: the Department of Buildings. Data aggregation and graphics credit: Vitali Ogorodnikov
Below is the by-borough comparison of average floor count per filing between the two quarters:
- The Bronx – 6-percent decrease (5.4 to 5.1 floors)
- Brooklyn – 8-percent decrease (4.9 to 4.5)
- Manhattan – 6-percent decrease (10.4 to 9.8)
- Queens – 13-percent decrease (3.1 to 2.7)
- Staten Island – 15-percent increase (2.0 to 2.3)
The overall inter-borough dynamic is the same as it was before, with Manhattan boasting the highest average by far, trailed by in order The Bronx, Brooklyn, Queens, and Staten Island. Four of the boroughs noted modest decreases, ranging between 6 and 13 percent. Only Staten Island noted an increase, rising 15 percent between the two quarters, though the bump still accounts for a rather minimal increase of just 0.3 stories per average filing.
The following are the permit filings in each borough with the highest floor counts:
- The Bronx – 1225 Gerard Avenue in Concourse (17 floors)
- Brooklyn – 19 Rockwell Place in Downtown Brooklyn (27 floors)
- Manhattan (tie) – 255 East 77th Street on the Upper East Side (33 floors)
- Manhattan (tie) – 170 West 48th Street in Midtown (33 floors)
- Queens – 133-25 37th Avenue in Flushing (16 floors)
- Staten Island (tie) – 5 Stuyvesant Place in St. George (7 floors)
- Staten Island (tie) – 400 Lake Avenue in Mariners Harbor (7 floors)
In the second quarter of the year, only Manhattan and Brooklyn registered new building filings with 20 stories or more, though we expect activity to pick back up in rapidly developing high-rise cores of Queens and The Bronx in the near future.
Photo by Michael Young
Permits listed by floor area per filing
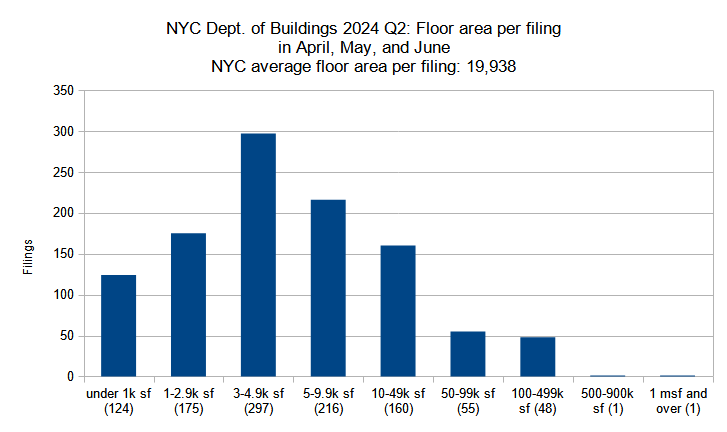
New construction permits filed in New York City in Q2 (April through June) 2024 grouped by total floor area. Data source: the Department of Buildings. Data aggregation and graphics credit: Vitali Ogorodnikov
The 21.5 million square feet of new floor space filed for in the second quarter of the year makes for one of the higher quarterly tallies for New York City during the decade so far, and on its own would be sufficient to compere with central business districts of many mid-size cities throughout the nation. However, the drop from the astounding 26 million square feet filed for in the previous quarter translates into drops of filed-floor footage in several building size categories, particularly among those with the largest floor area.
Below is a breakdown by floor area category:
- Under 1,000 square feet – 17-percent decrease (149 to 124 permits)
- 1,000 to 2,999 sf – 23-percent increase (142 to 175)
- 3,000 to 4,999 sf – 13-percent increase (264 to 297)
- 5,000 to 9,999 sf – 5-percent increase (205 to 216)
- 10,000 to 49,999 sf – 5-percent decrease (169 to 160)
- 50,000 to 99,999 sf – 4-percent increase (53 to 55)
- 100,000 to 499,999 sf – 19-percent decrease (59 to 48)
- 500,000 to 999,999 sf – 67-percent decrease (3 to 1)
- 1,000,000 and over – n/a (none in Q1 and 1 in Q2)
In the second quarter, three out of four of the smaller-area categories (under 10,000 square feet per filing) observed increases in filing counts. However, a reverse trend is observed in the four larger categories, which tally filings spanning 10,000 to just under 1 million square feet, where three of the four groups display lower filing totals. However, the second quarter of the year did register one filing spanning over 1 million square feet, while none such filings were submitted in Q1.
Below are the top five, in order:
- 275 Atlantic Avenue in Downtown Brooklyn (1,008,700 square feet)
- 126-87 Willets Point Boulevard in Willets Point, Queens (615,000 square feet)
- 1440 Amsterdam Avenue in Manhattanville, Manhattan (469,752 square feet)
- 33-35 11th Street in Astoria, Queens (383,477 square feet)
- 548 Utica Avenue in Prospect Lefferts Gardens, Brooklyn (365,000 square feet)
The top five largest floor area filings for the quarter illustrate a sustained trend of dense development outside of the city’s traditional central business districts, with each located either in Brooklyn or Queens (just one in Downtown Brooklyn and none in Long Island City) or in Upper Manhattan.
Photo by Michael Young
Total floor area filed by borough
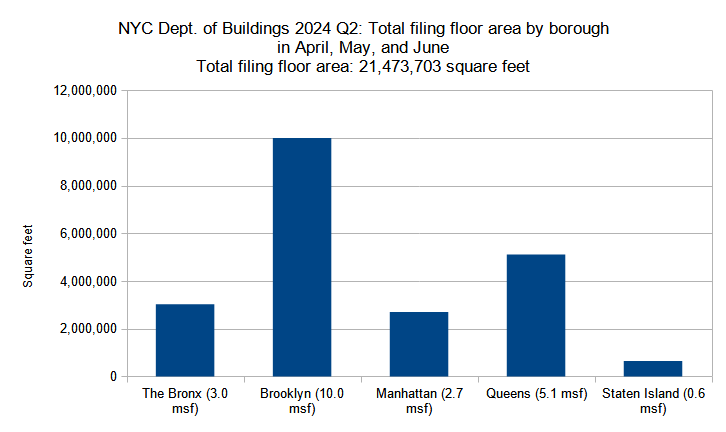
Combined floor area of new construction permits filed per borough in New York City in Q2 (April through June) 2024. Data source: the Department of Buildings. Data aggregation and graphics credit: Vitali Ogorodnikov
Between the first and second quarters of 2024, the size of the average new building permit filing in New York City shrunk by roughly one-fifth, from an average of 24,938 square feet per filing in Q1 down to 19,938 square feet in Q2. However, the decrease may be seen as a minor correction in an overall growing trend of filed-for floor space, as it still significantly exceeds the Q4 2023 average of 15,206 square feet.
Below are the square footage totals per borough compared between the two quarters:
- The Bronx – 29-percent decrease (4.3 to 3.0 million square feet)
- Brooklyn – 1-percent decrease (10.1 to 10.0 msf)
- Manhattan – 20-percent decrease (3.4 to 2.7 msf)
- Queens – 33-percent decrease (7.6 to 5.1 msf)
- Staten Island – 4-percent decrease (0.7 to 0.6 msf)
Between the first and second quarters of the year, each of the boroughs registered a decrease in the total filed-for square footage, ranging from a negligible 1-percent drop in Manhattan to a 2.5-million-square-foot, 33-percent downsizing in Queens. However, the overall trend line remains the same, with Brooklyn tallying by far the greatest square footage, followed by Queens, The Bronx, Manhattan, and Staten Island.
The following are the permit filings in each borough with the largest floor area:
- The Bronx – 1225 Gerard Avenue in Concourse (356,813 square feet)
- Brooklyn – 275 Atlantic Avenue in Downtown Brooklyn (1,008,700 square feet)
- Manhattan – 1440 Amsterdam Avenue in Manhattanville (469,752 square feet)
- Queens – 126-87 Willets Point Boulevard in Willets Point (615,000 square feet)
- Staten Island – 5 Stuyvesant Place in St. George (71,729 square feet)
Photo by Michael Young
Average floor area per permit filing by borough
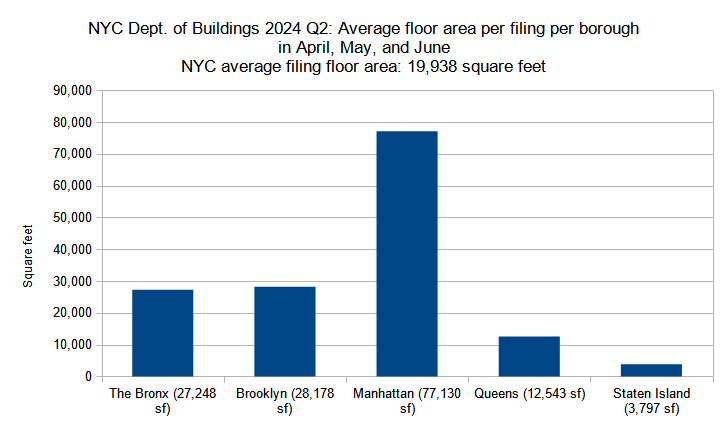
Average floor area per new construction permit per borough filed in New York City in Q2 (April through June) 2024. Data source: the Department of Buildings. Data aggregation and graphics credit: Vitali Ogorodnikov
Just as the total filed-for new building square footage lowered in every borough between the first and second quarters of the year, the size of the average filing has also decreased in a similar manner.
Below is the quarterly comparison for the boroughs:
- The Bronx – 26-percent decrease (36,962 to 27,248 square feet)
- Brooklyn – 4-percent decrease (29,258 to 28,178)
- Manhattan – 7-percent decrease (82,659 to 77,130)
- Queens – 35-percent decrease (19,232 to 12,543)
- Staten Island – 16-percent decrease (4,544 to 3,797)
The smallest average square footage decreases were noted in Brooklyn and Manhattan, both in single-digit percentages. And while Queens has the highest percentage drop of any of the boroughs, the decrease is arguably most noticeable in The Bronx, where the average permit filing lost more cumulative square footage and slipped to third place in size among the borough’s rankings.
Photo by Michael Young
New York City has reigned as arguably the world’s most significant metropolis when judged by a plethora of metrics for over a century. Even during this period of preeminence, the city has improved by leaps and bounds, clearing up its water and air from the productive yet polluted turn-of-the-century era and lifting up numerous communities and institutions from the crisis-jammed 1970s. However, much work remains to be done to ensure that the city continues to thrive in the future, particularly when it comes to addressing the city’s dire housing crisis.
While New York City is by far the most densely populated large city in the United States, vast swathes of it retain appallingly restrictive zoning regulations, which typically prevent construction of anything except single- and two-family houses or sprawling commercial or industrial facilities. By any objective urban planning metric, the city, even in its present state, is easily capable of accommodating significant volumes of new dense residential construction, particularly in low-density yet transit-rich areas, which would go a long way to alleviate our acute housing shortage.
Of course, continued investment must be made into the city’s infrastructure of every sort, whether of physical, social, environmental, or educational. Given the astronomical cost of building new physical infrastructure (such as new subway lines), the city ought to prioritize a path of lesser resistance by upgrading and optimally utilizing its ample existing resources.
For instance, improved public waterfront access in areas such as Upper Manhattan, northern Queens, and the south and western sections of The Bronx would go a long way toward improving the quality of life in numerous communities. Instead of constructing new regional rail lines (as welcome as such a prospect would be), the city could focus on adding new stations along existing lines, particularly on the Long Island Rail Road in eastern Brooklyn and western Queens, as is currently being done with the Metro-North in in the eastern portion of The Bronx. Design and construction could be accelerated for passenger rail projects along existing freight right-of-way tracks, such as for the Interborough Express (light rail between Brooklyn and Queens), the QueensLink (an abandoned rail line to be converted into subway in southern Queens), and the Lower Montauk Branch (a relaunch of passenger service along a former LIRR line in western Queens). The ferry system could be expanded into all corners of the city, turning its numerous waterways into a viable transit network.
The future looks bright for New York City in the years to come, yet the activation of our potential as a safe, welcoming, and thriving haven for future generations will come only through a sustained political, institutional, social, and infrastructural push that must come from every New Yorker.

Photo by Michael Young
Photo by Michael Young
Photo by Michael Young
Photo by Michael Young
Photo by Michael Young
Photo by Michael Young
Photo by Michael Young
Photo by Michael Young
Photo by Michael Young
Photo by Michael Young
Photo by Michael Young
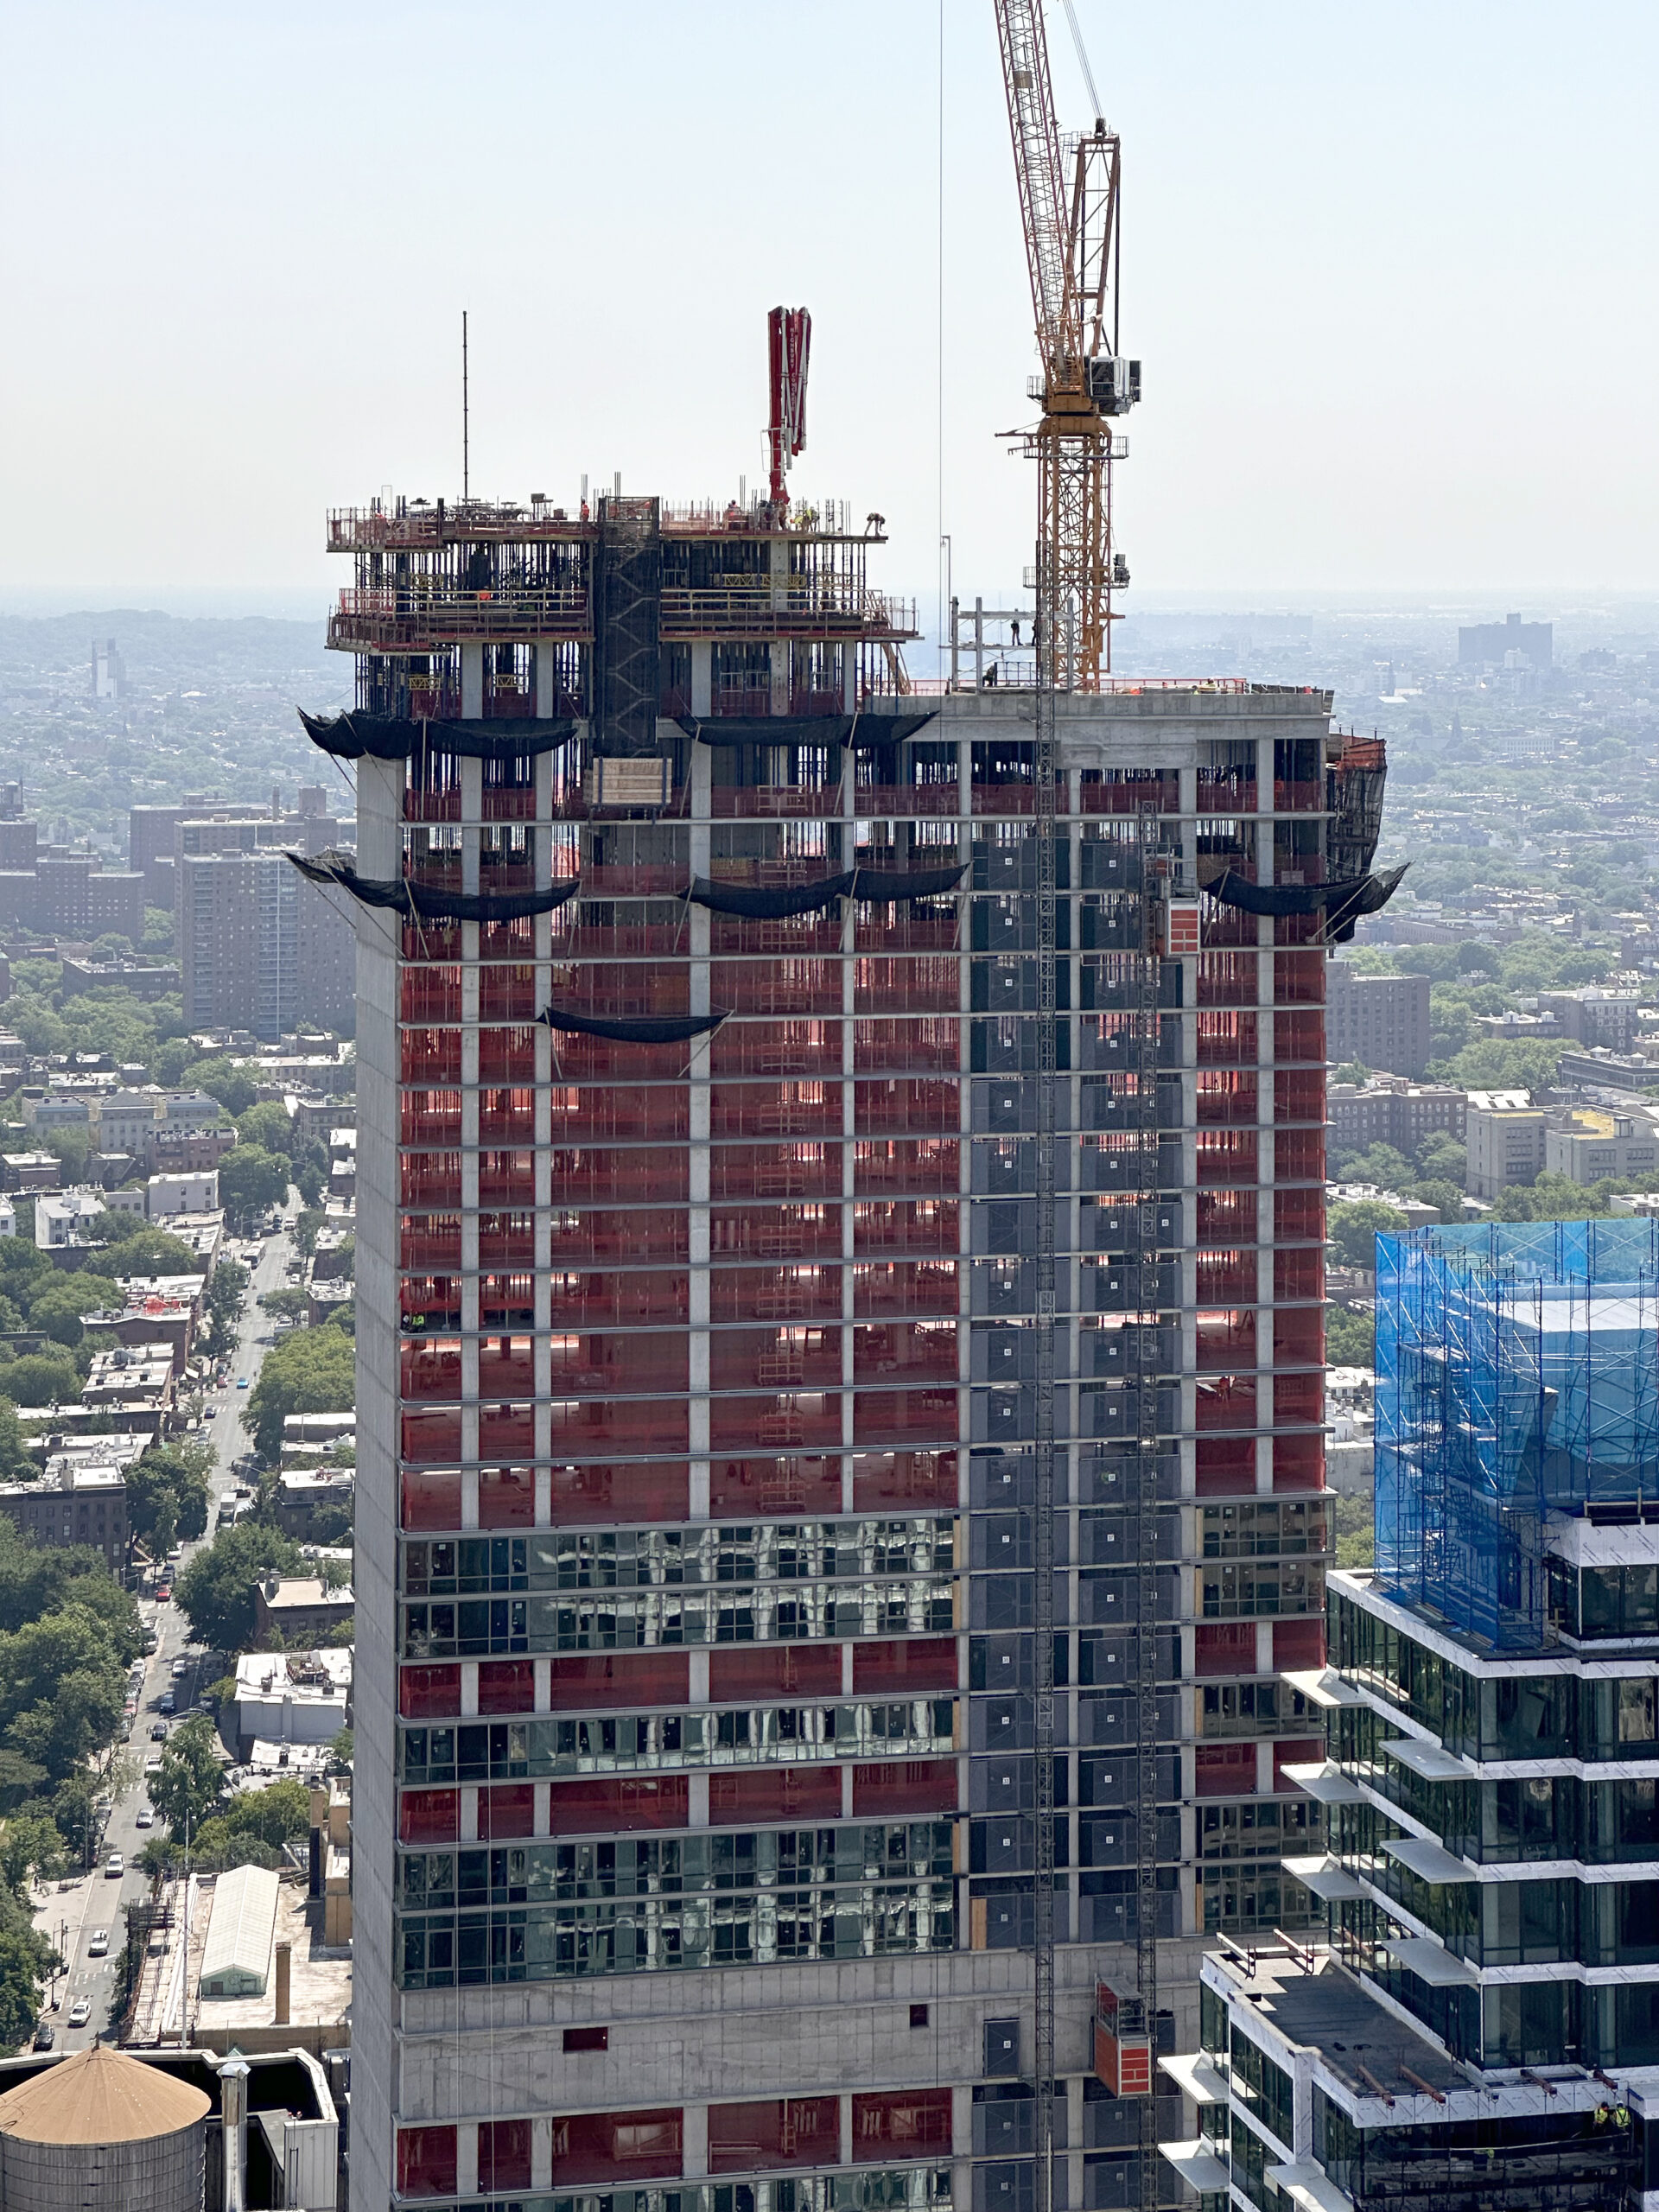
Photo by Michael Young
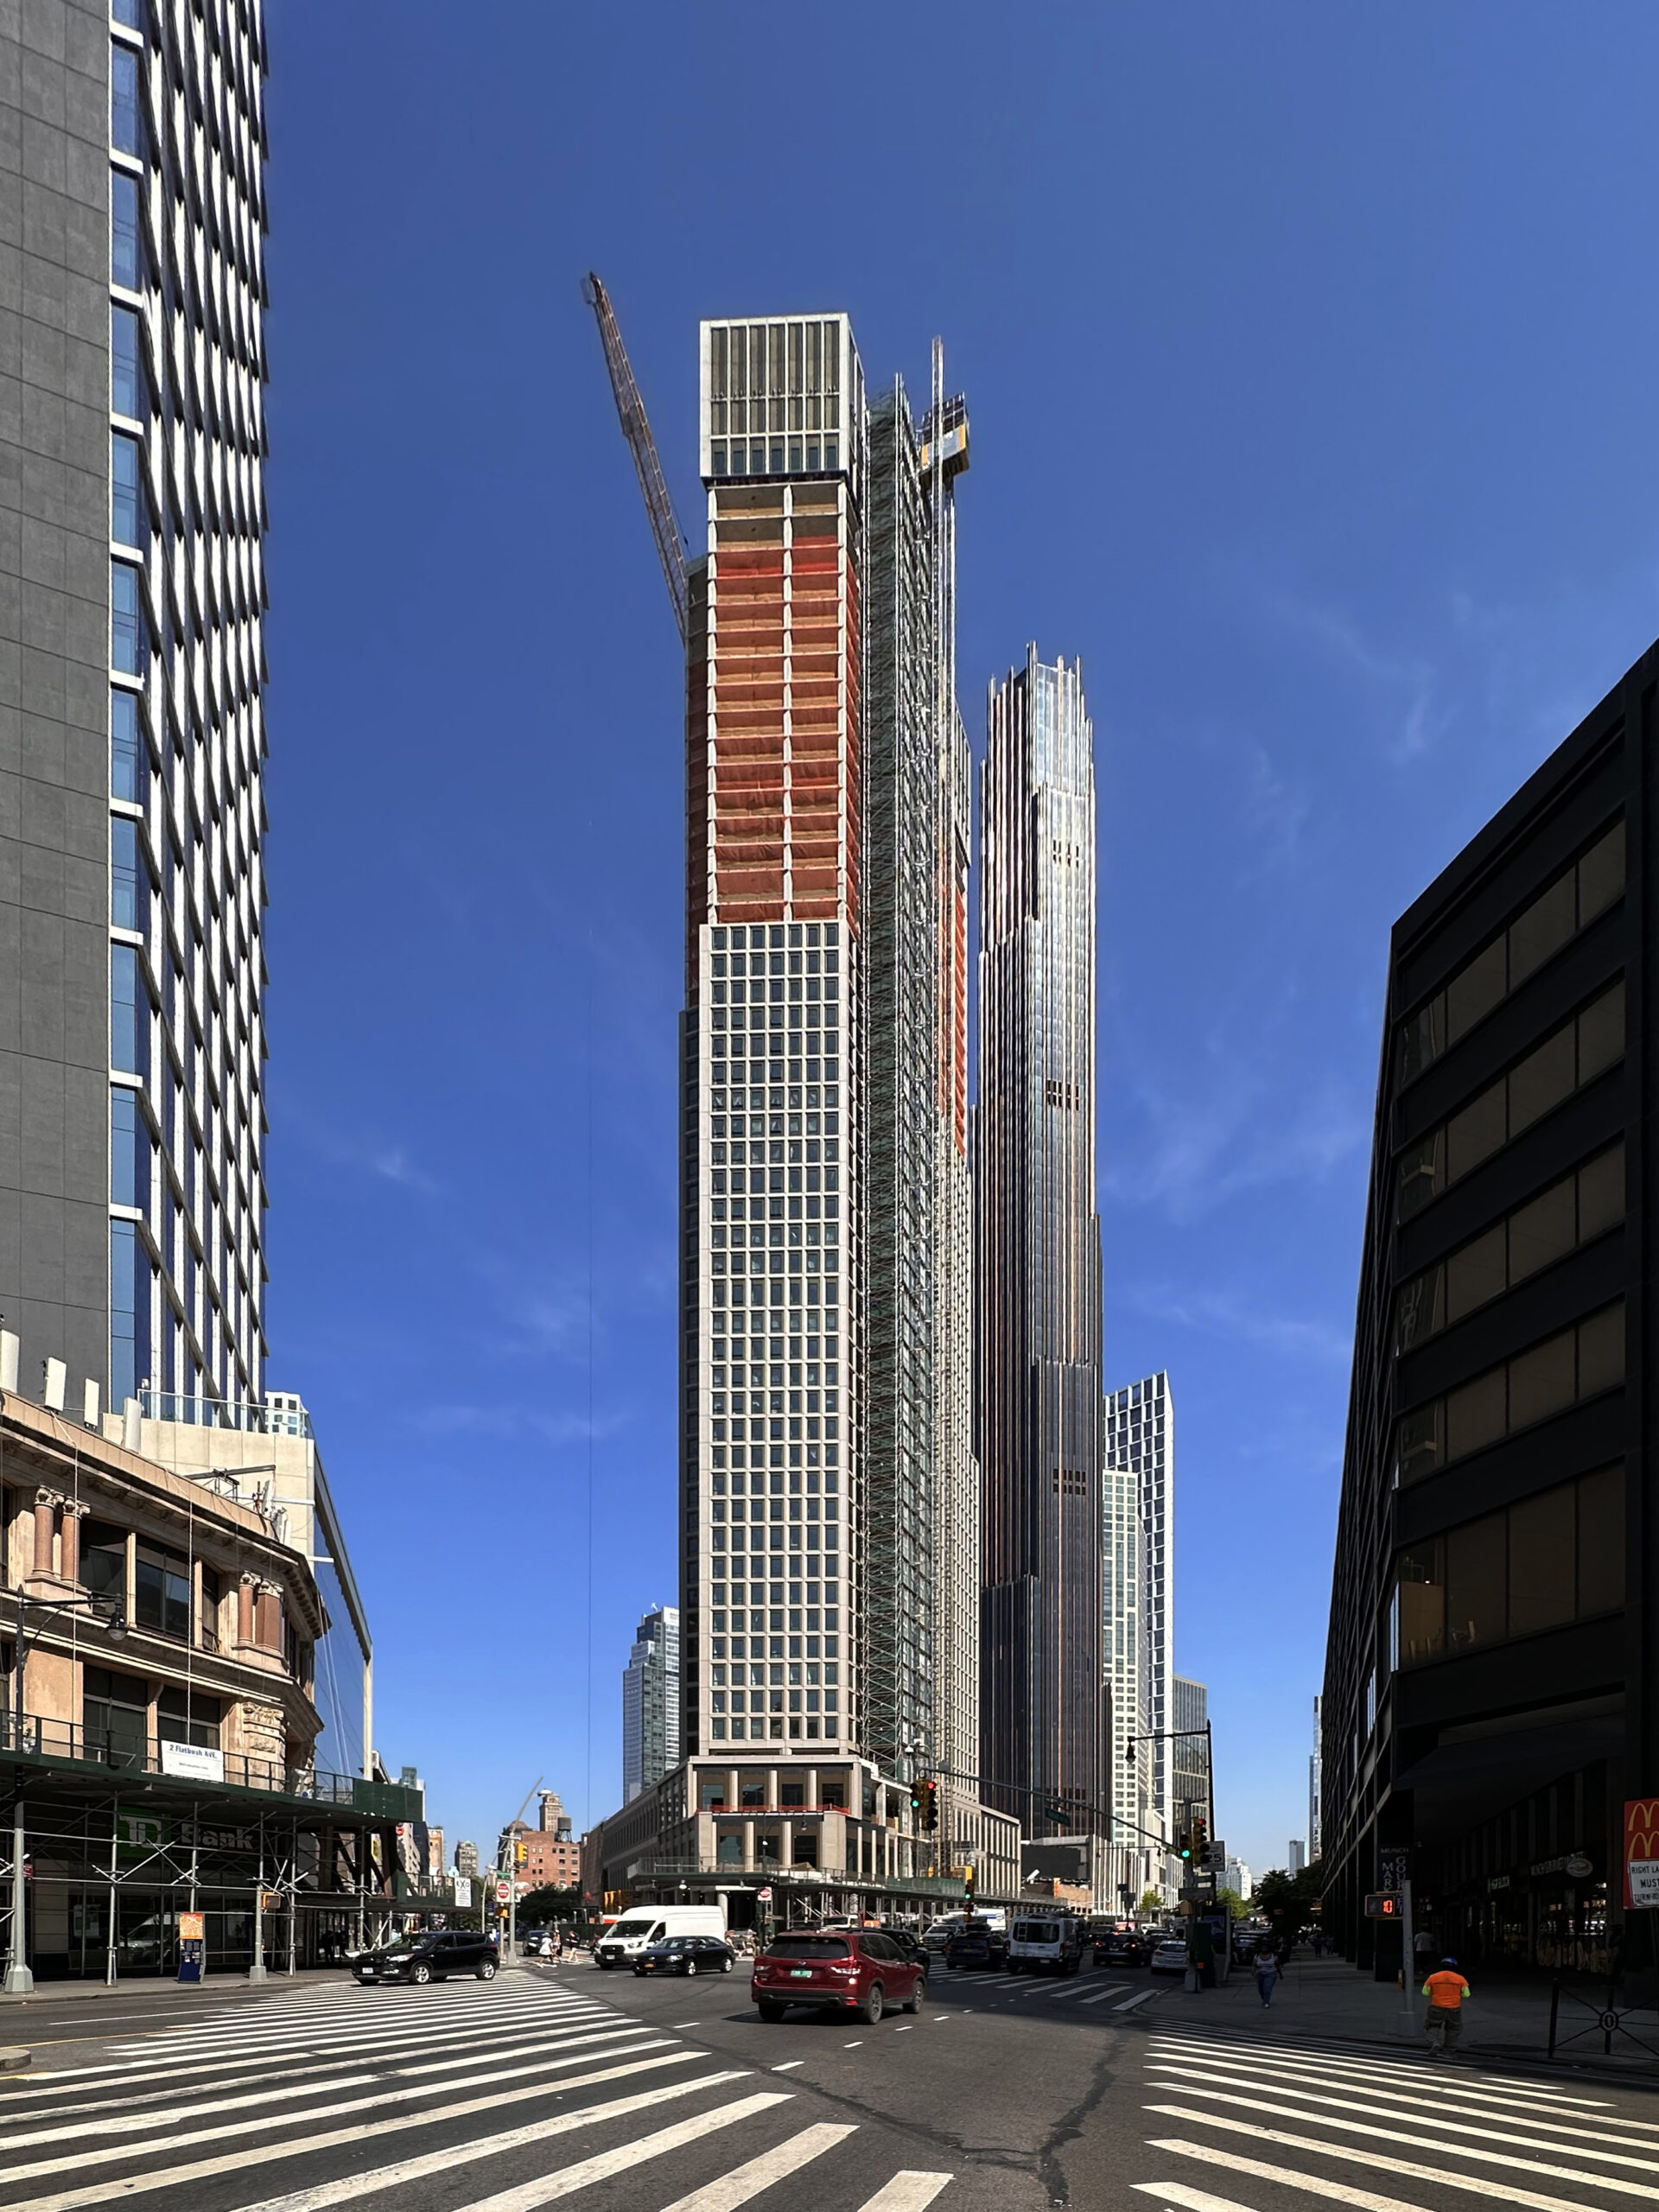
Photo by Michael Young
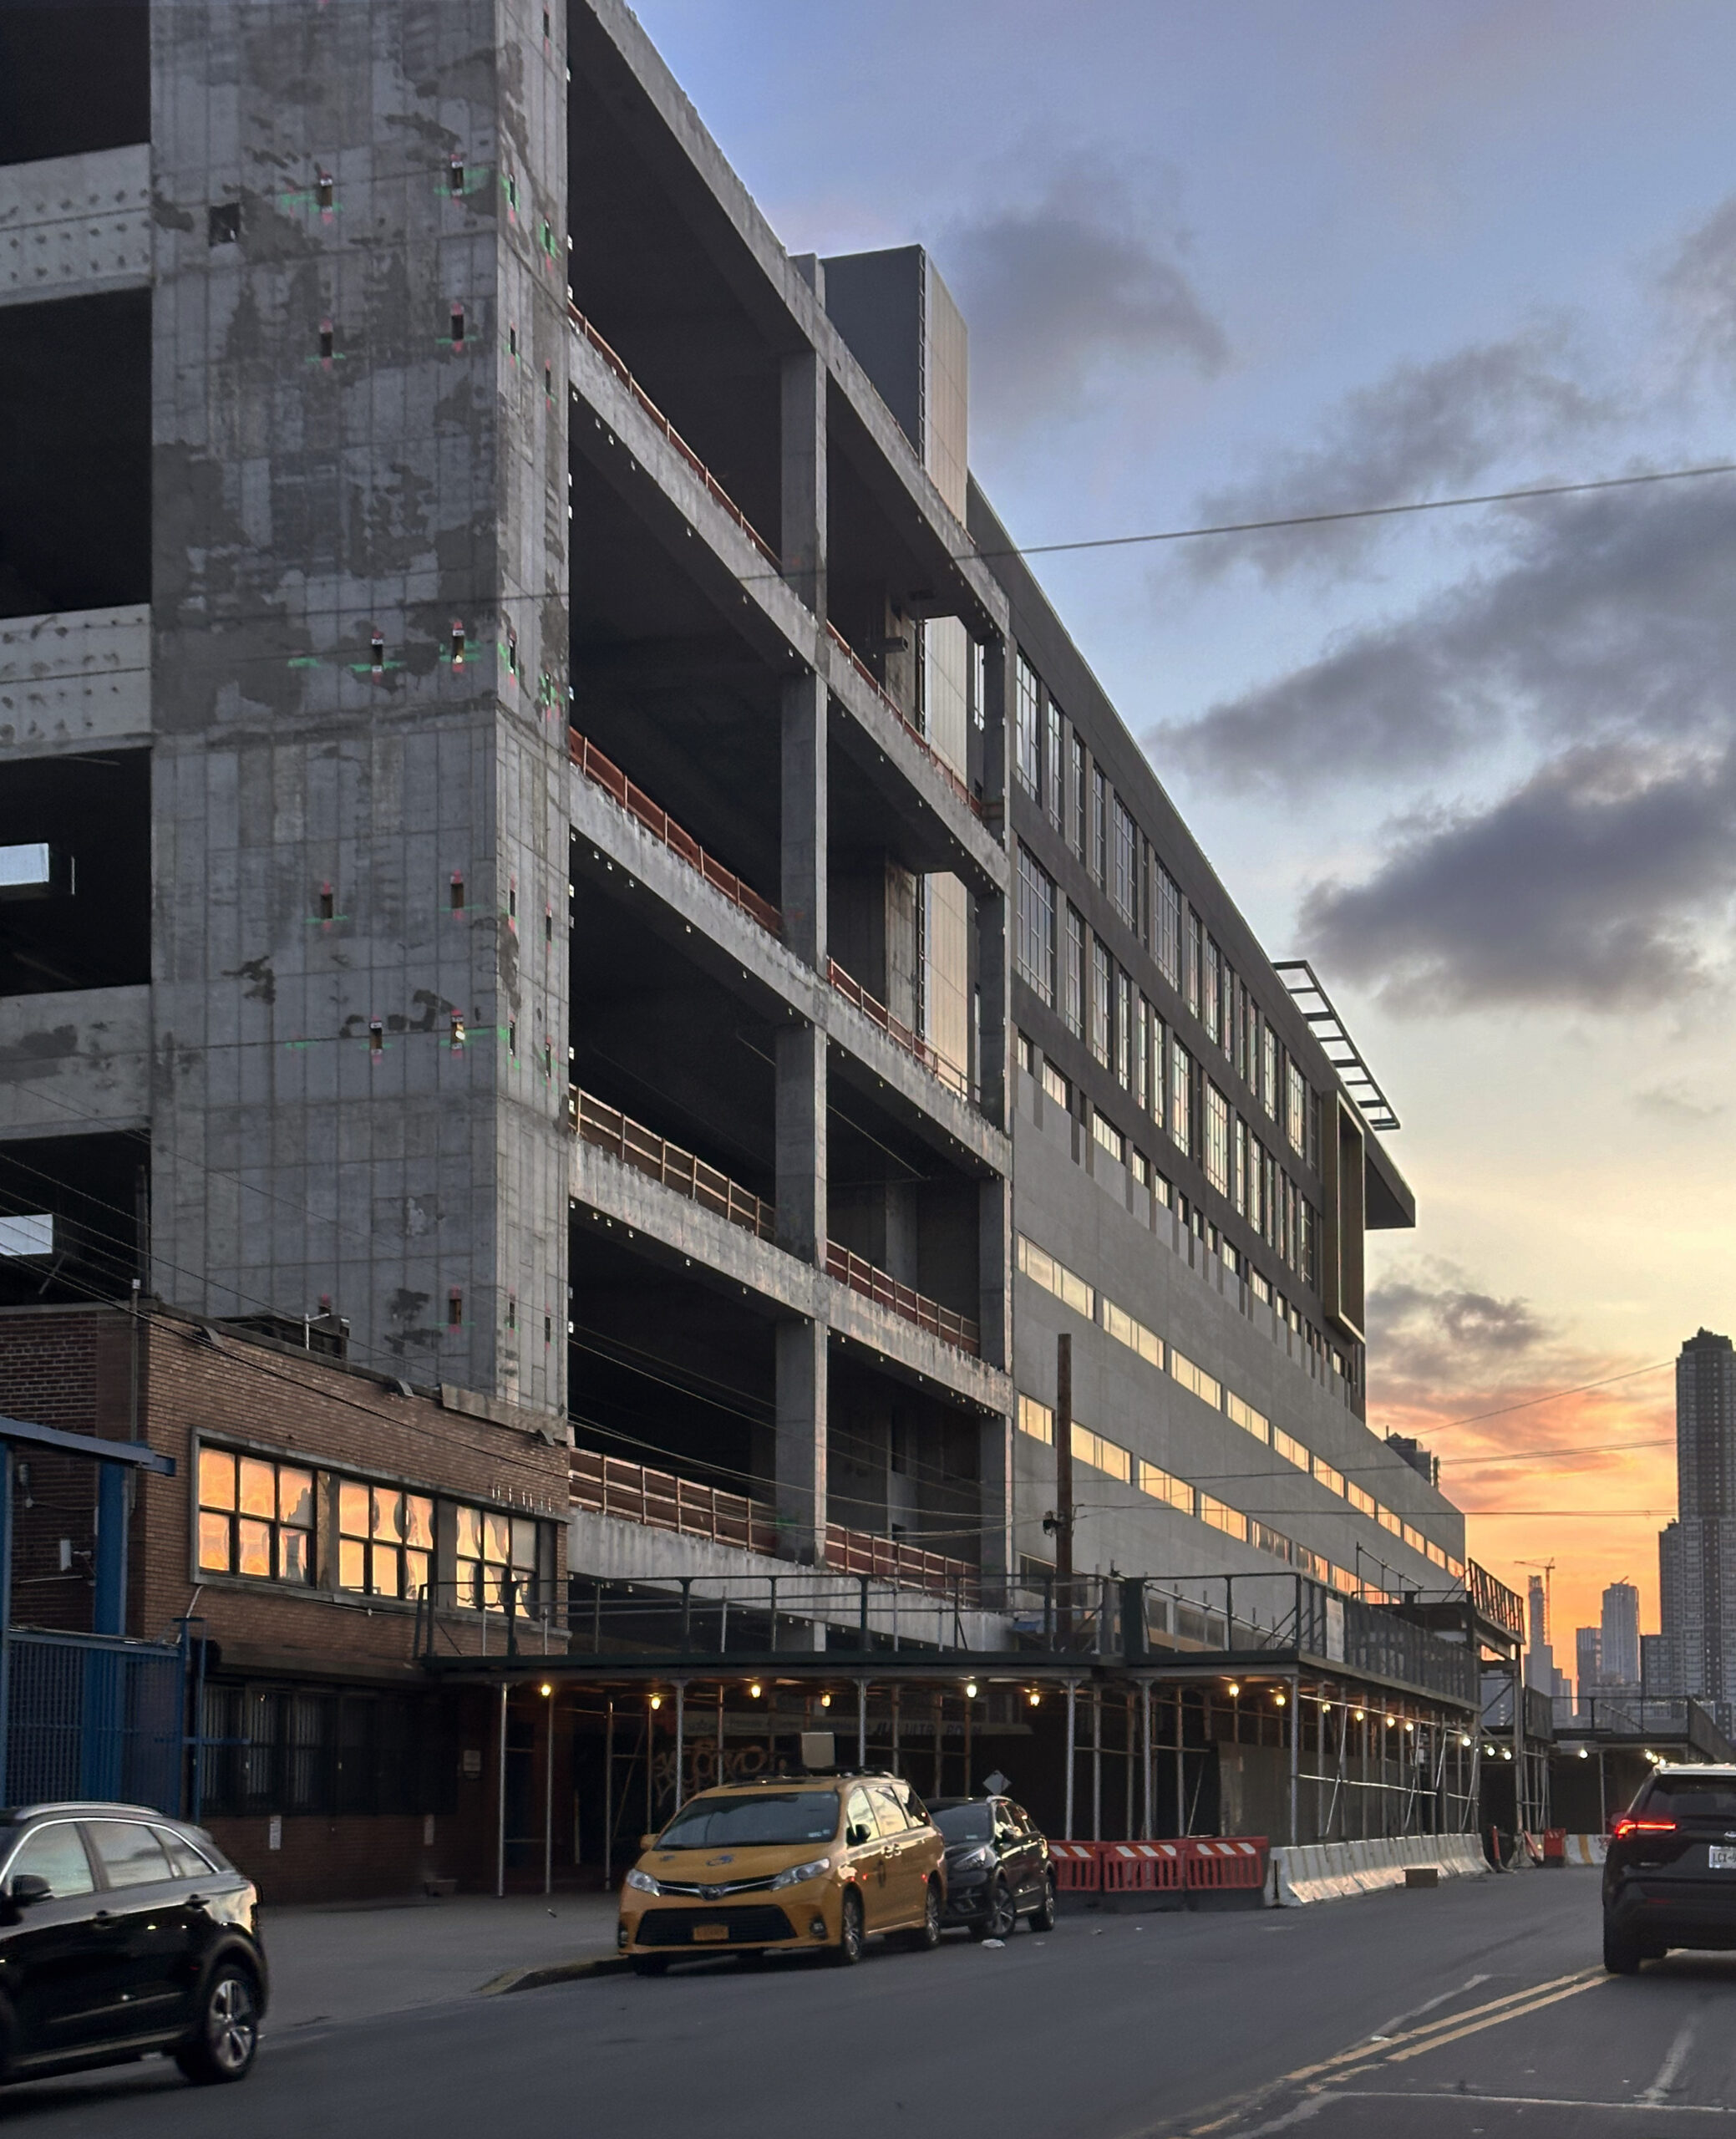
Photo by Michael Young
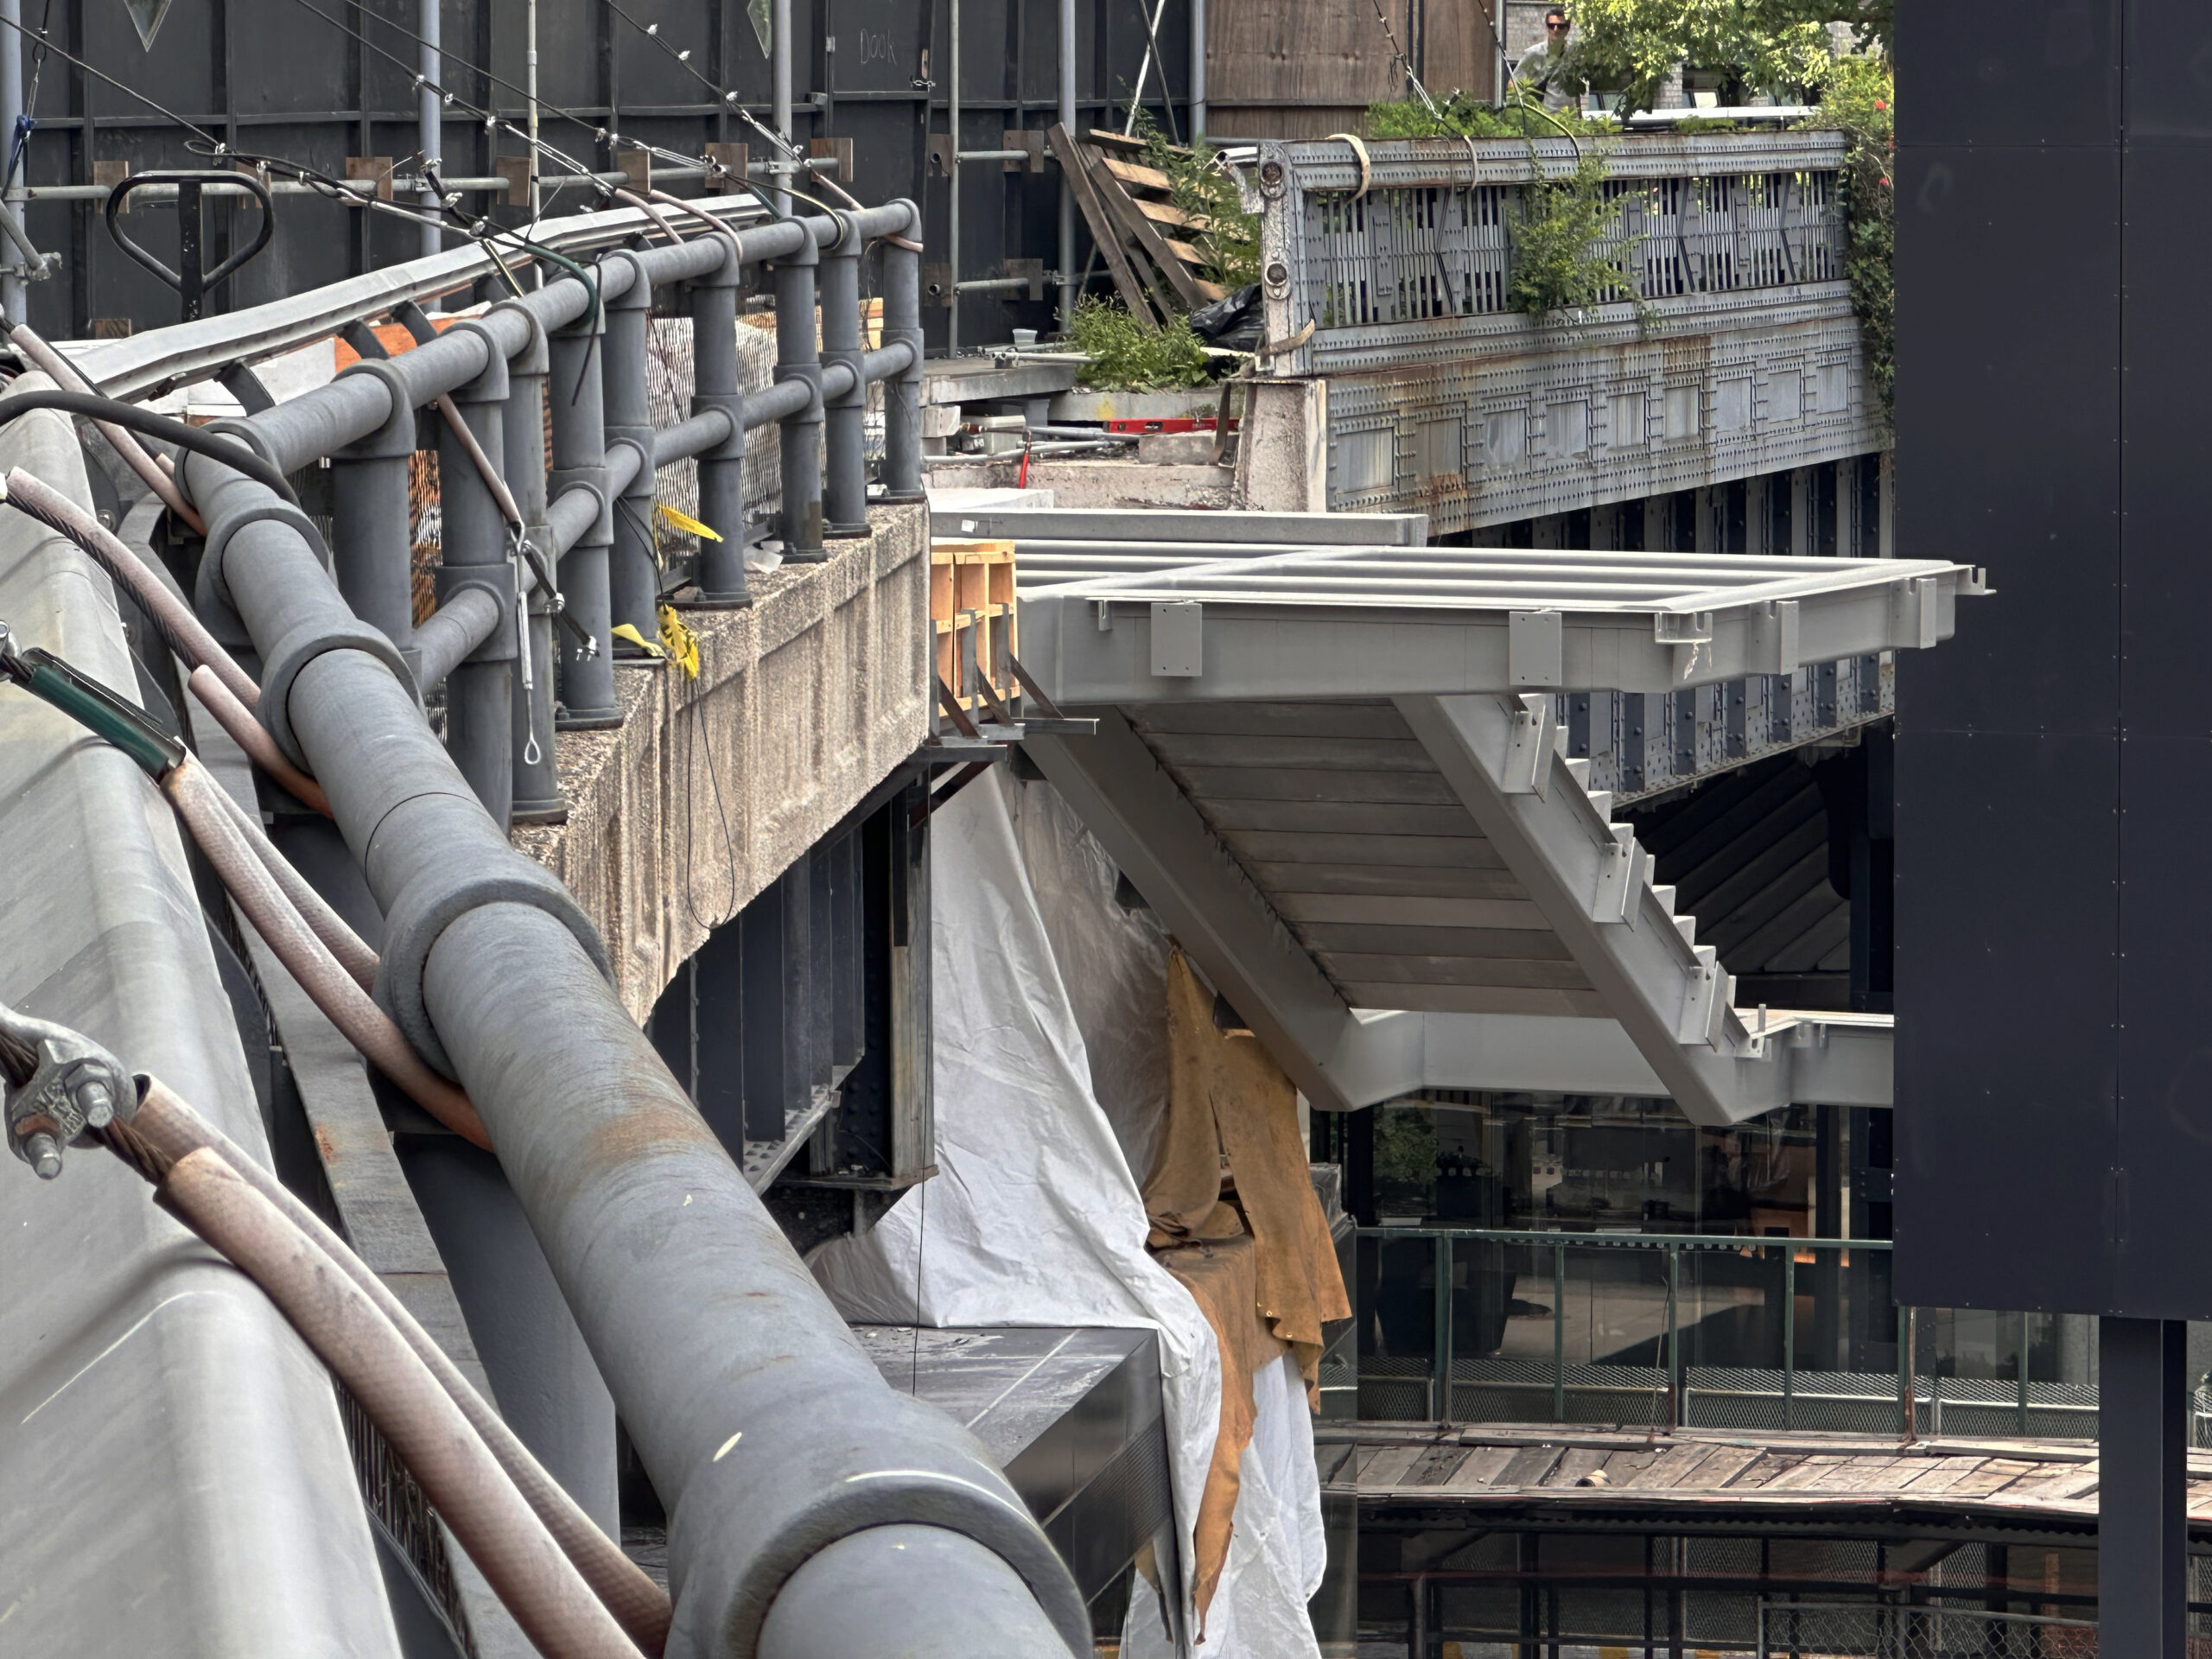
Photo by Michael Young
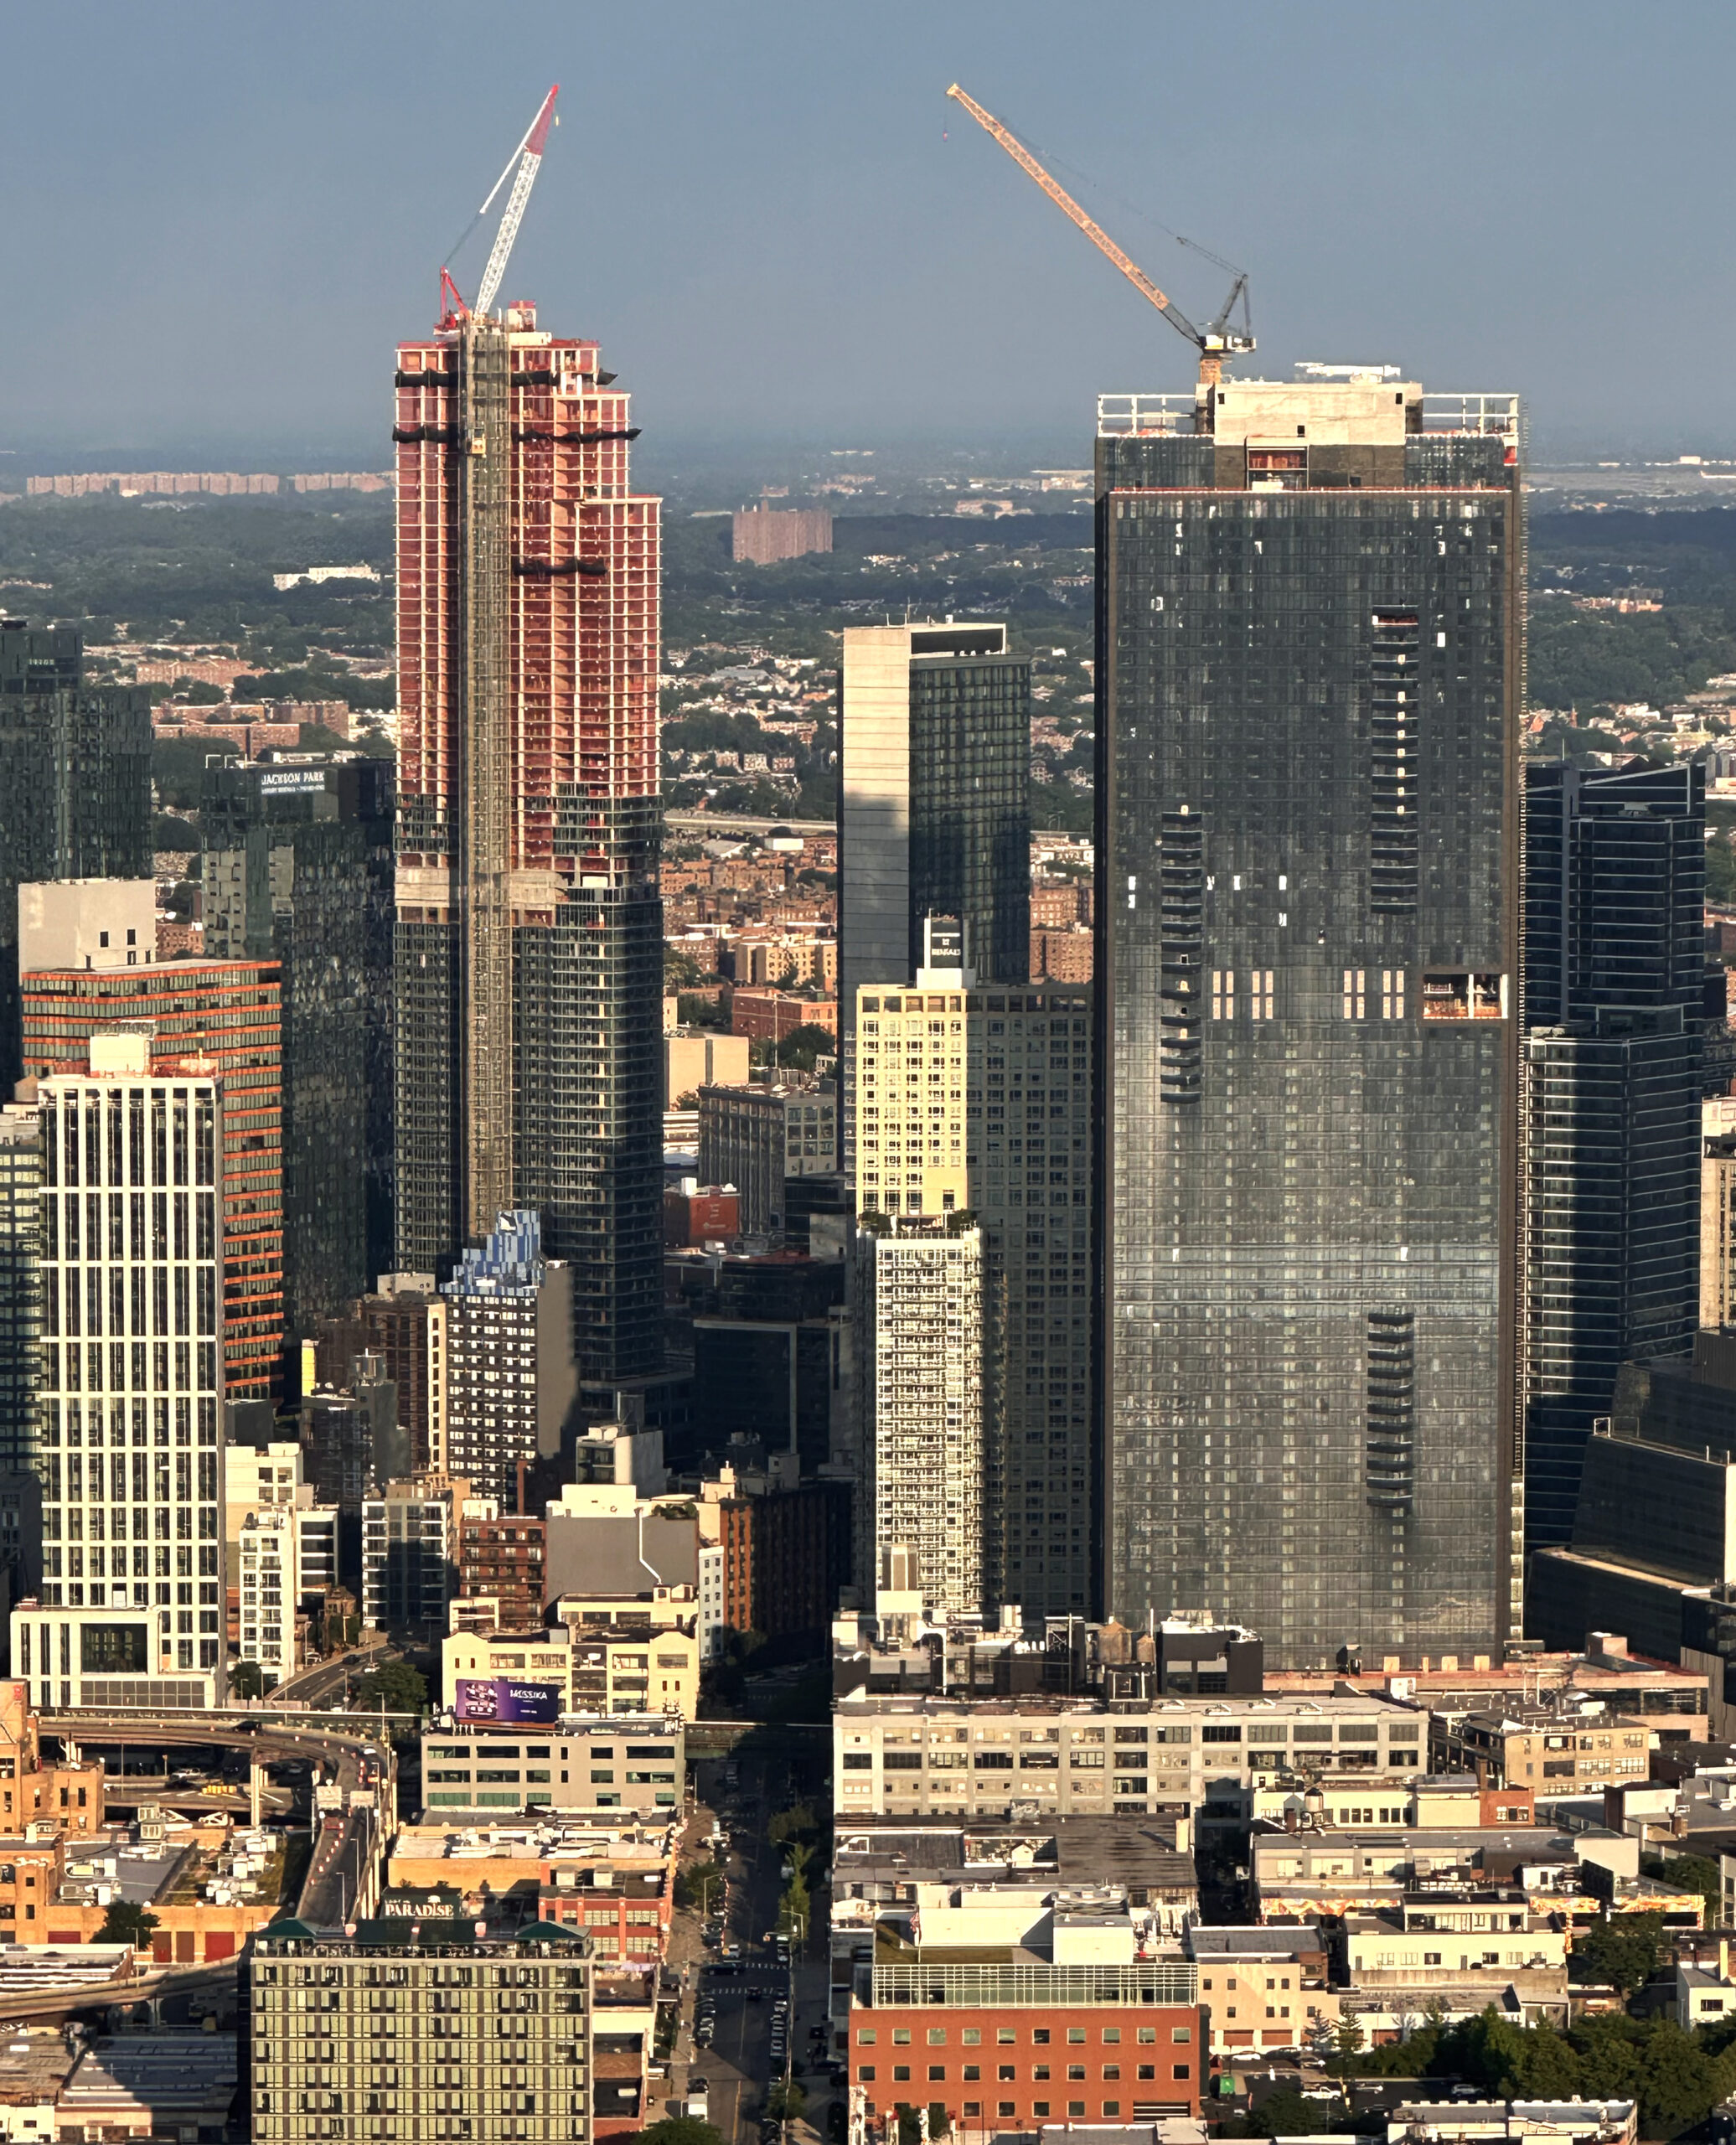
Photo by Michael Young
Photo by Michael Young
Photo by Michael Young
Photo by Michael Young
Photo by Michael Young
Photo by MPhoto by Michael Youngichael Young
Photo by Michael Young
Photo by Michael Young
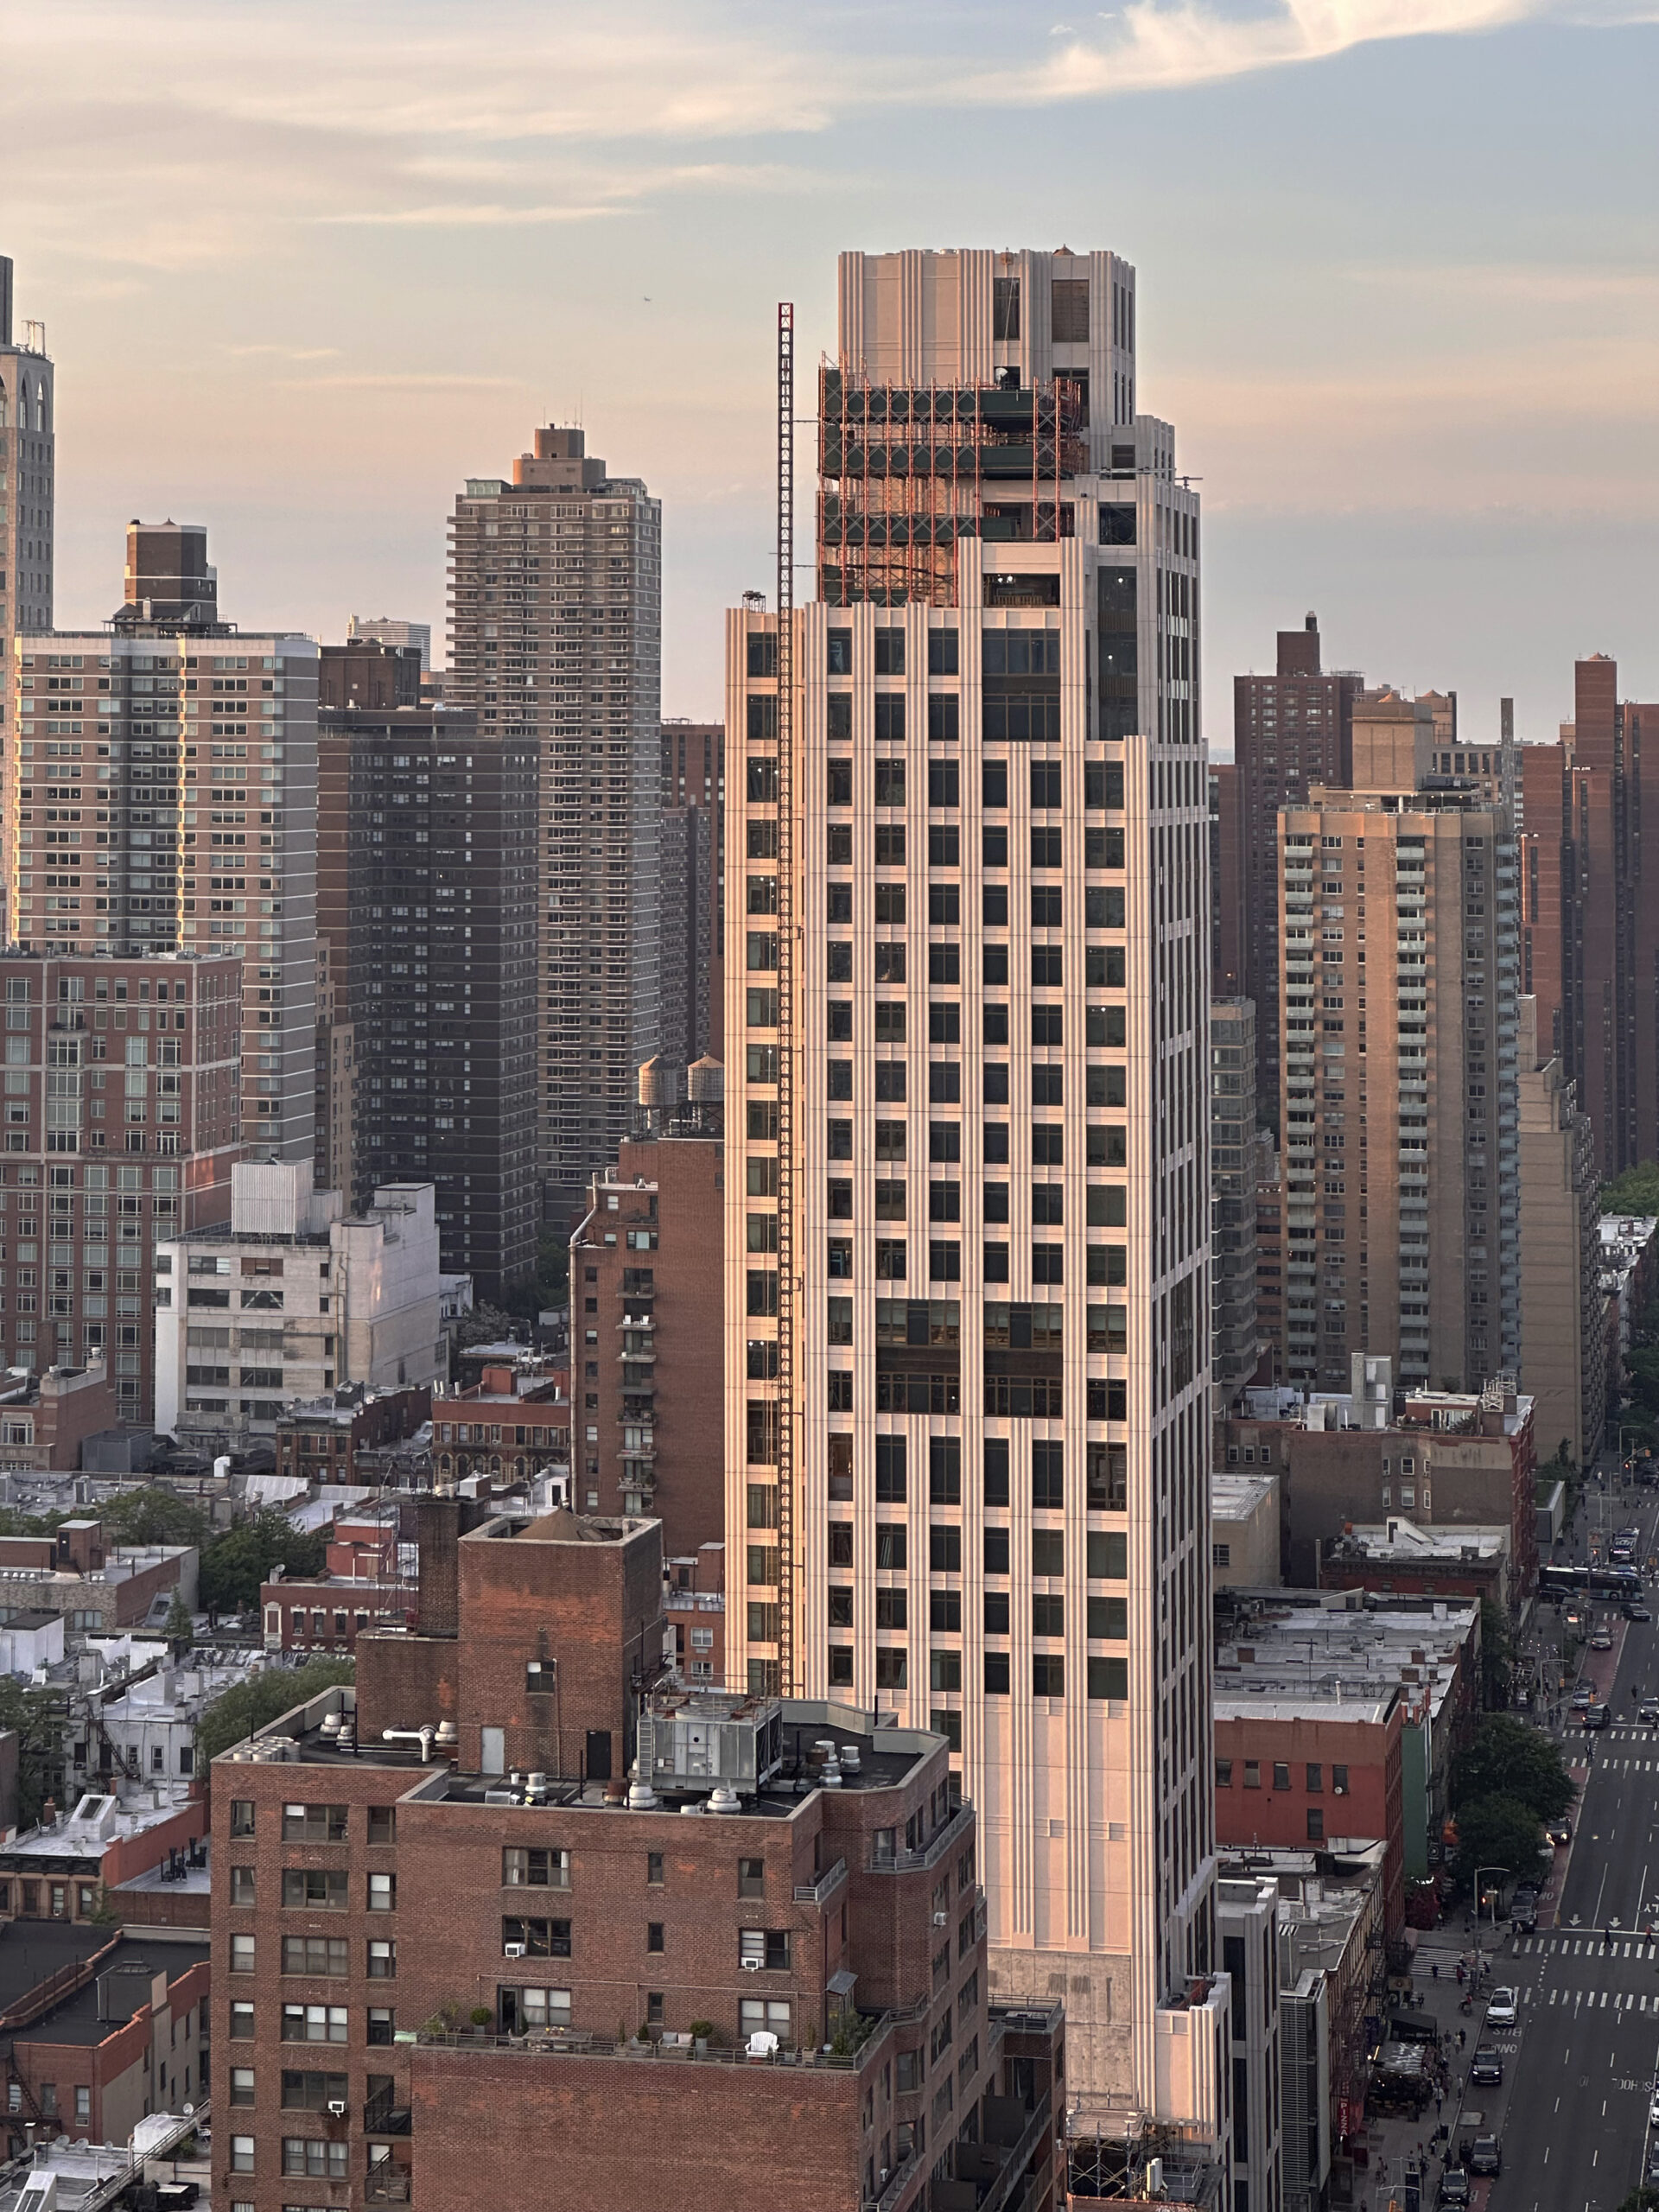
Photo by Michael Young
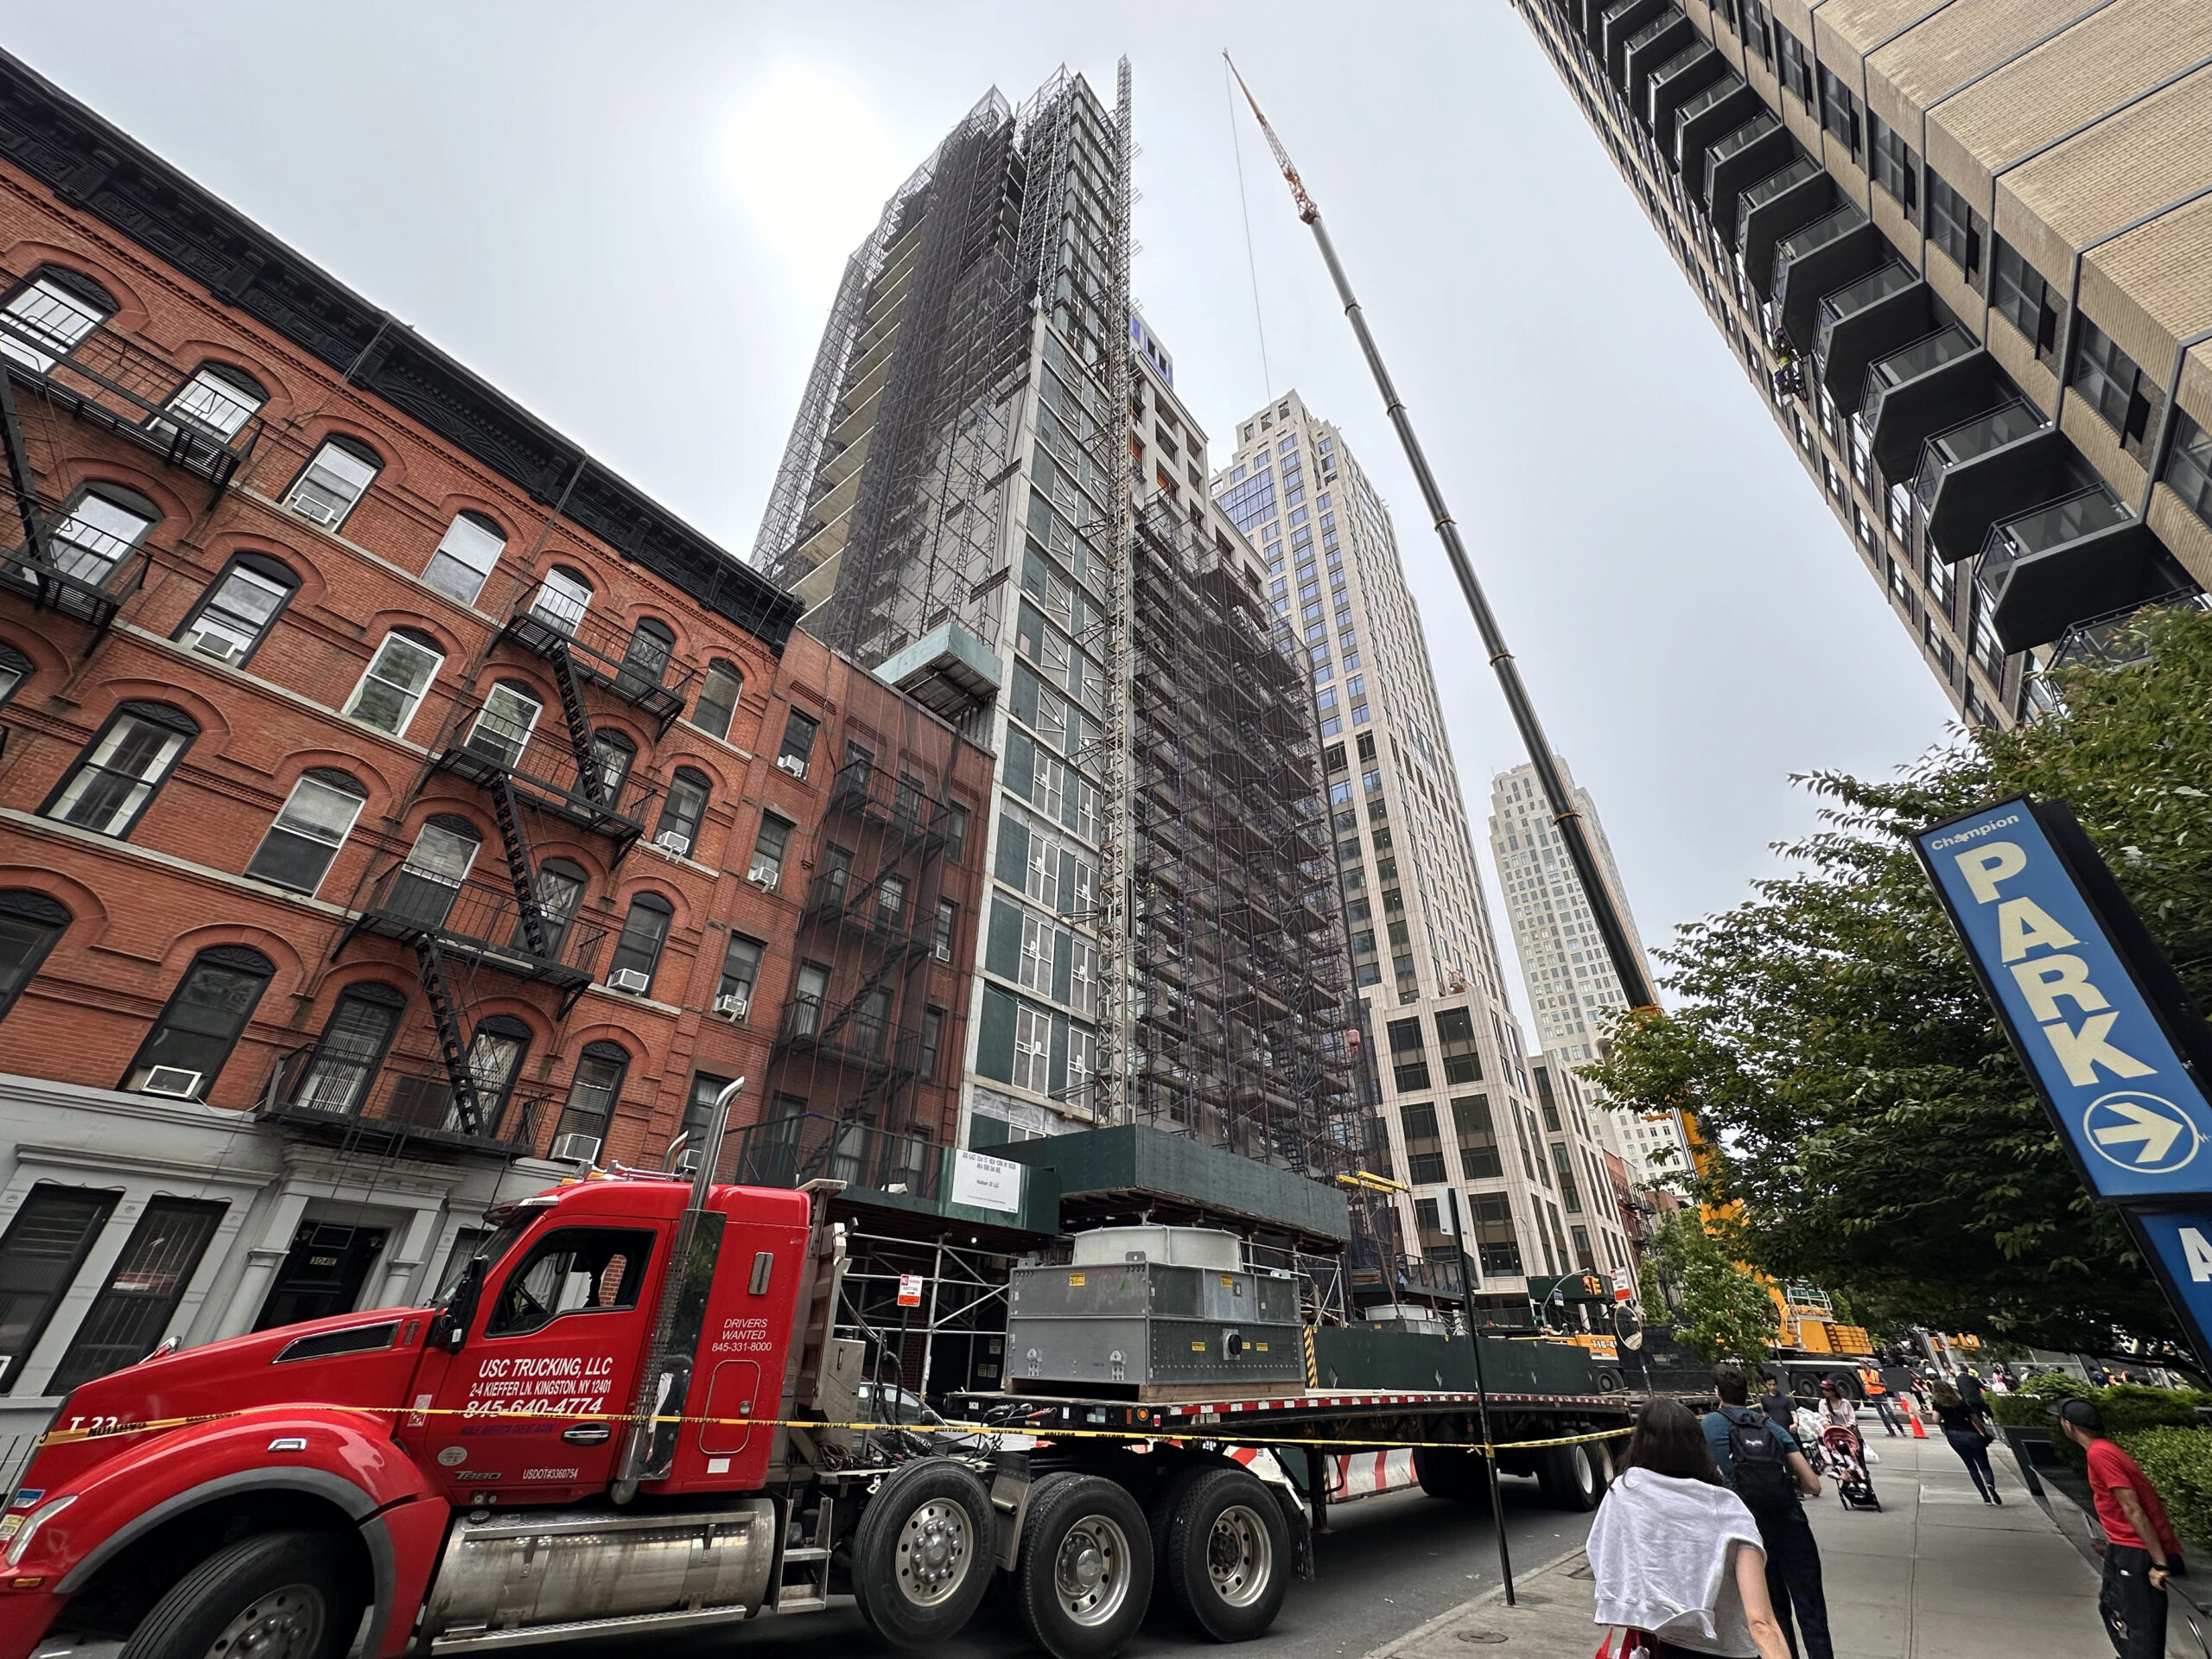
Photo by Michael Young
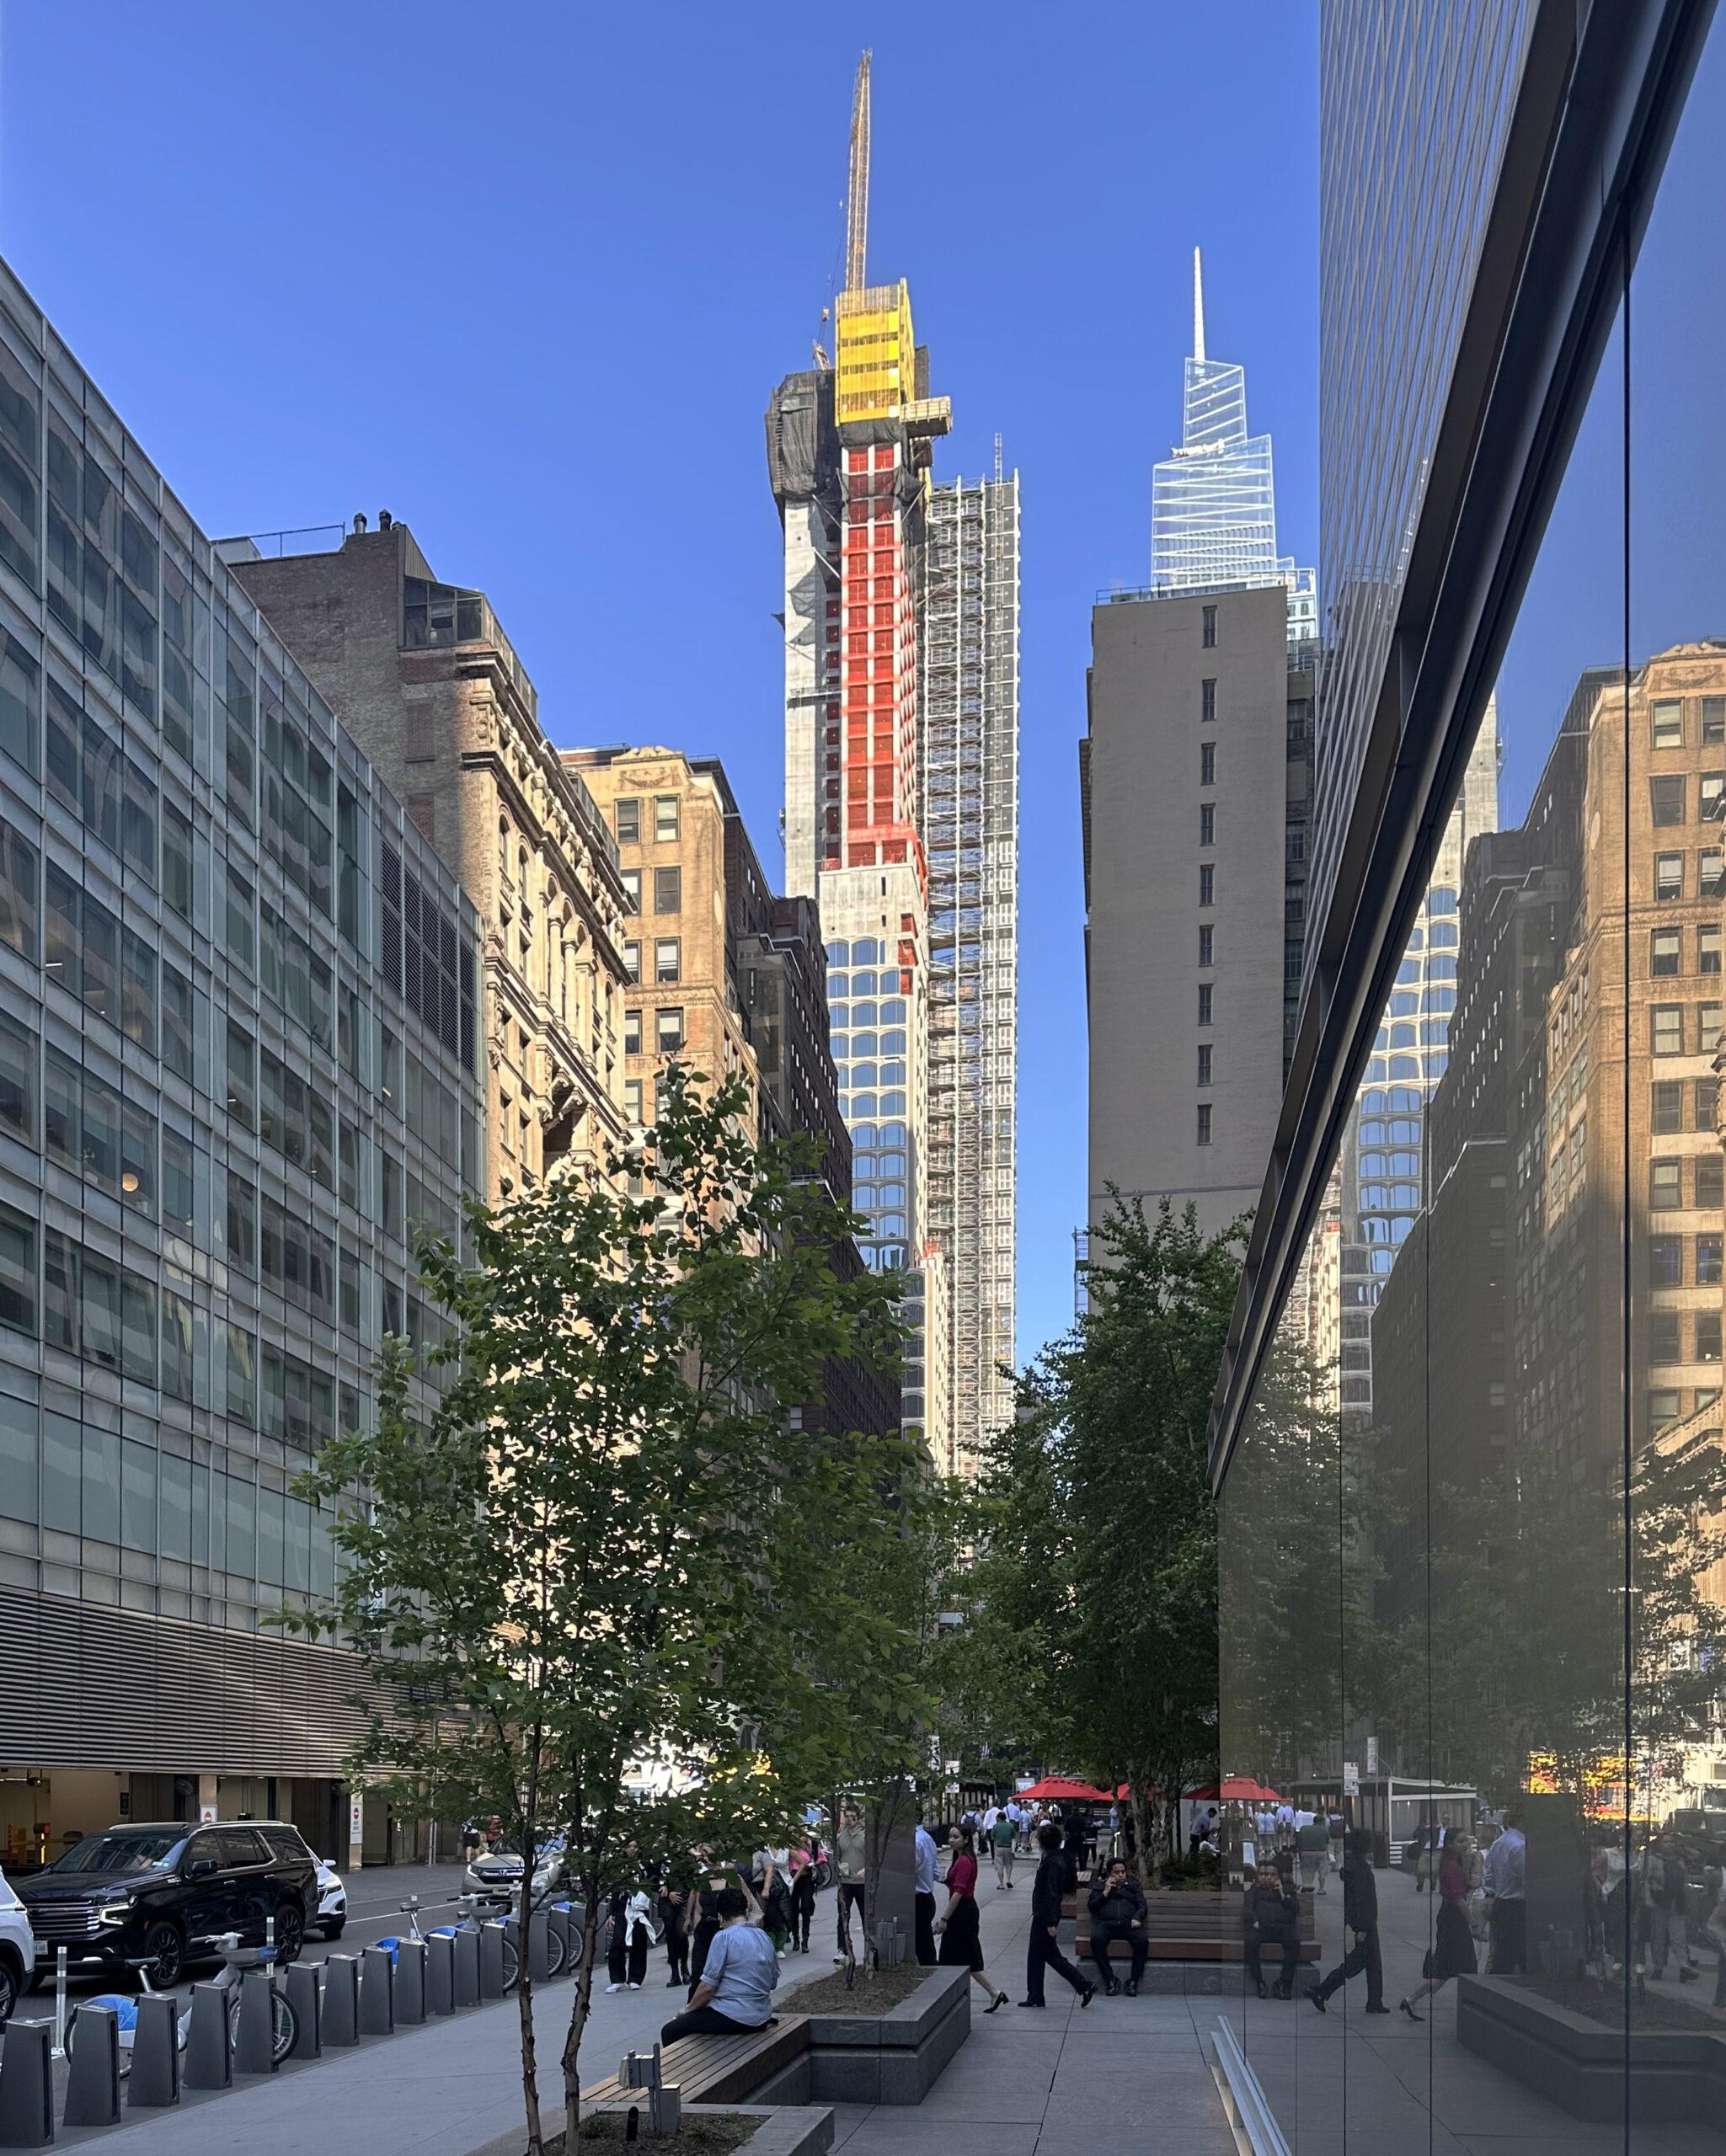
Photo by Michael Young
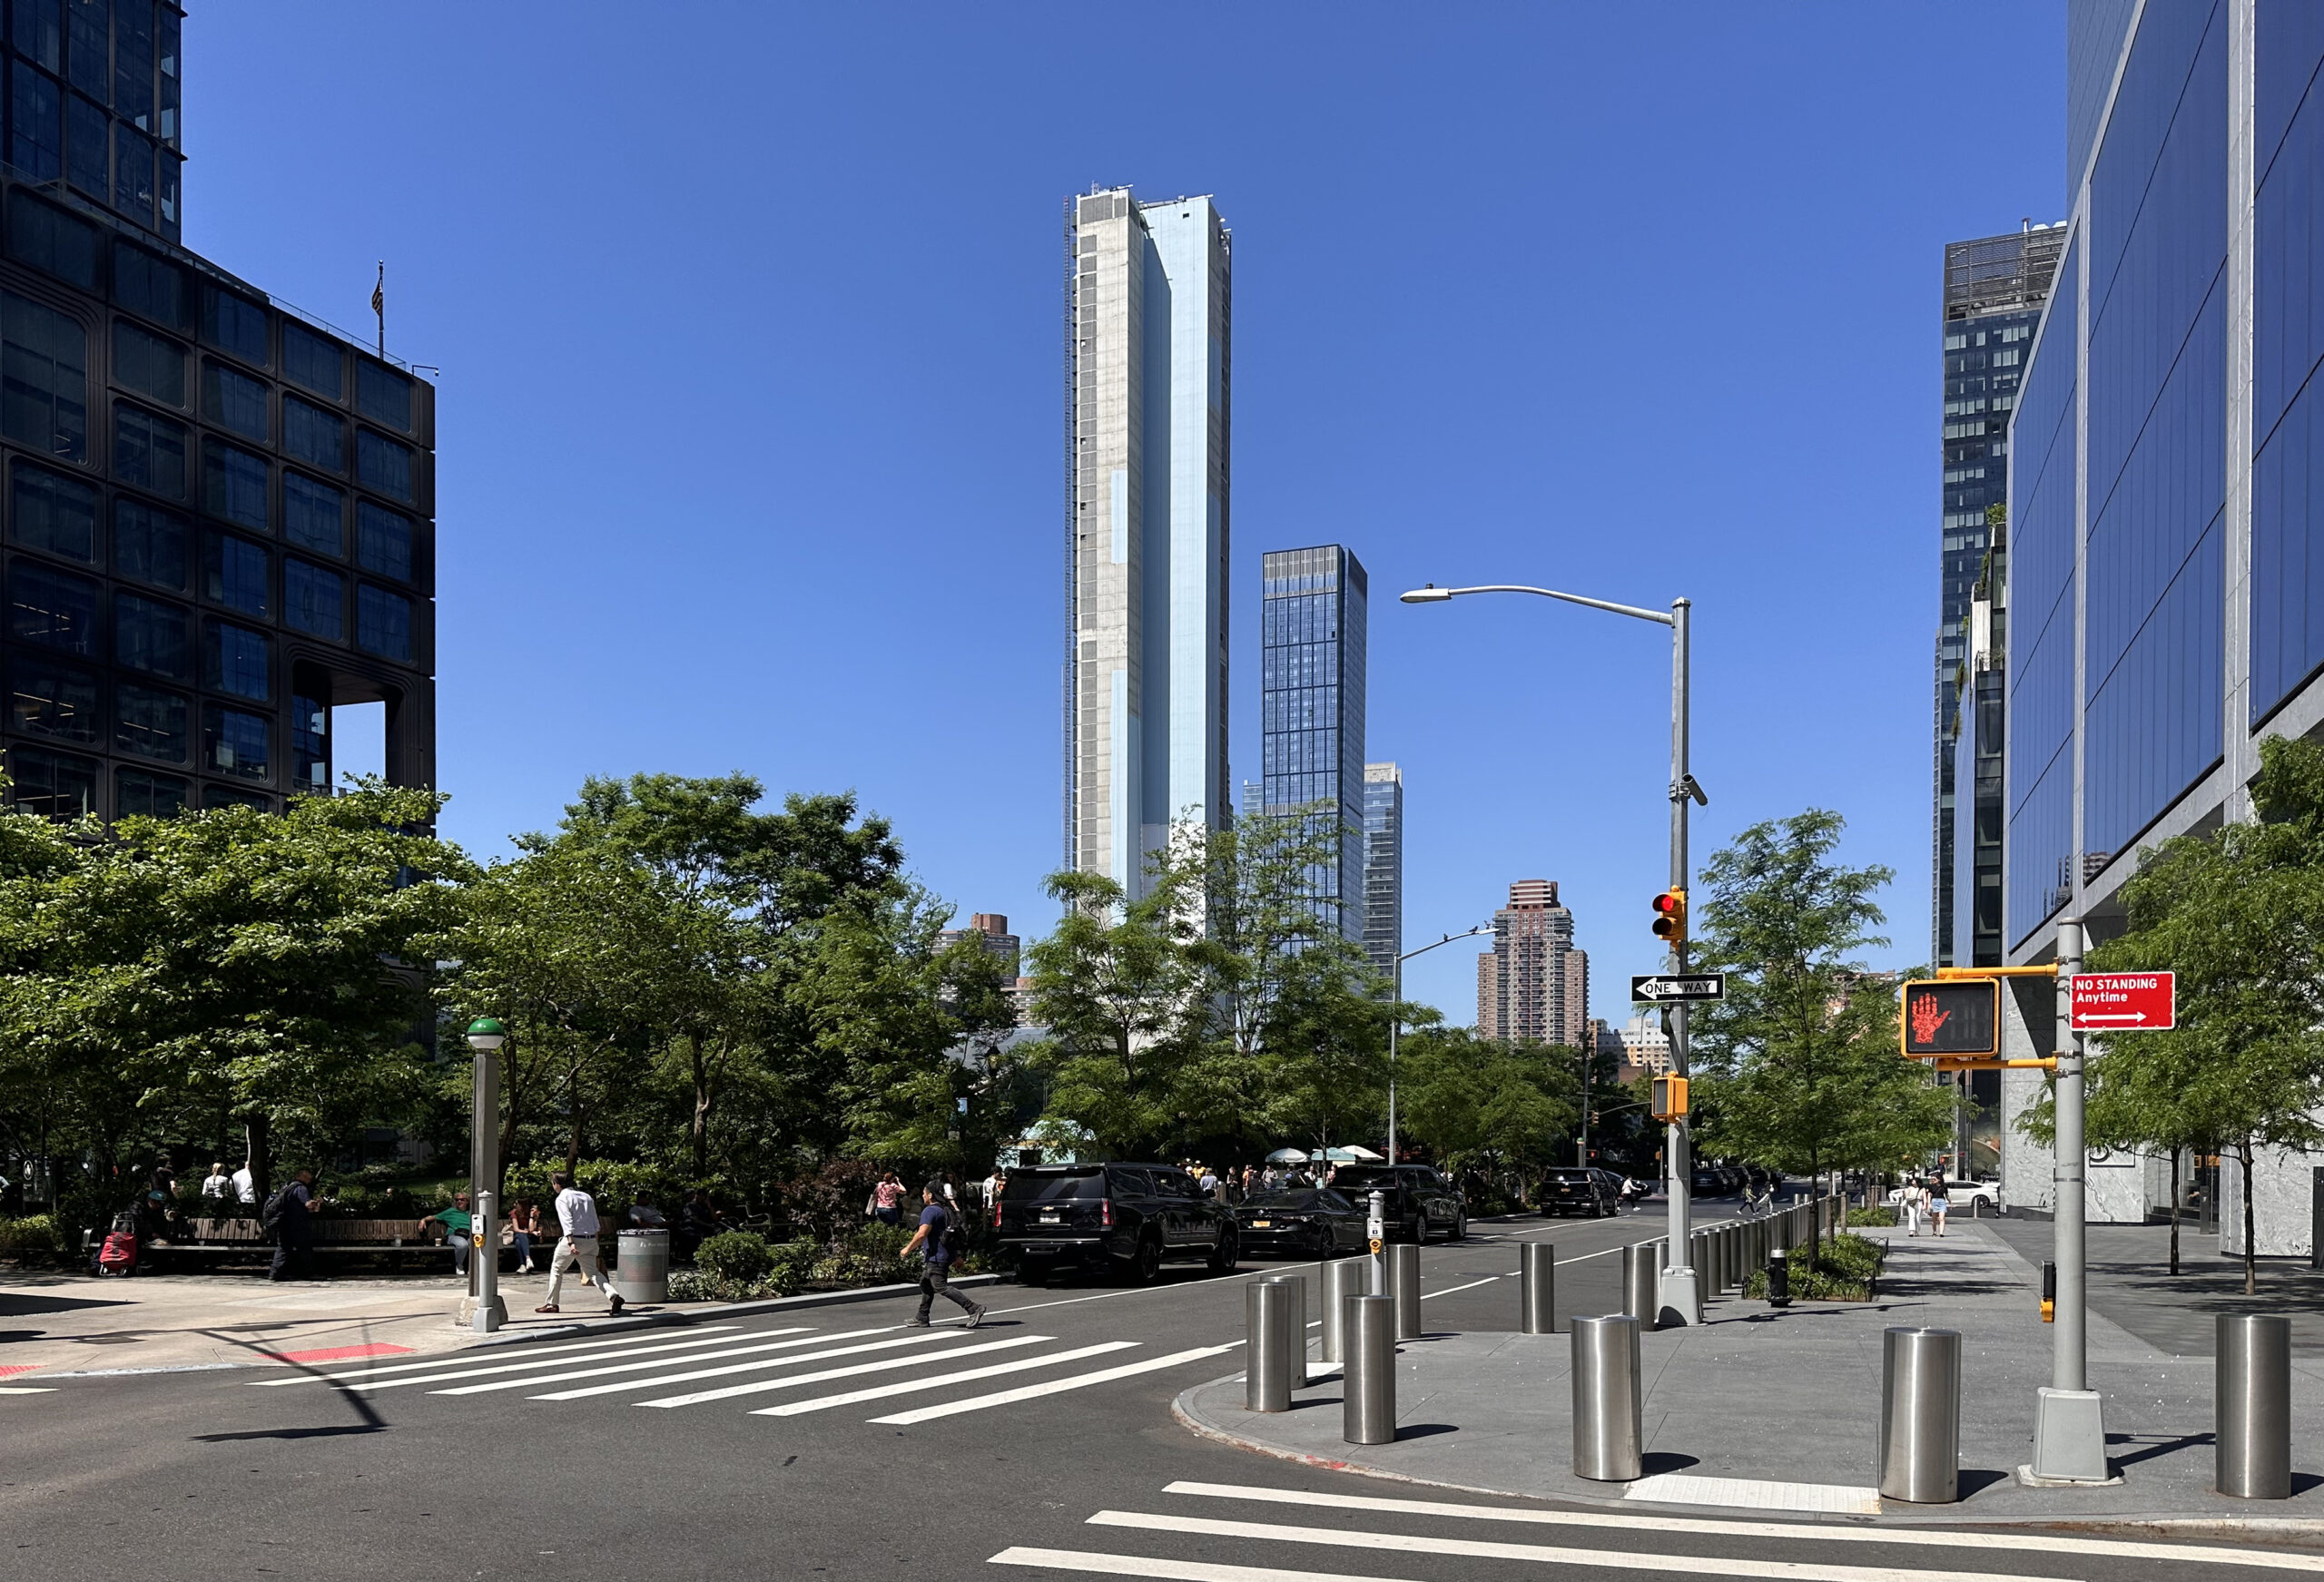
Photo by Michael Young
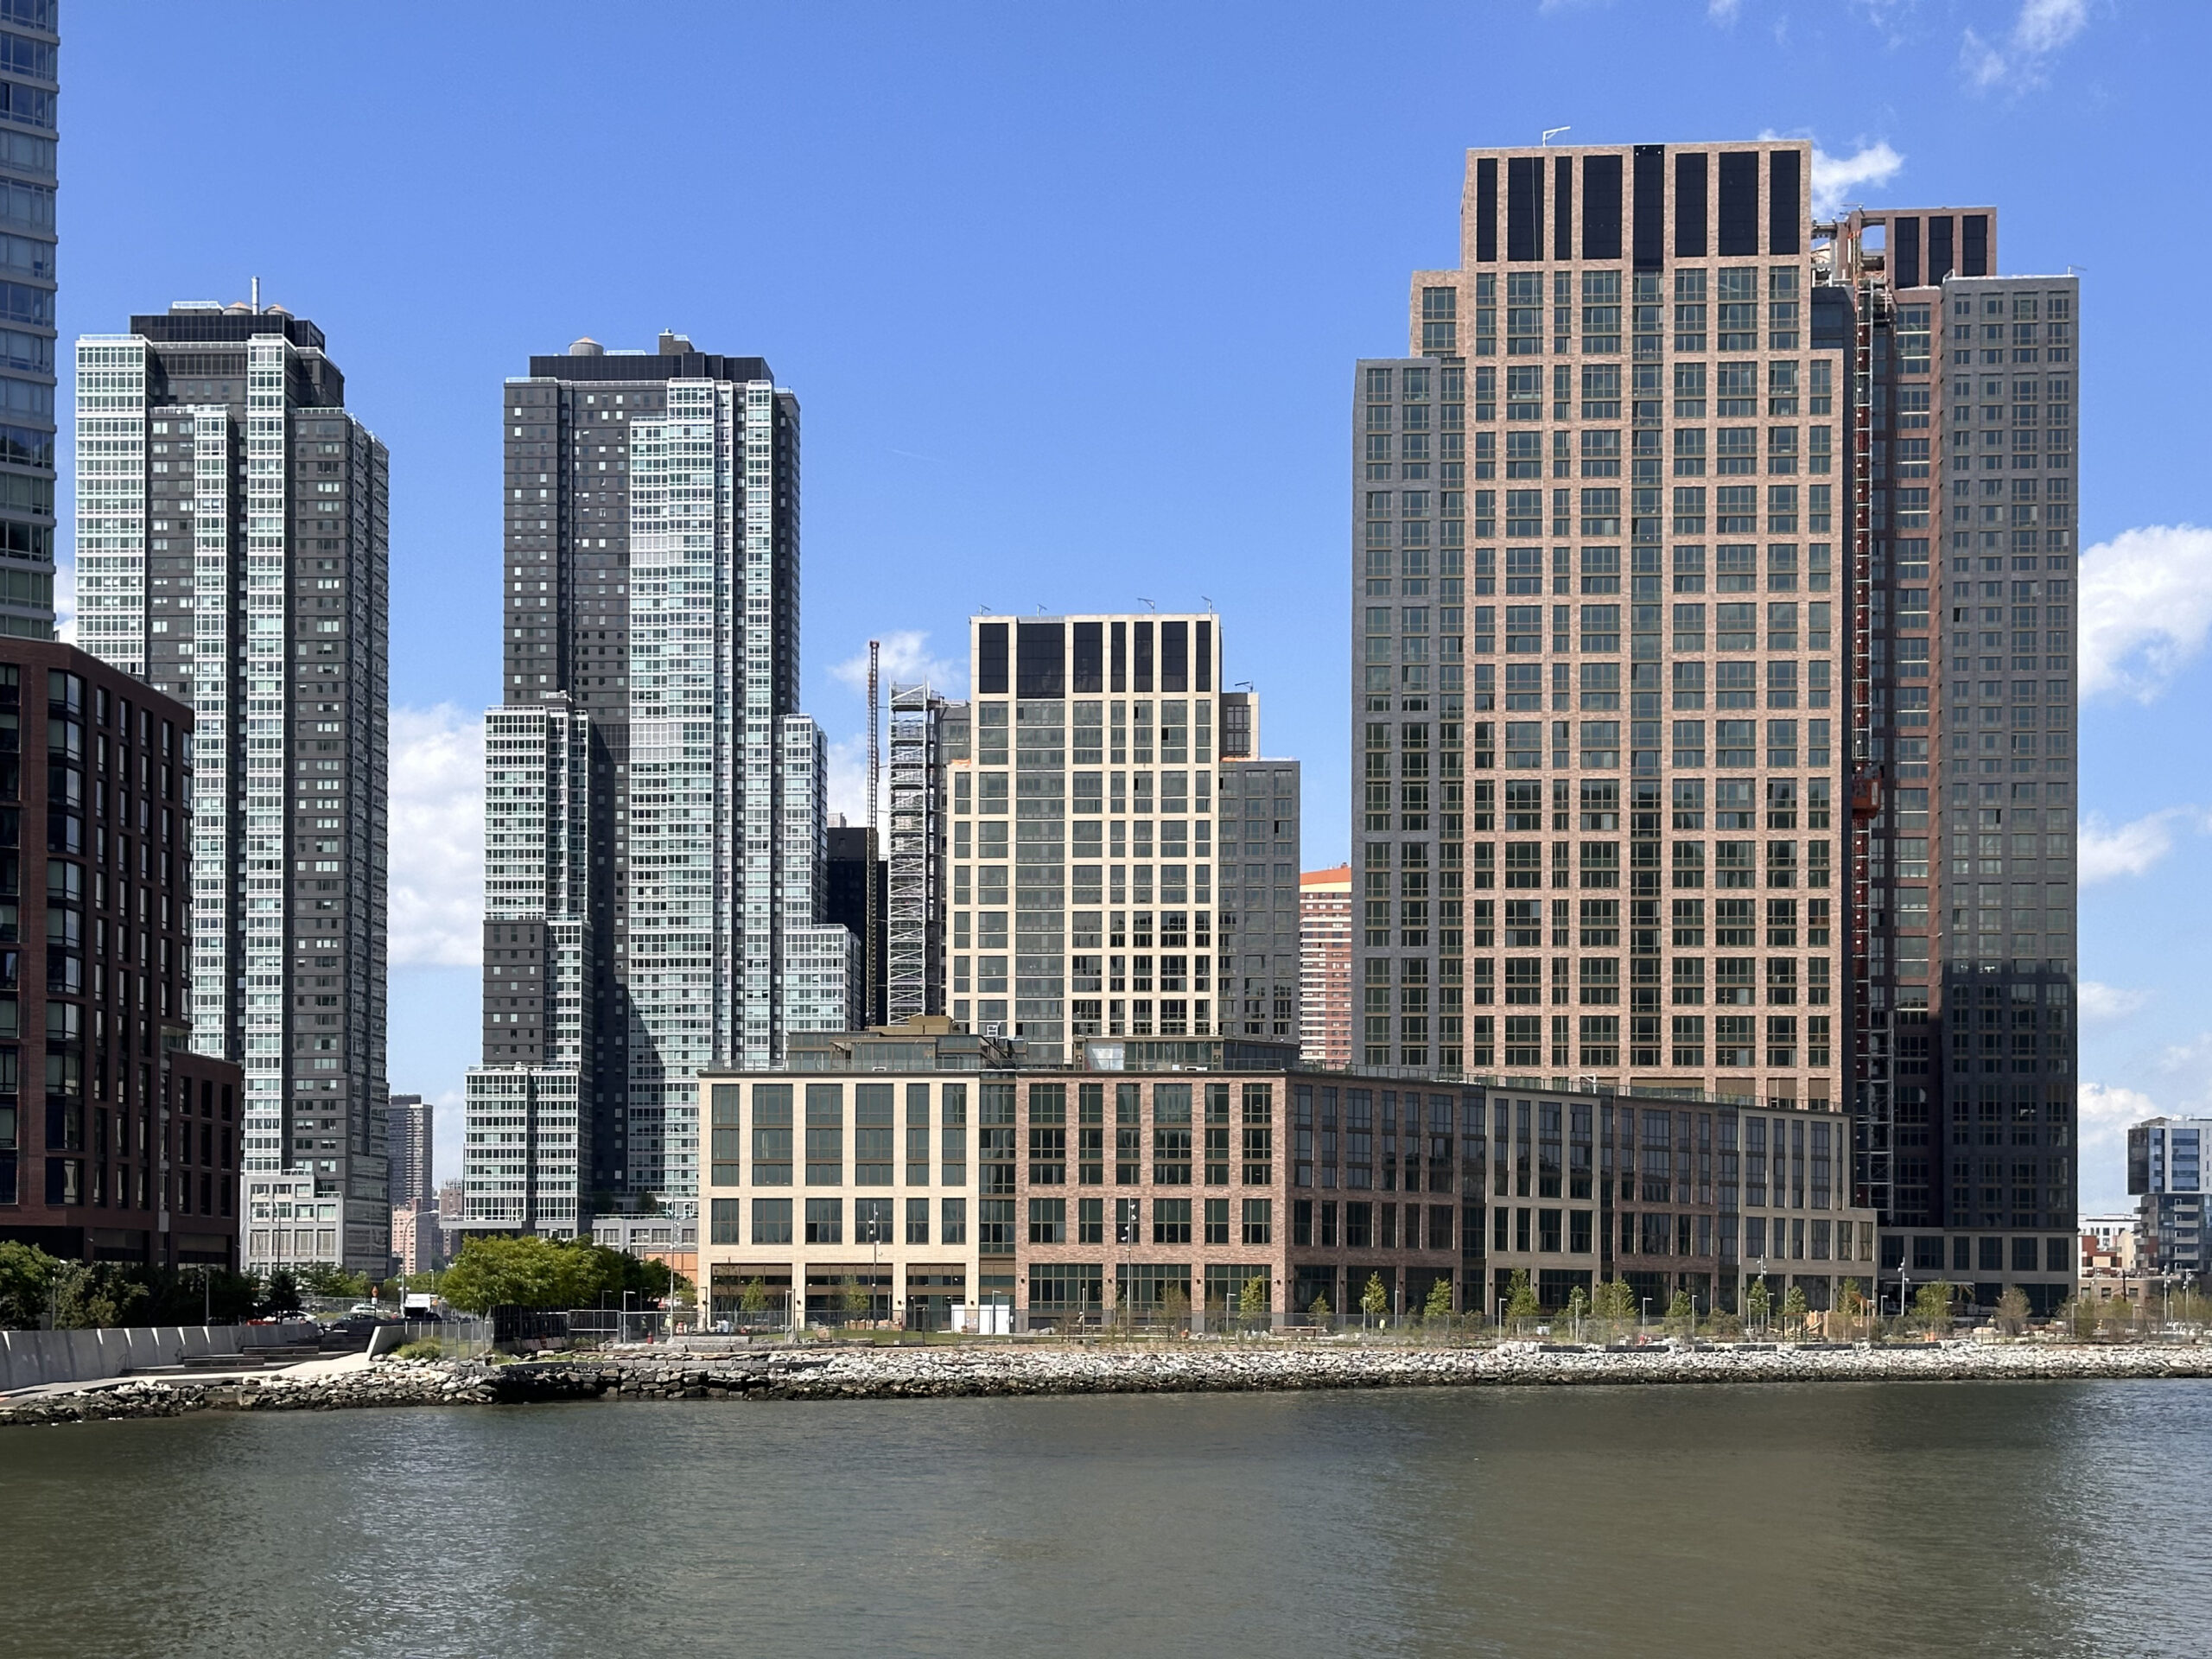
Photo by Michael Young

Photo by Michael Young
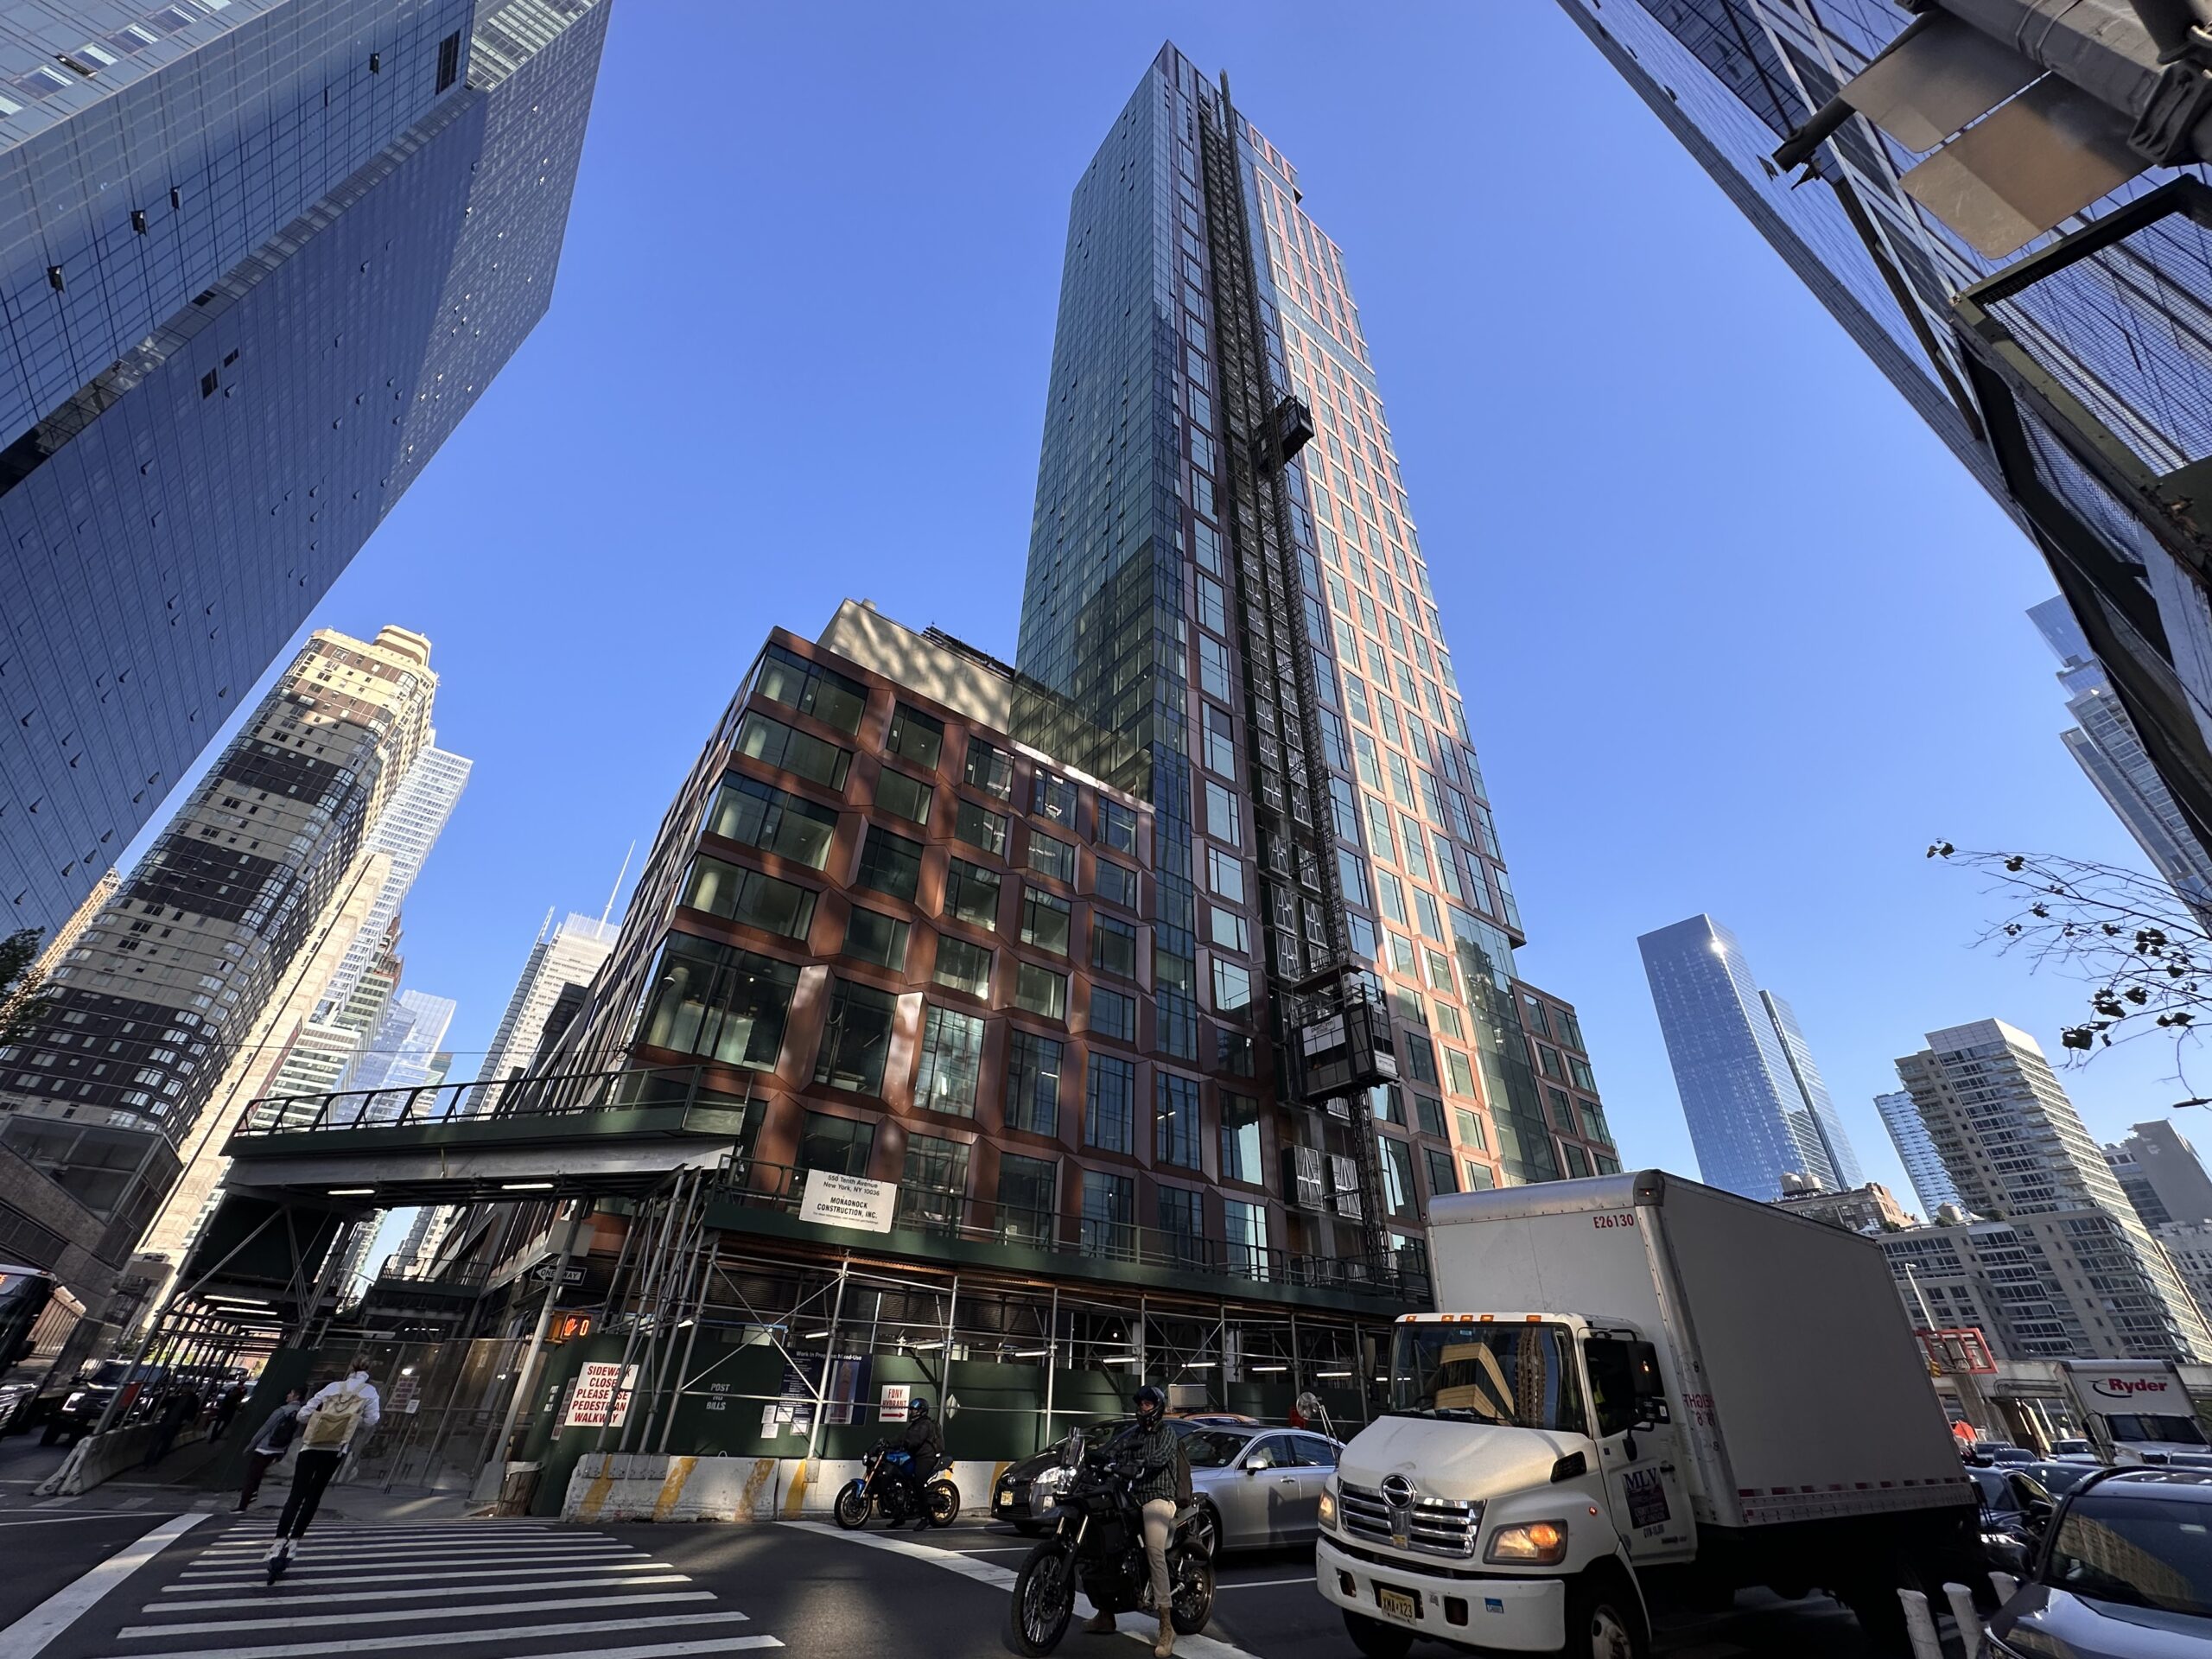
Photo by Michael Young
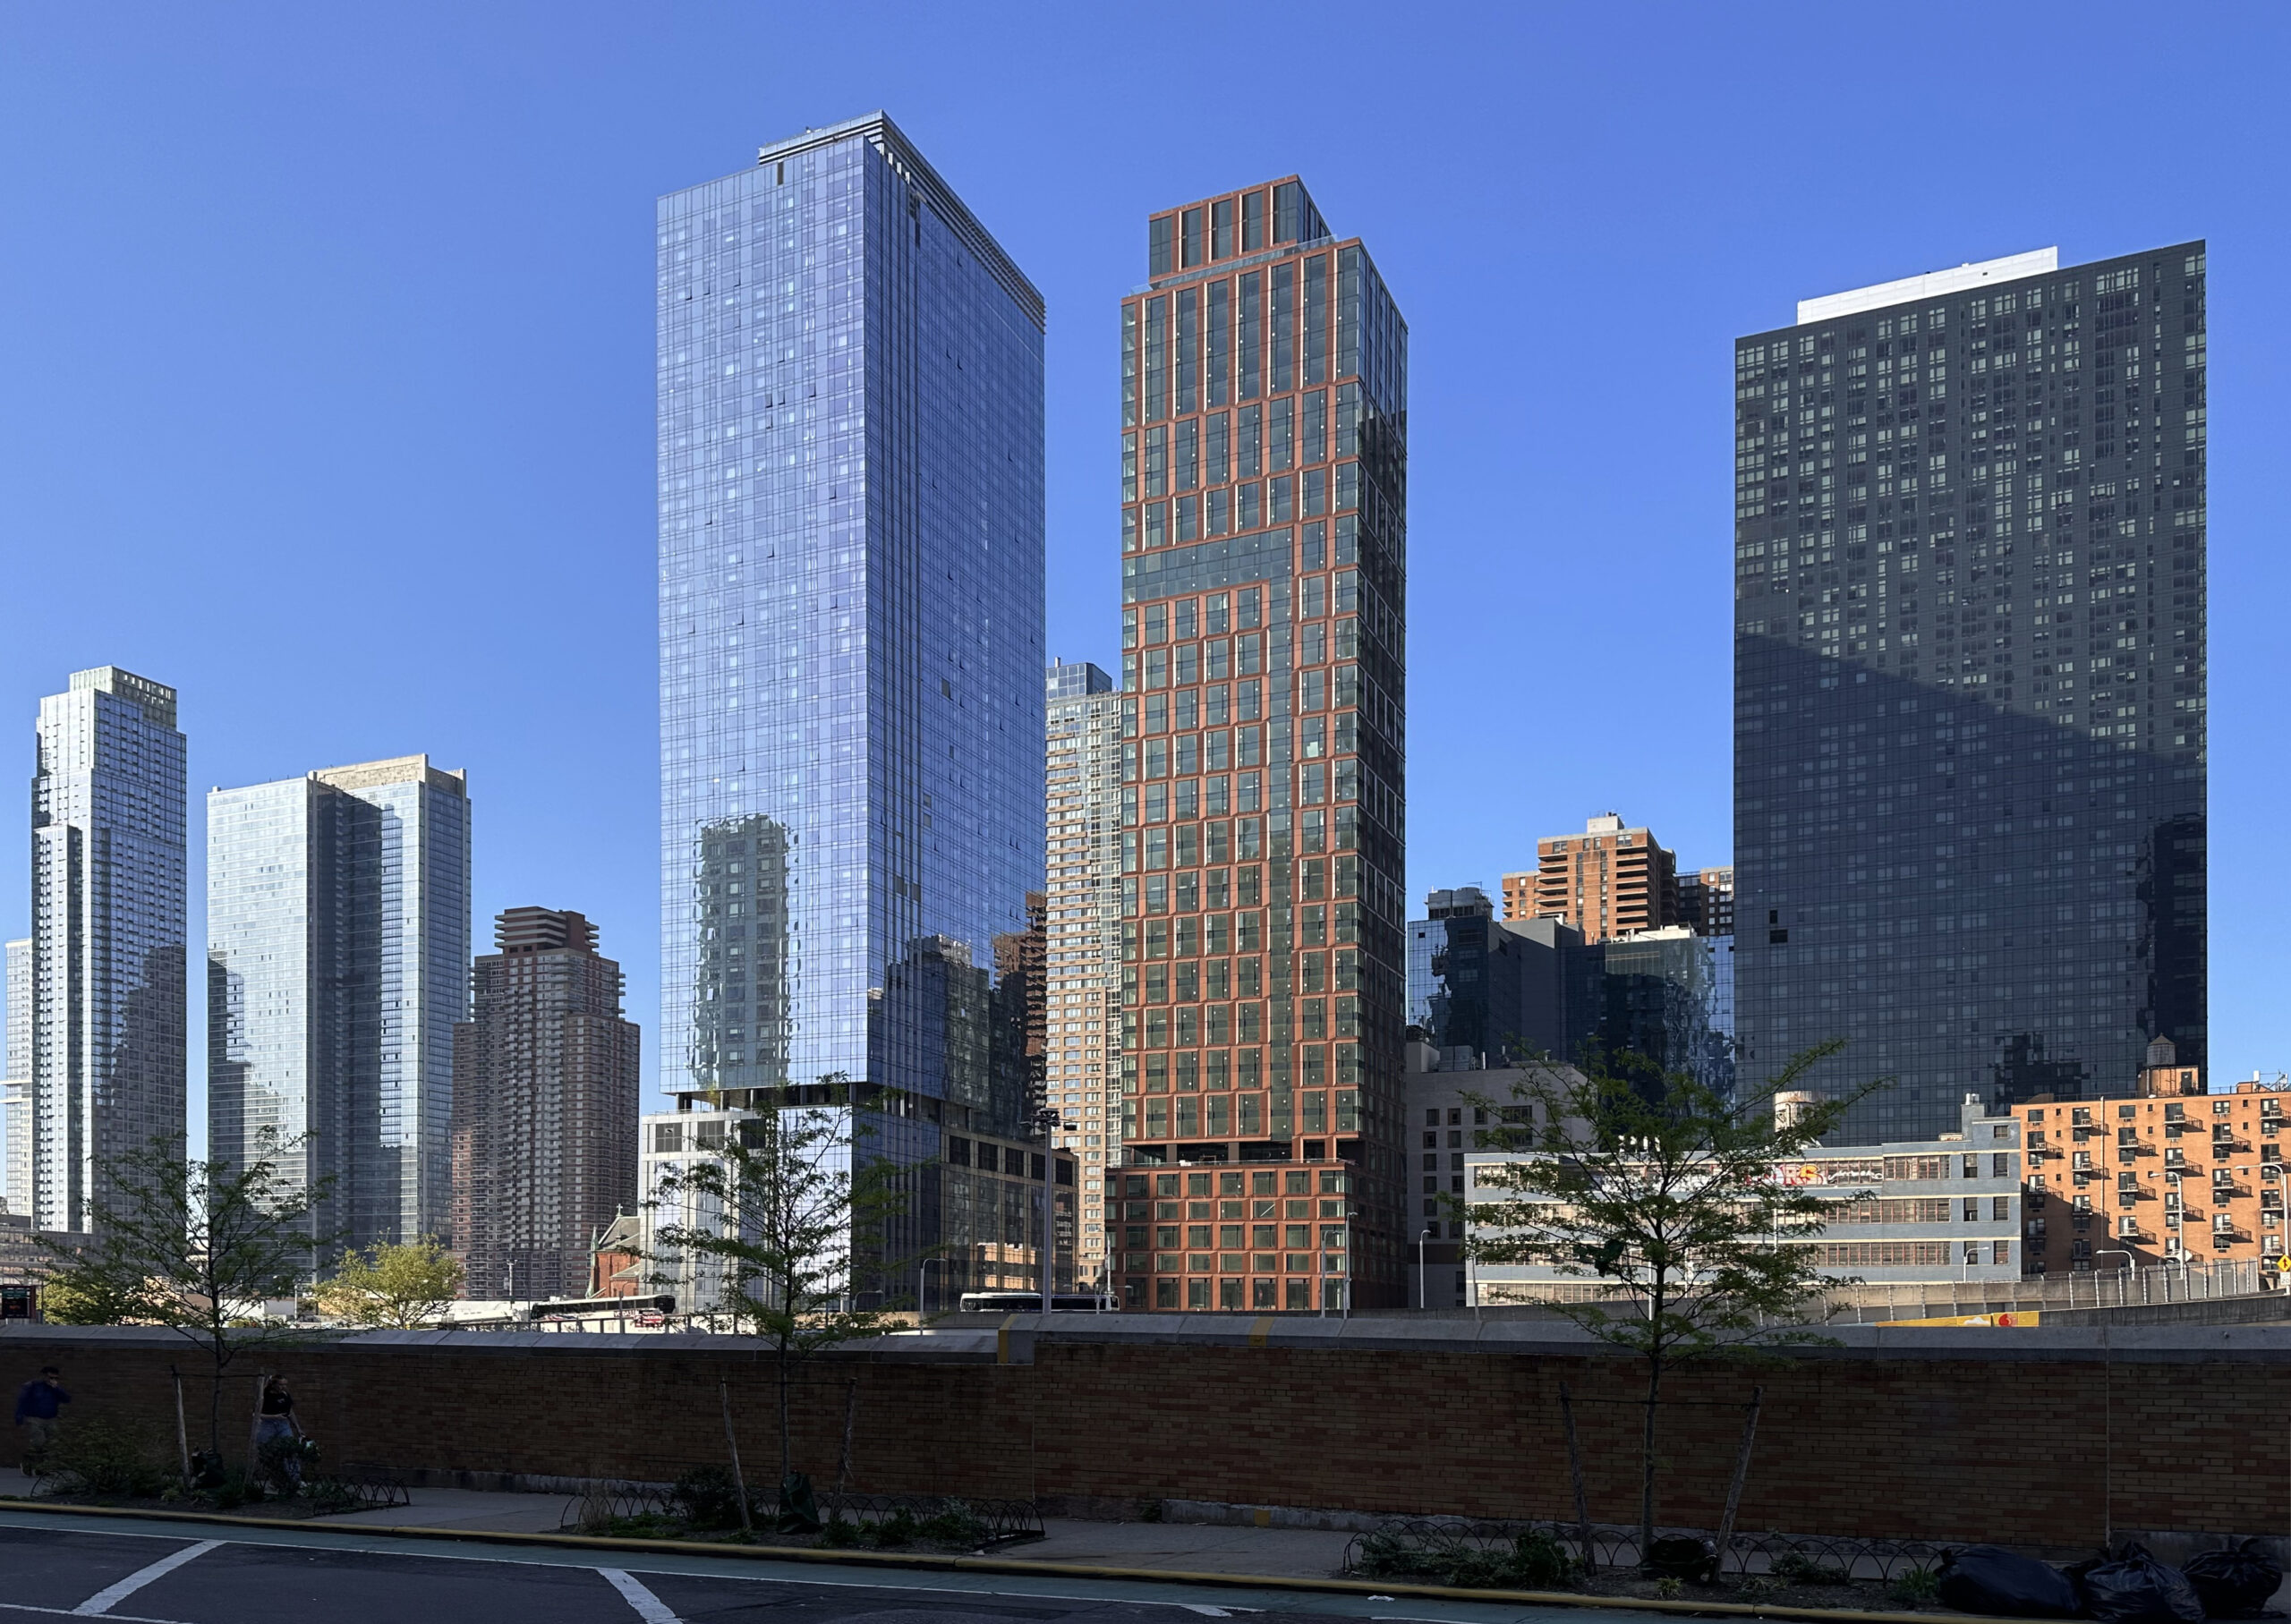
Photo by Michael Young
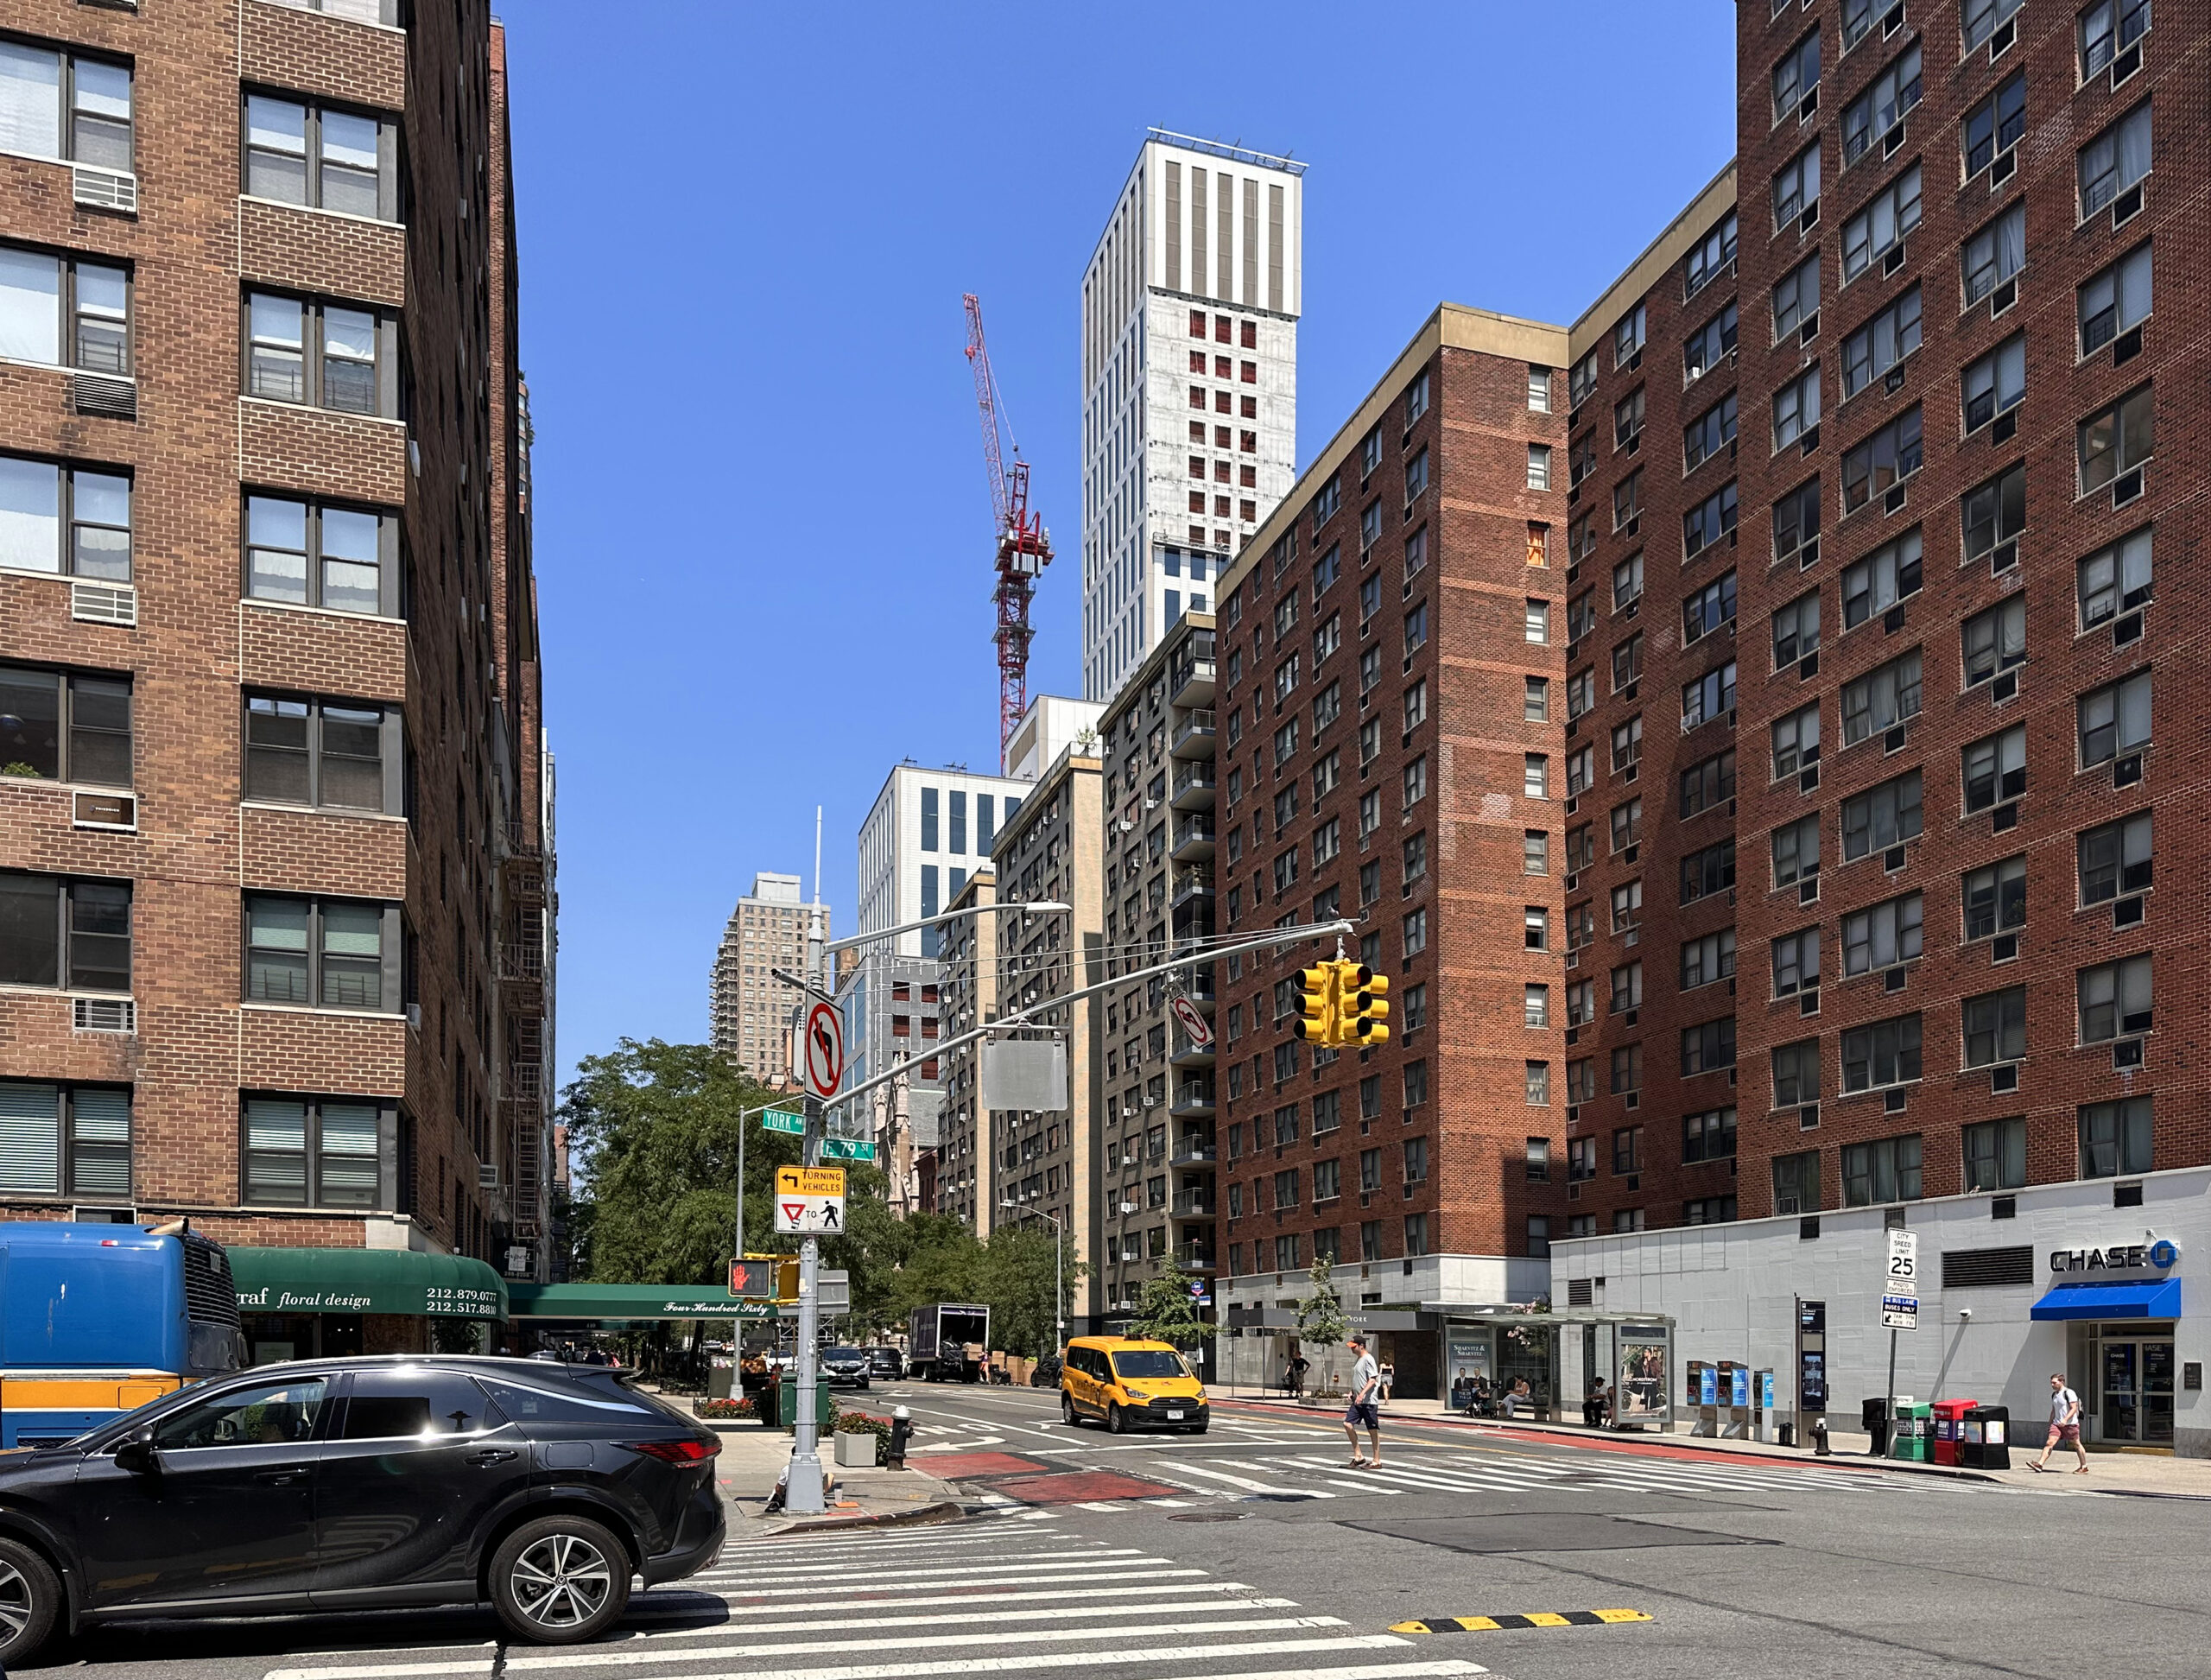
Photo by Michael Young
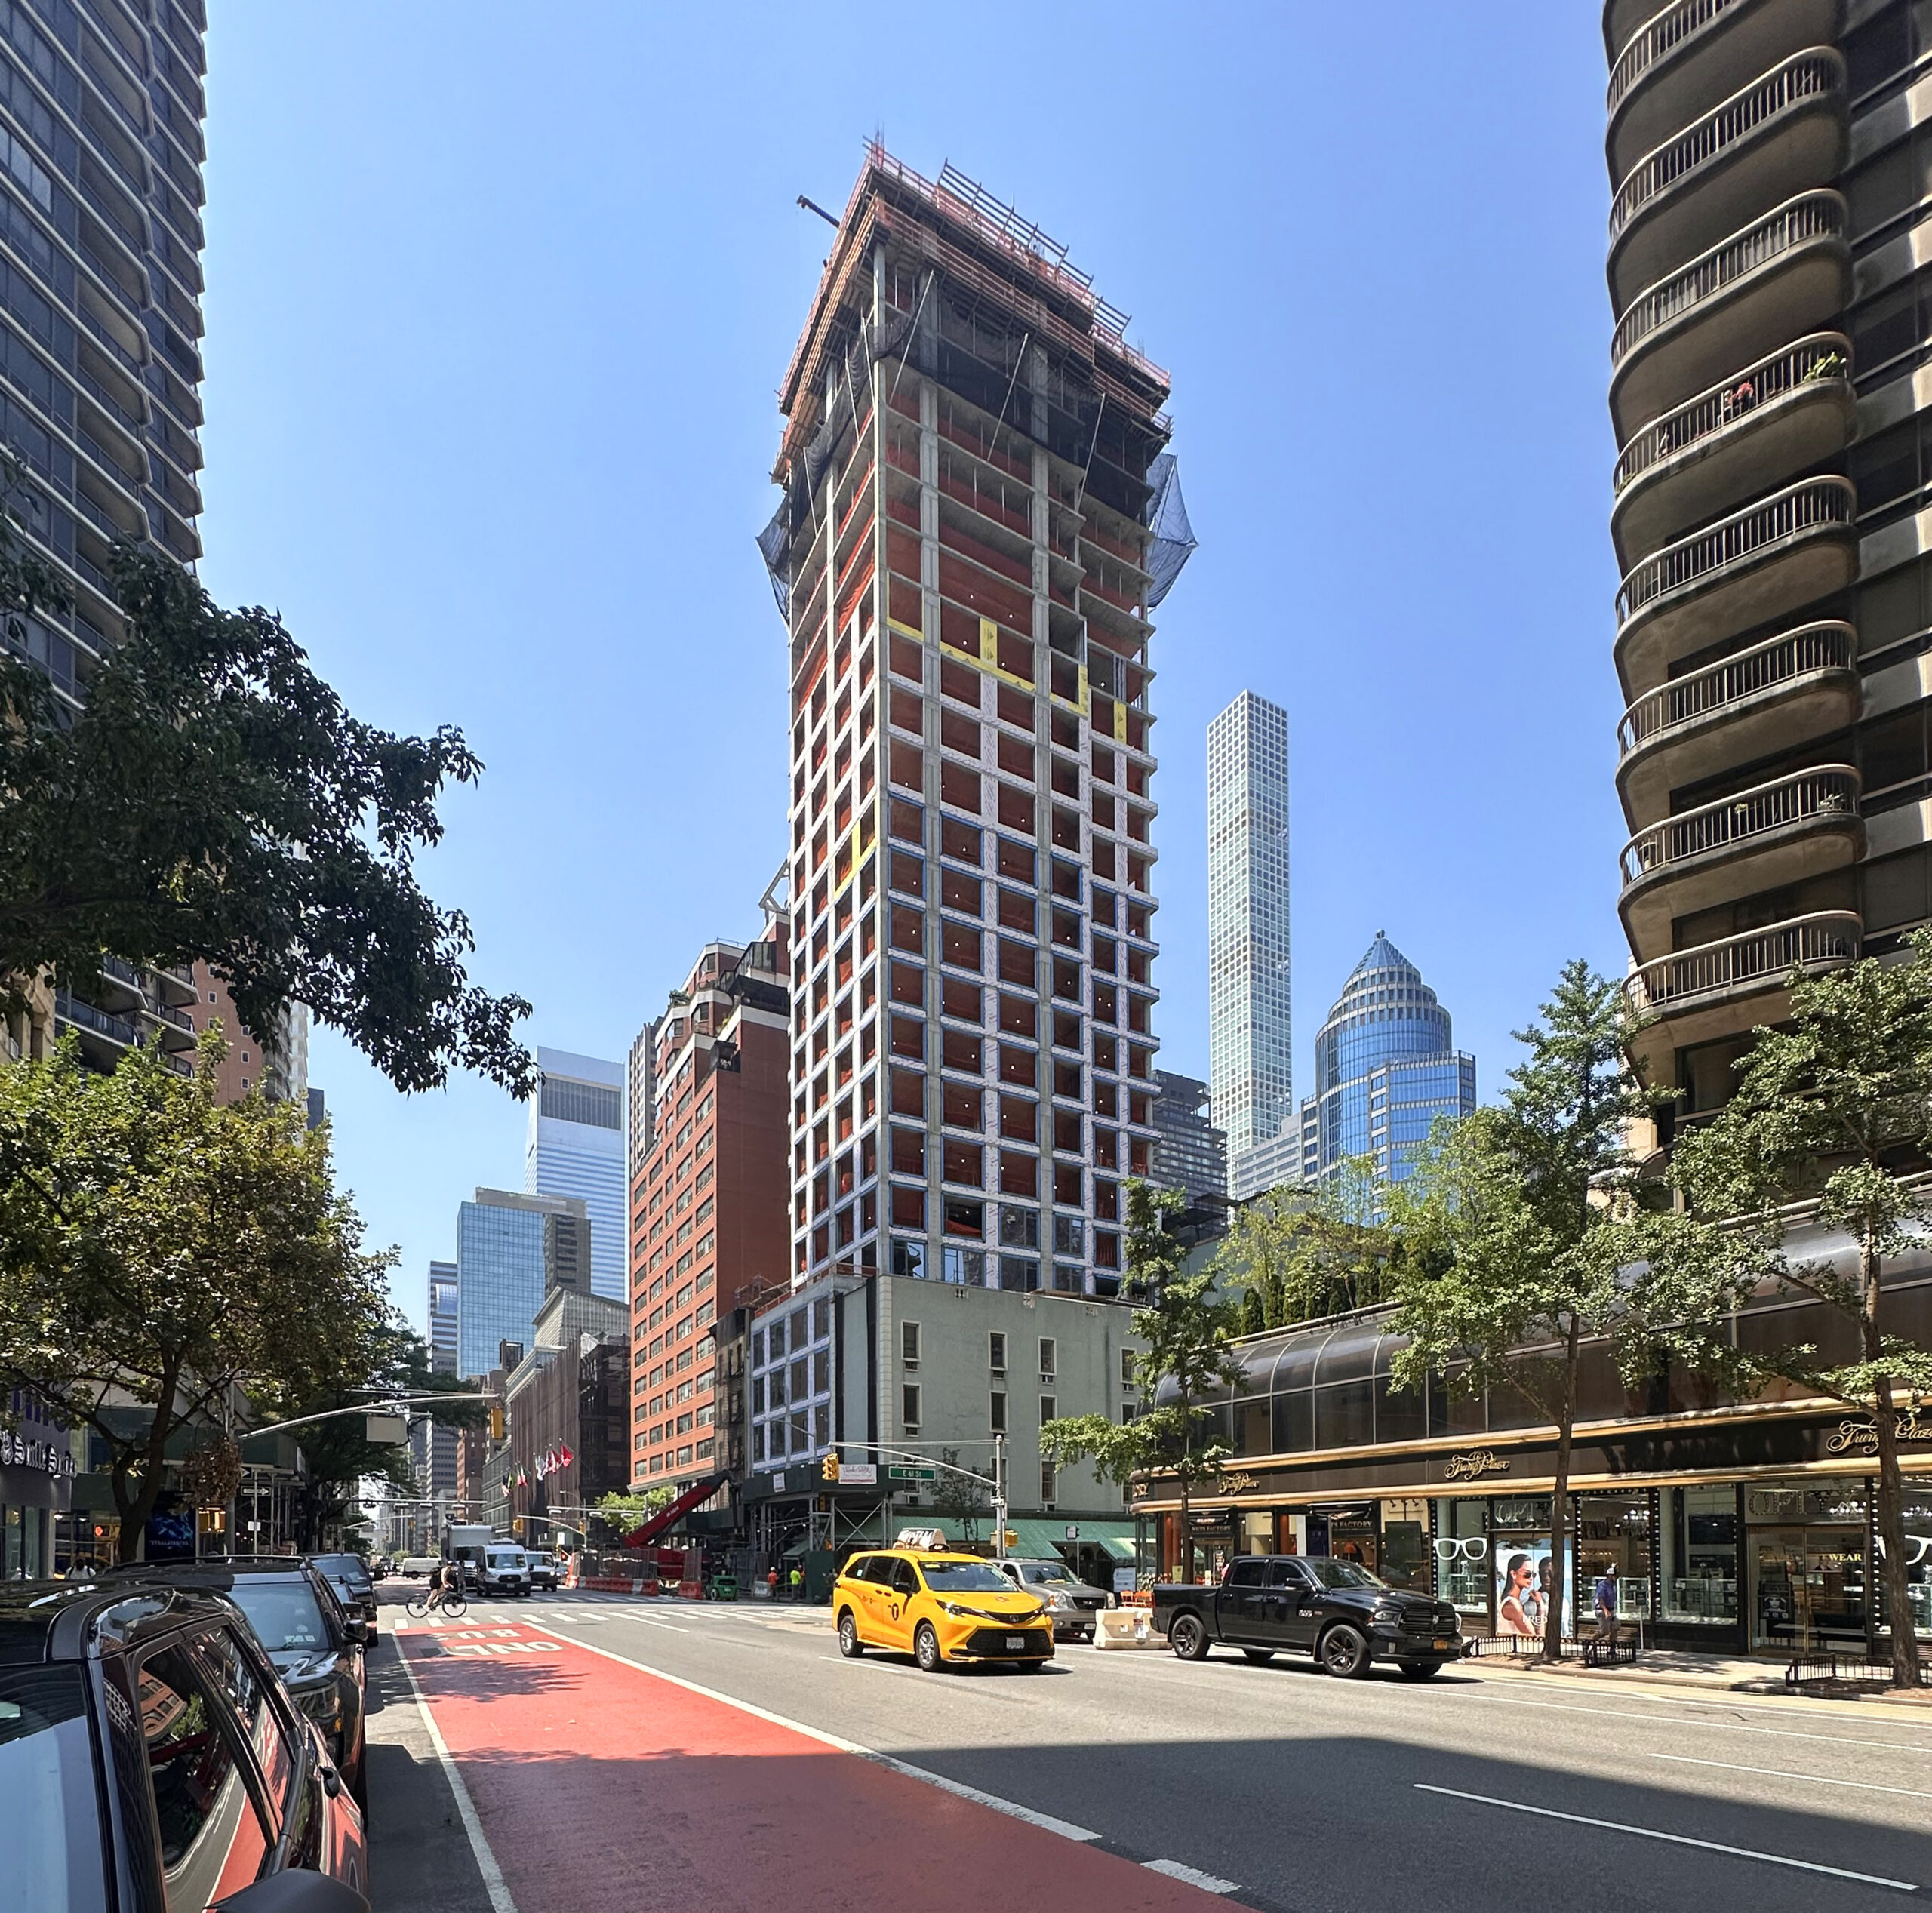
Photo by Michael Young
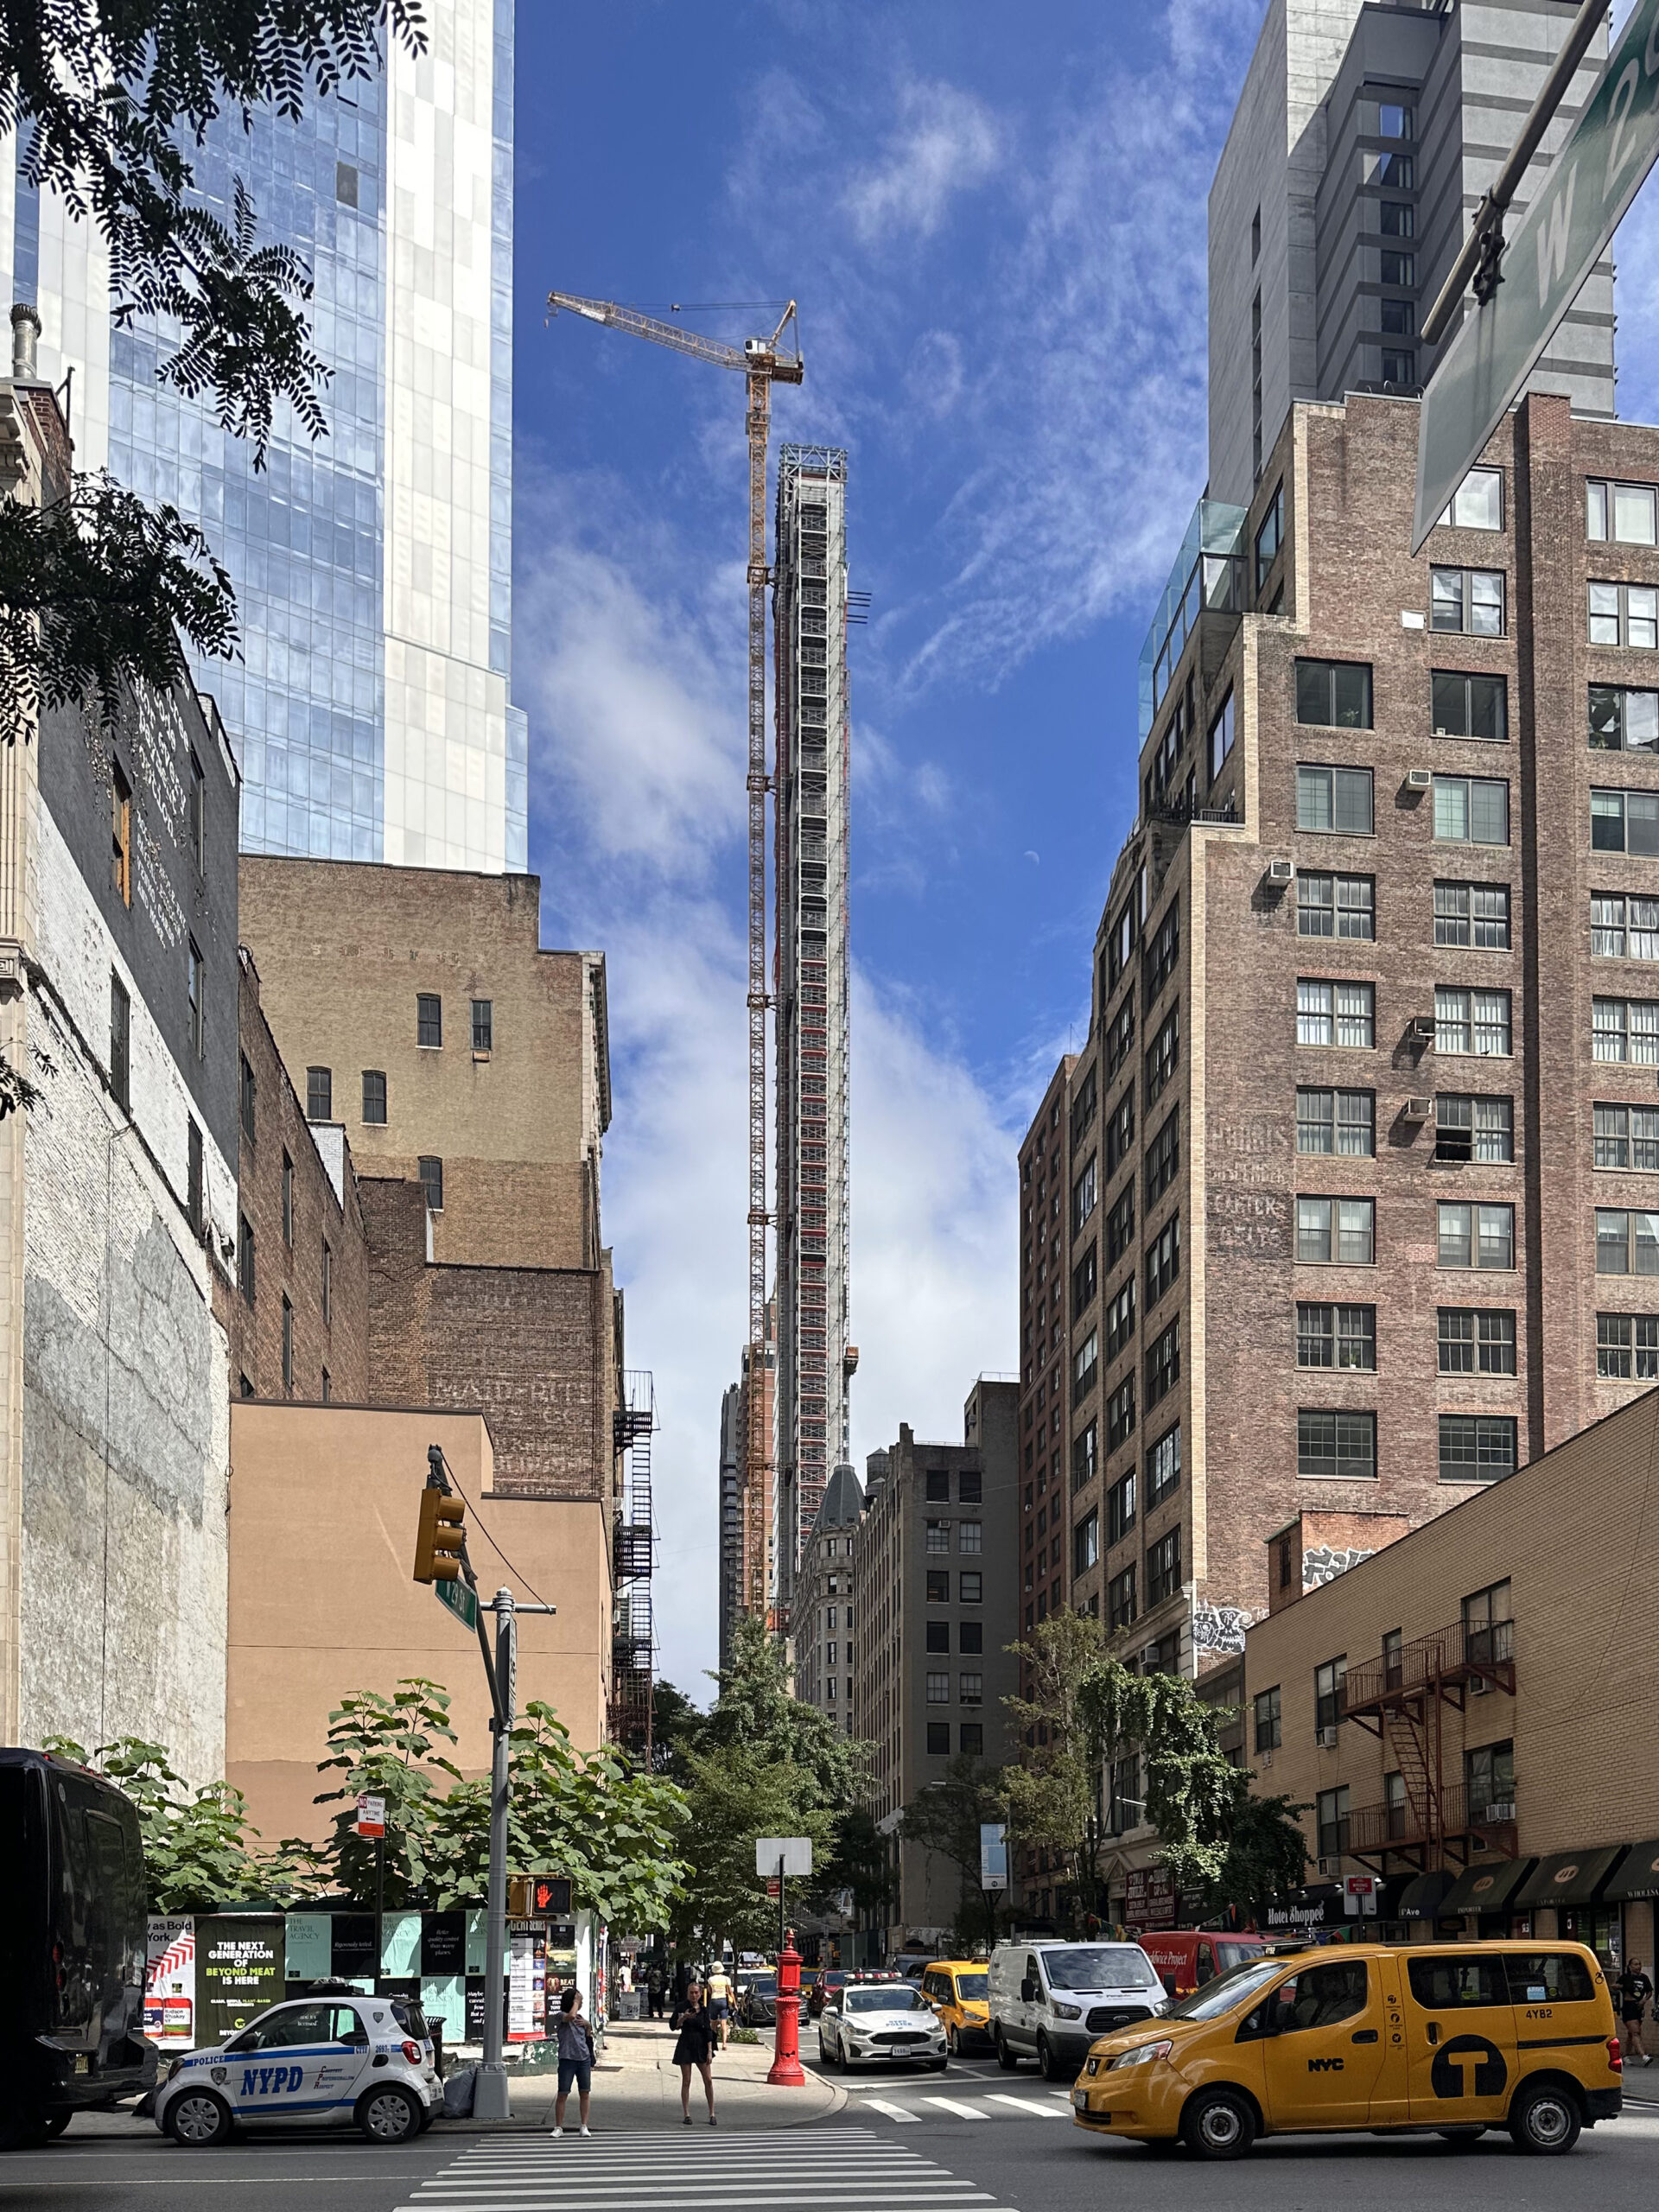
Photo by Michael Young
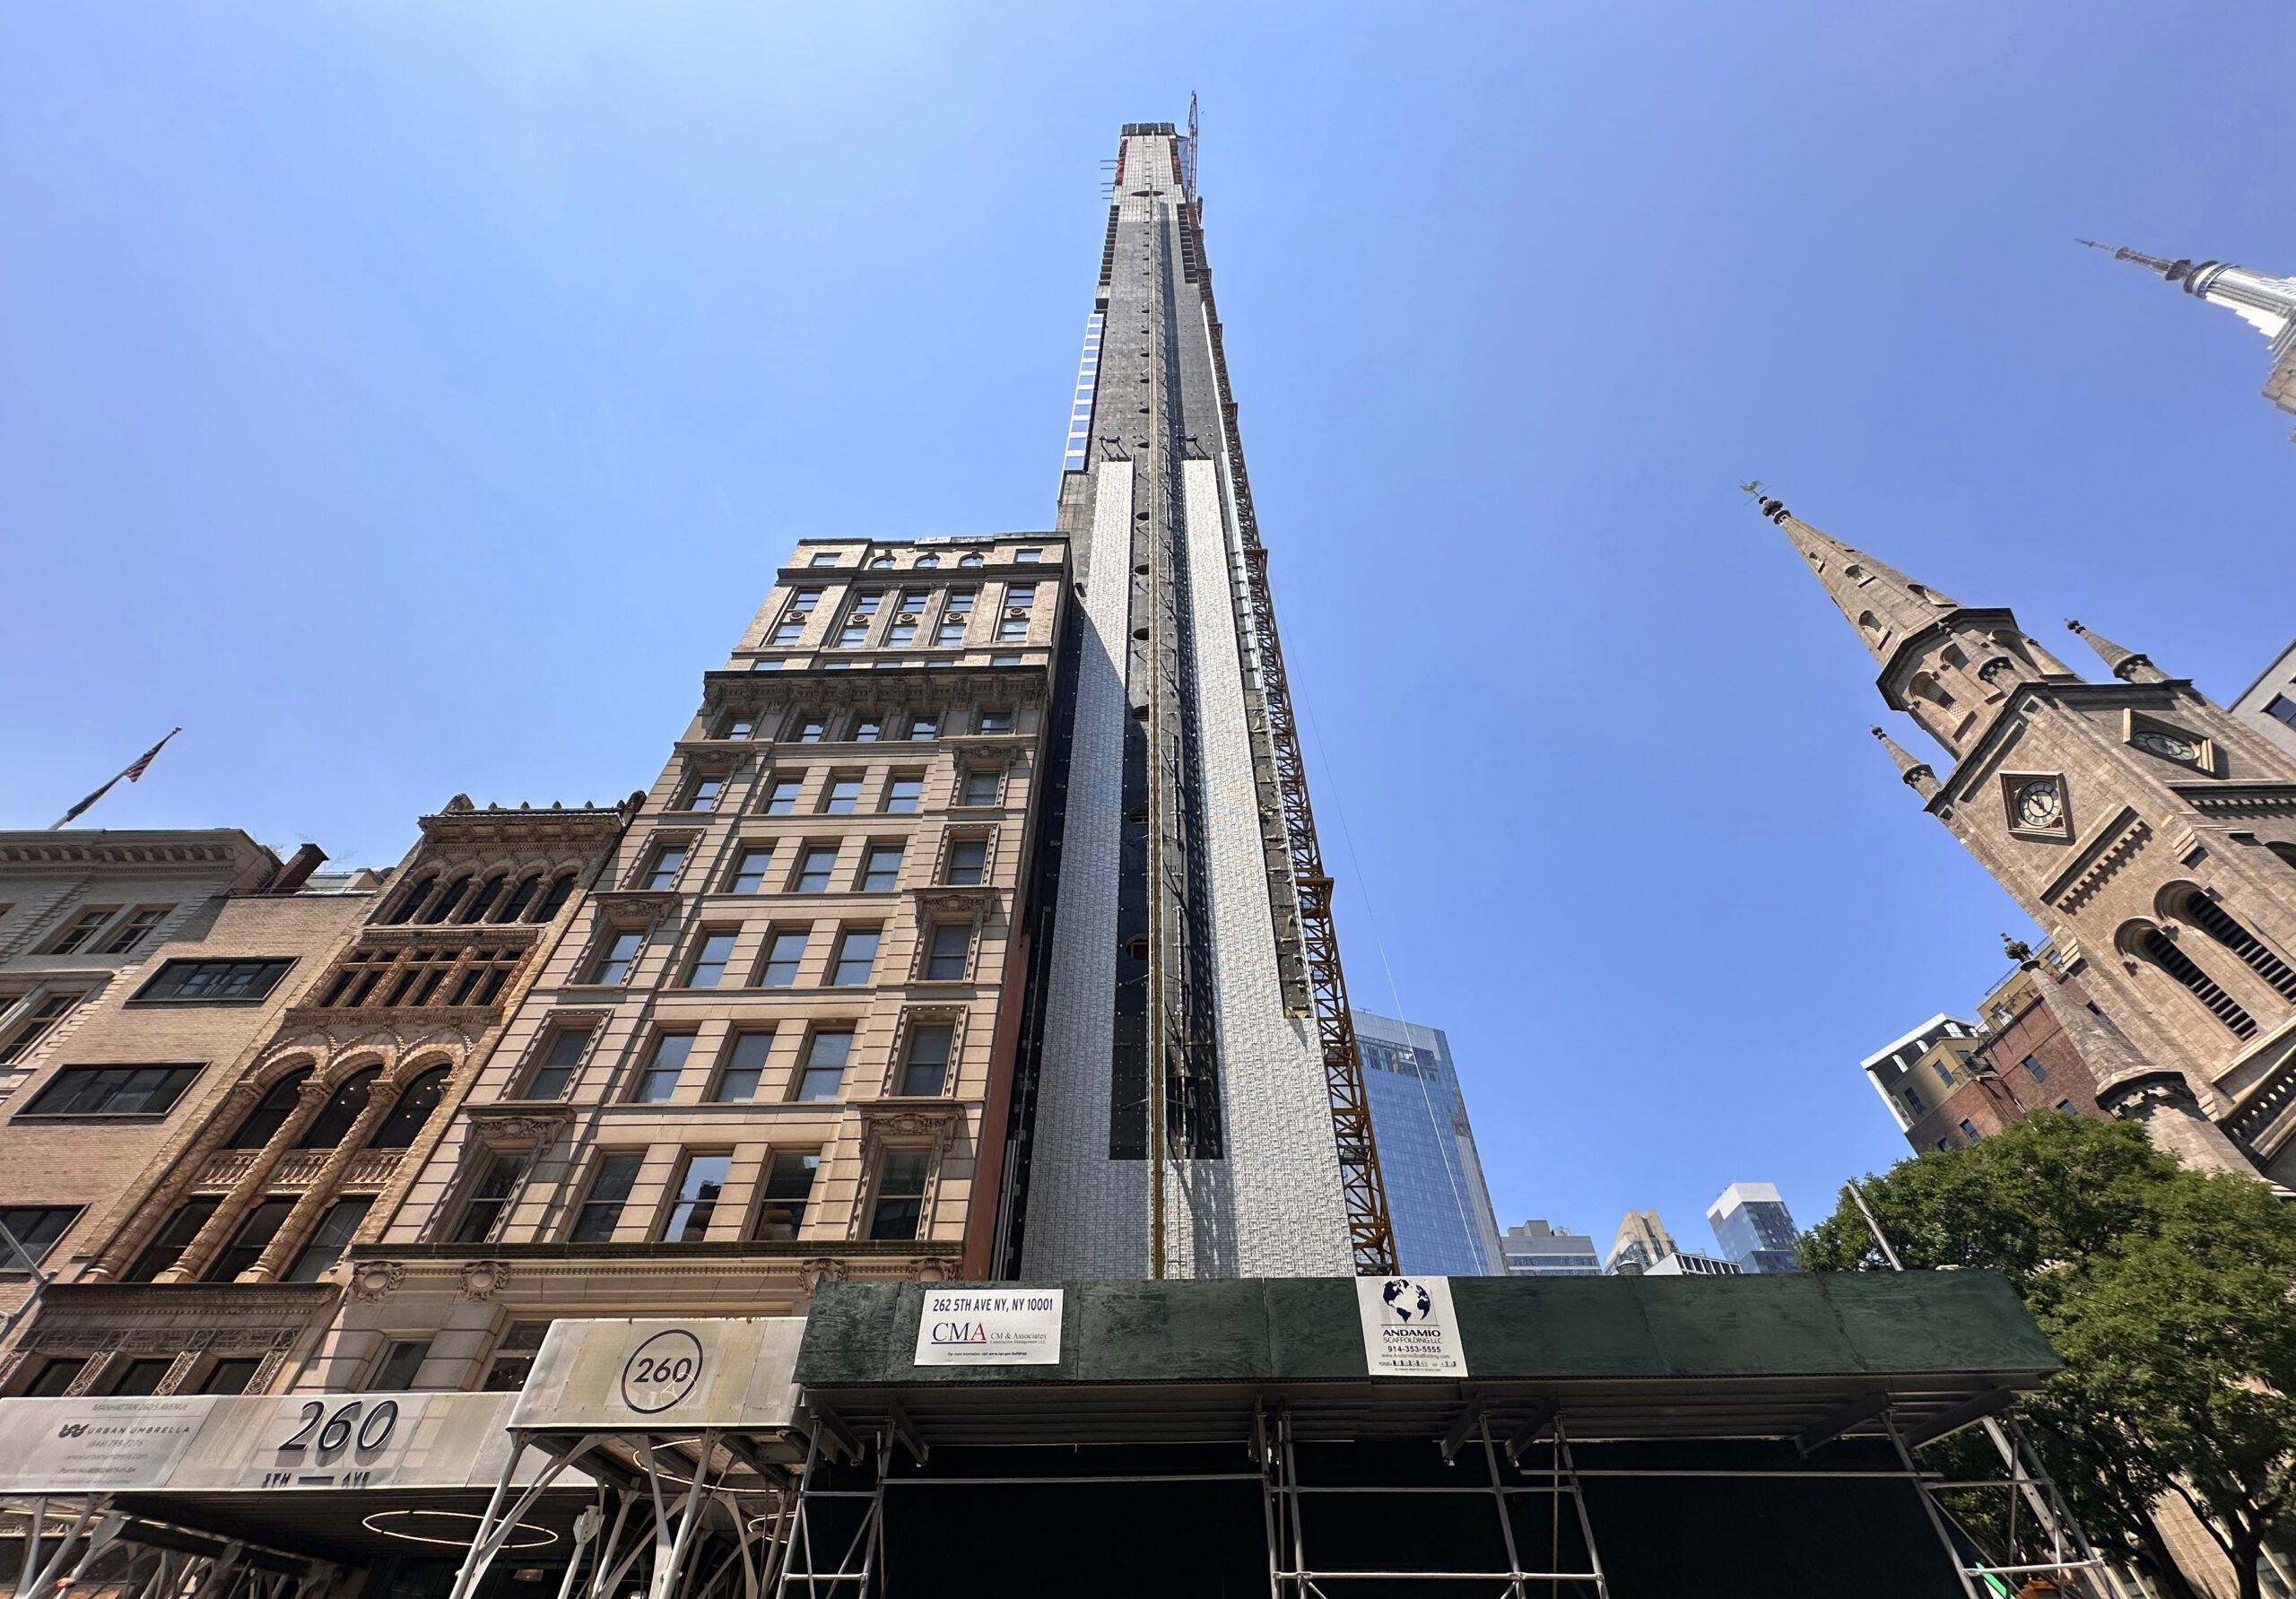
Photo by Michael Young
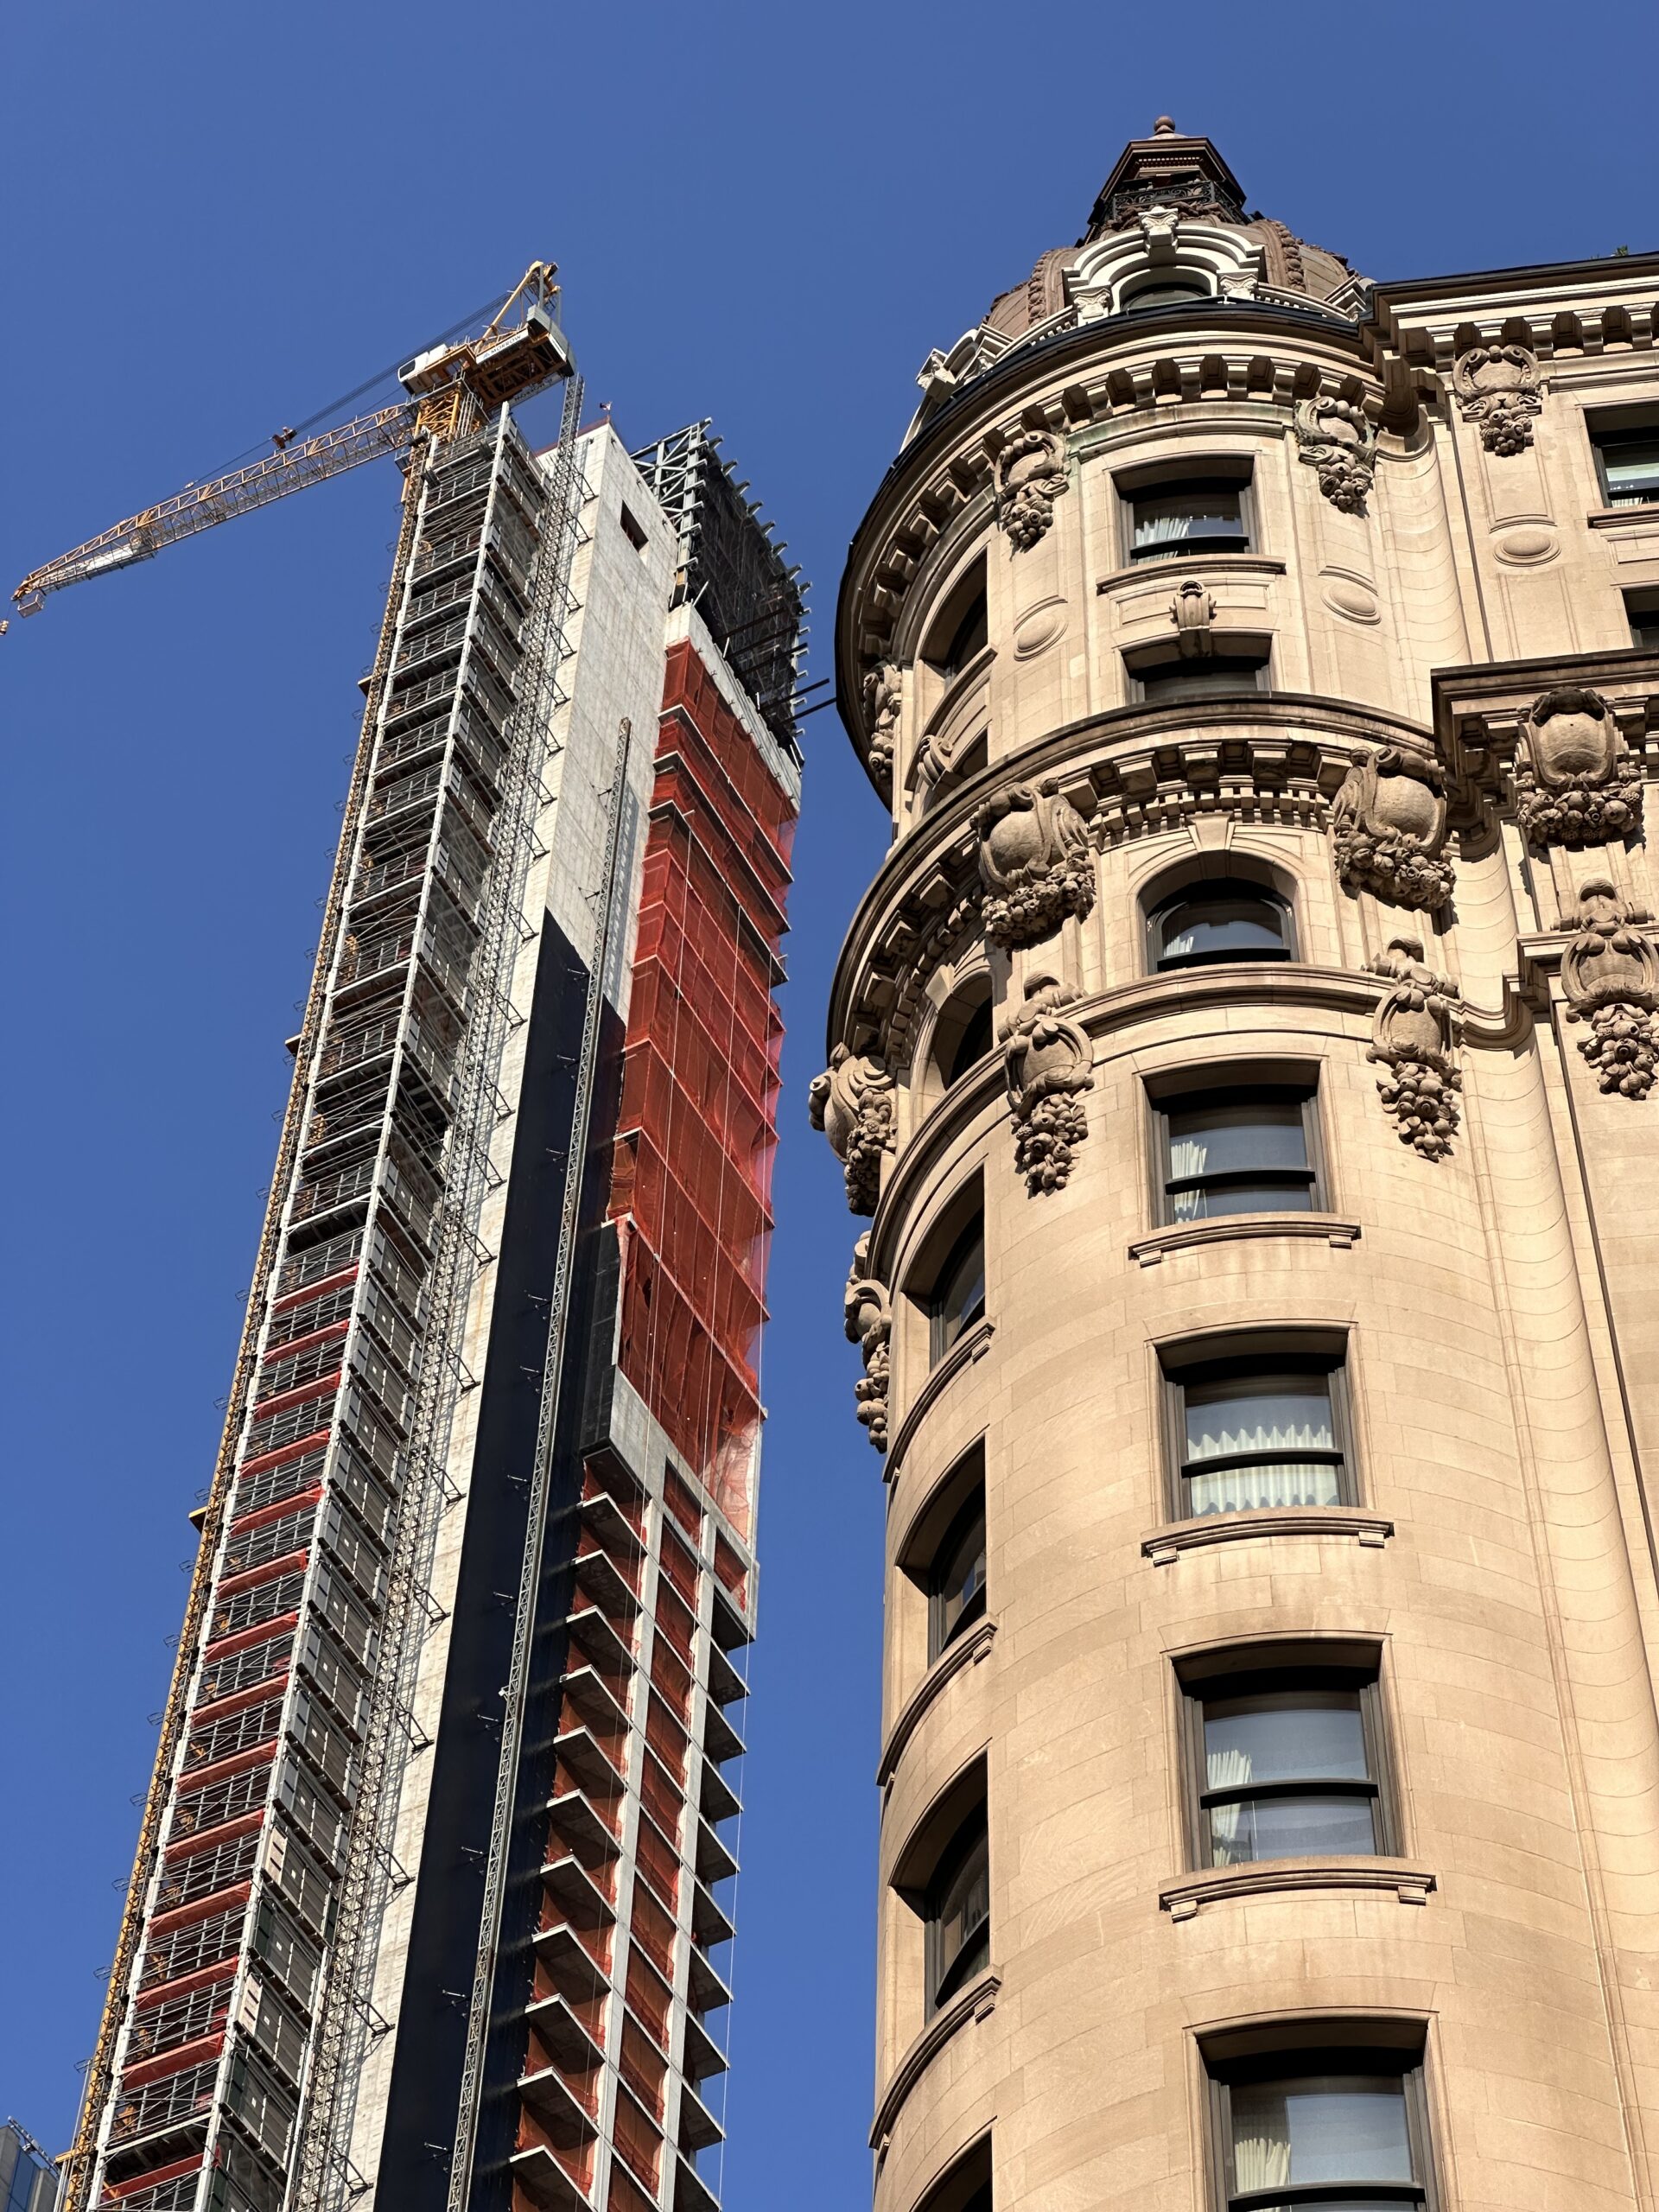
Photo by Michael Young
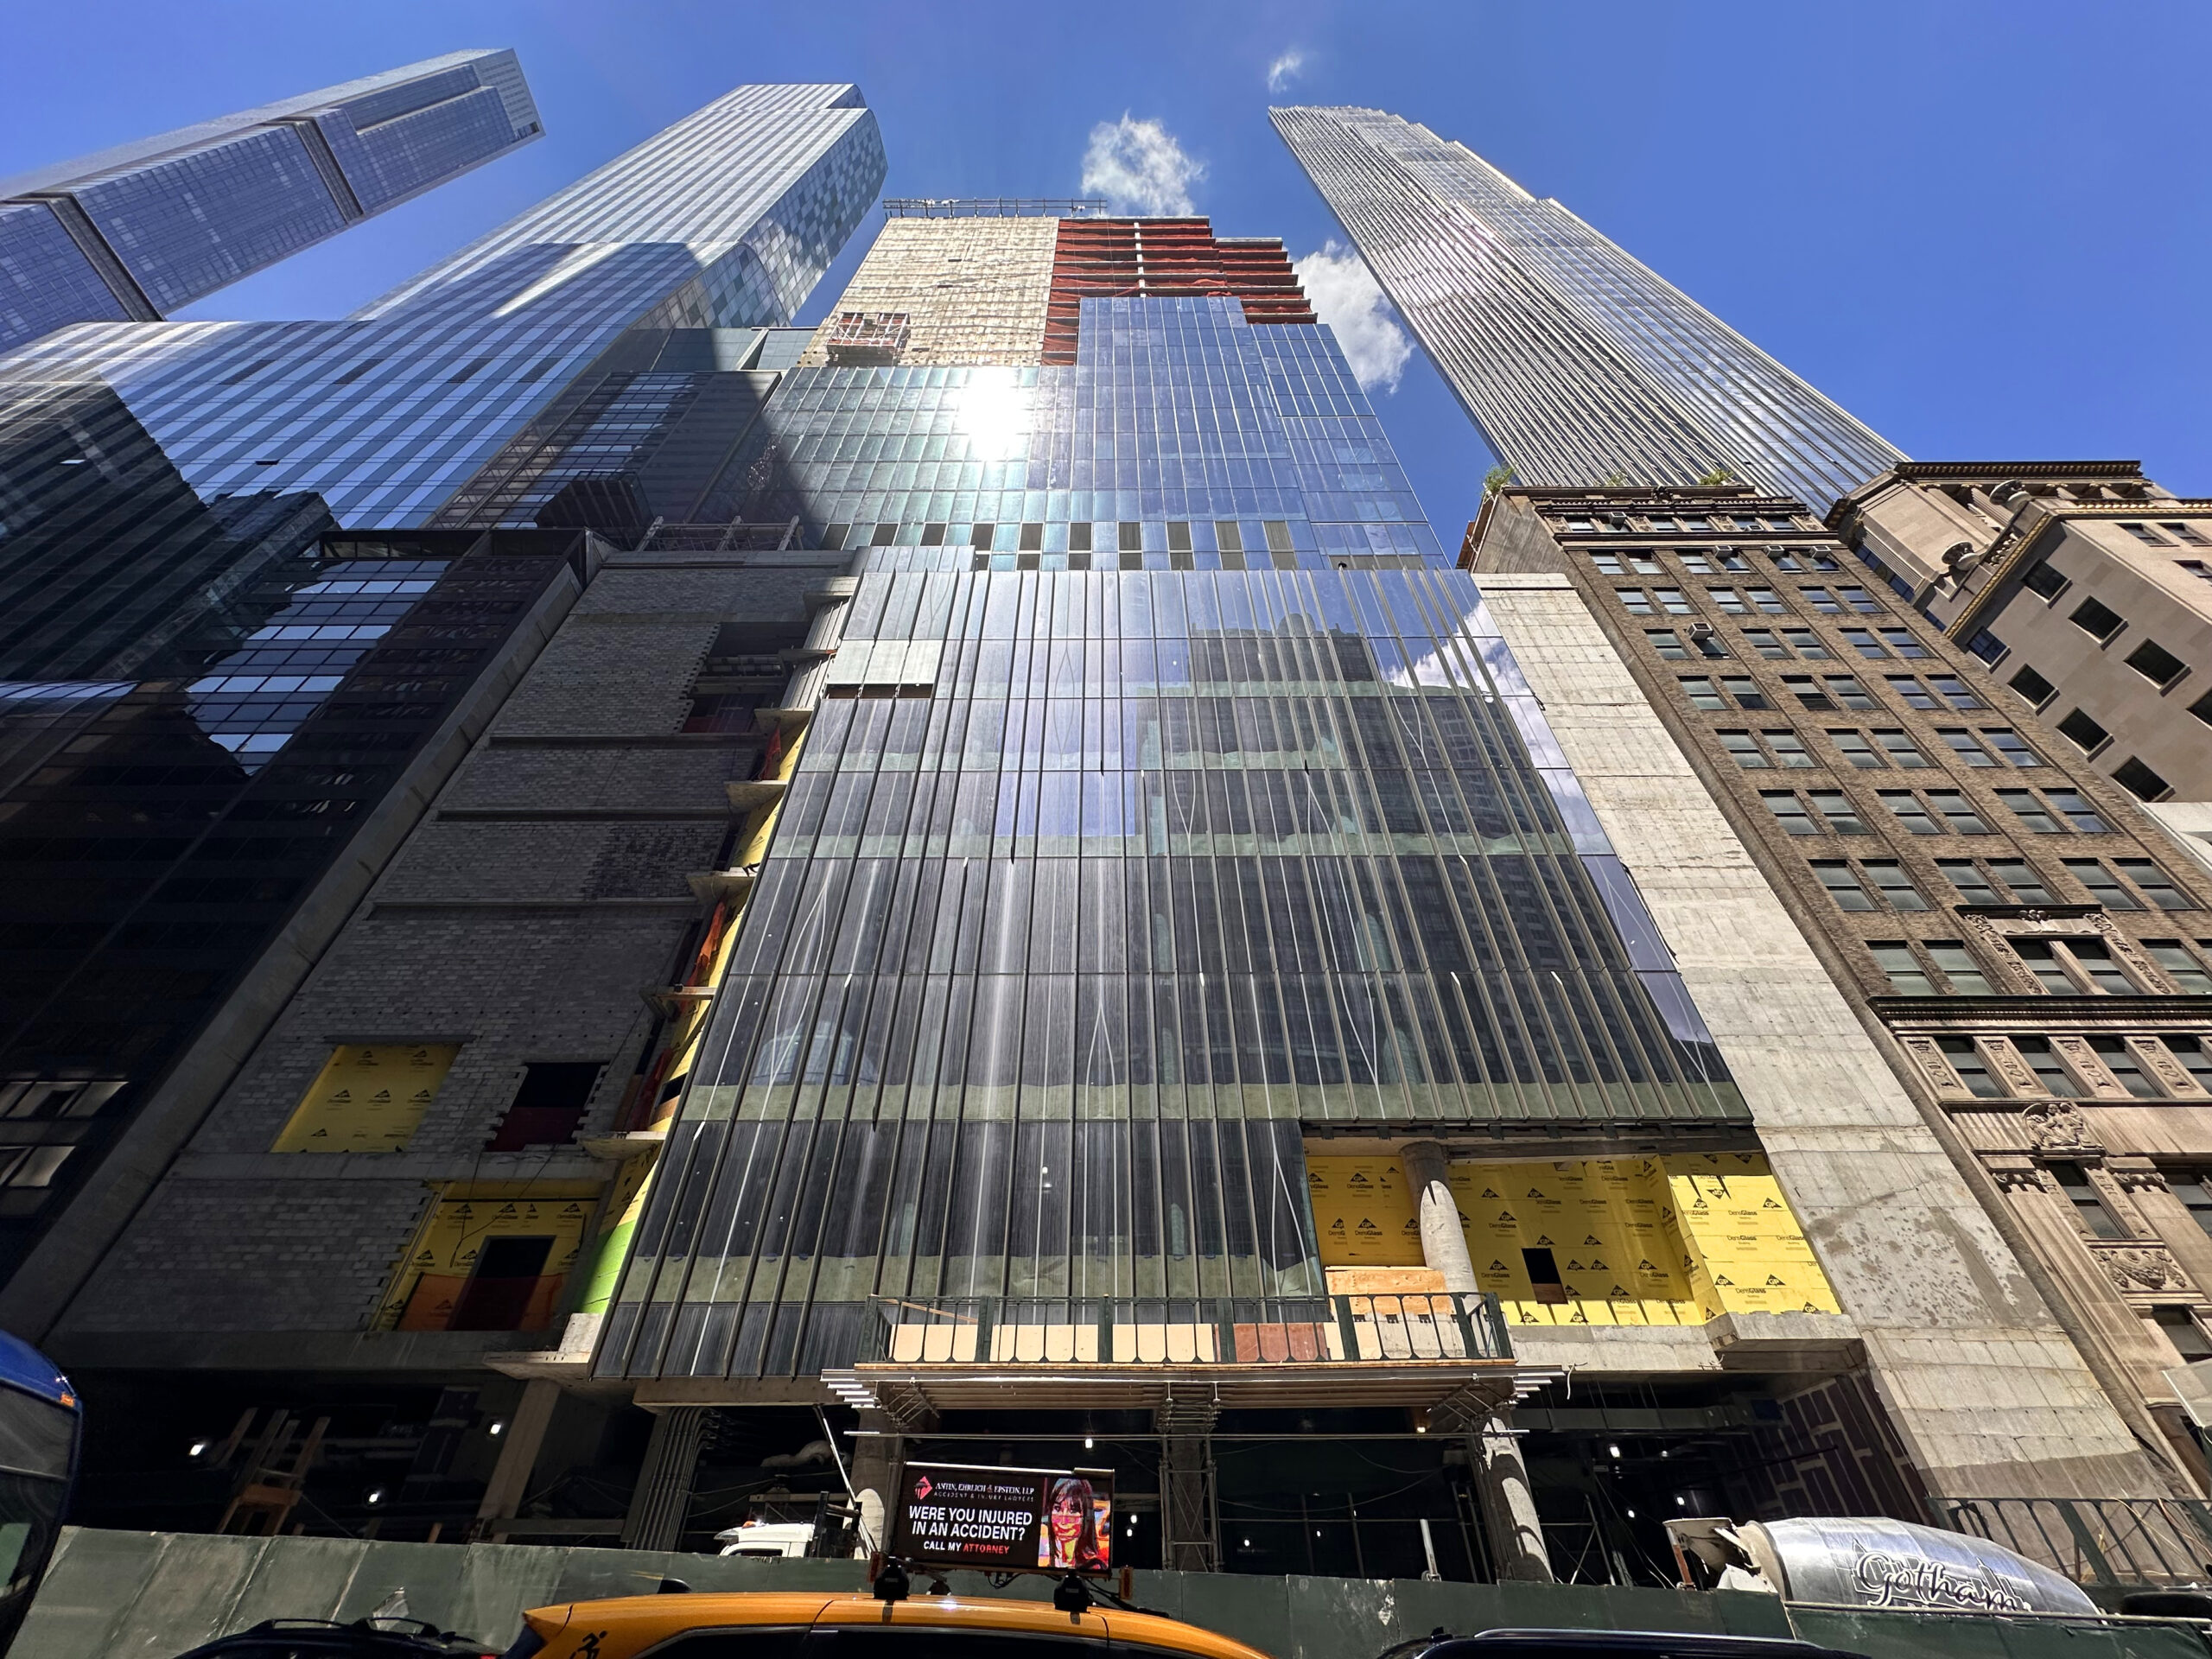
Photo by Michael Young
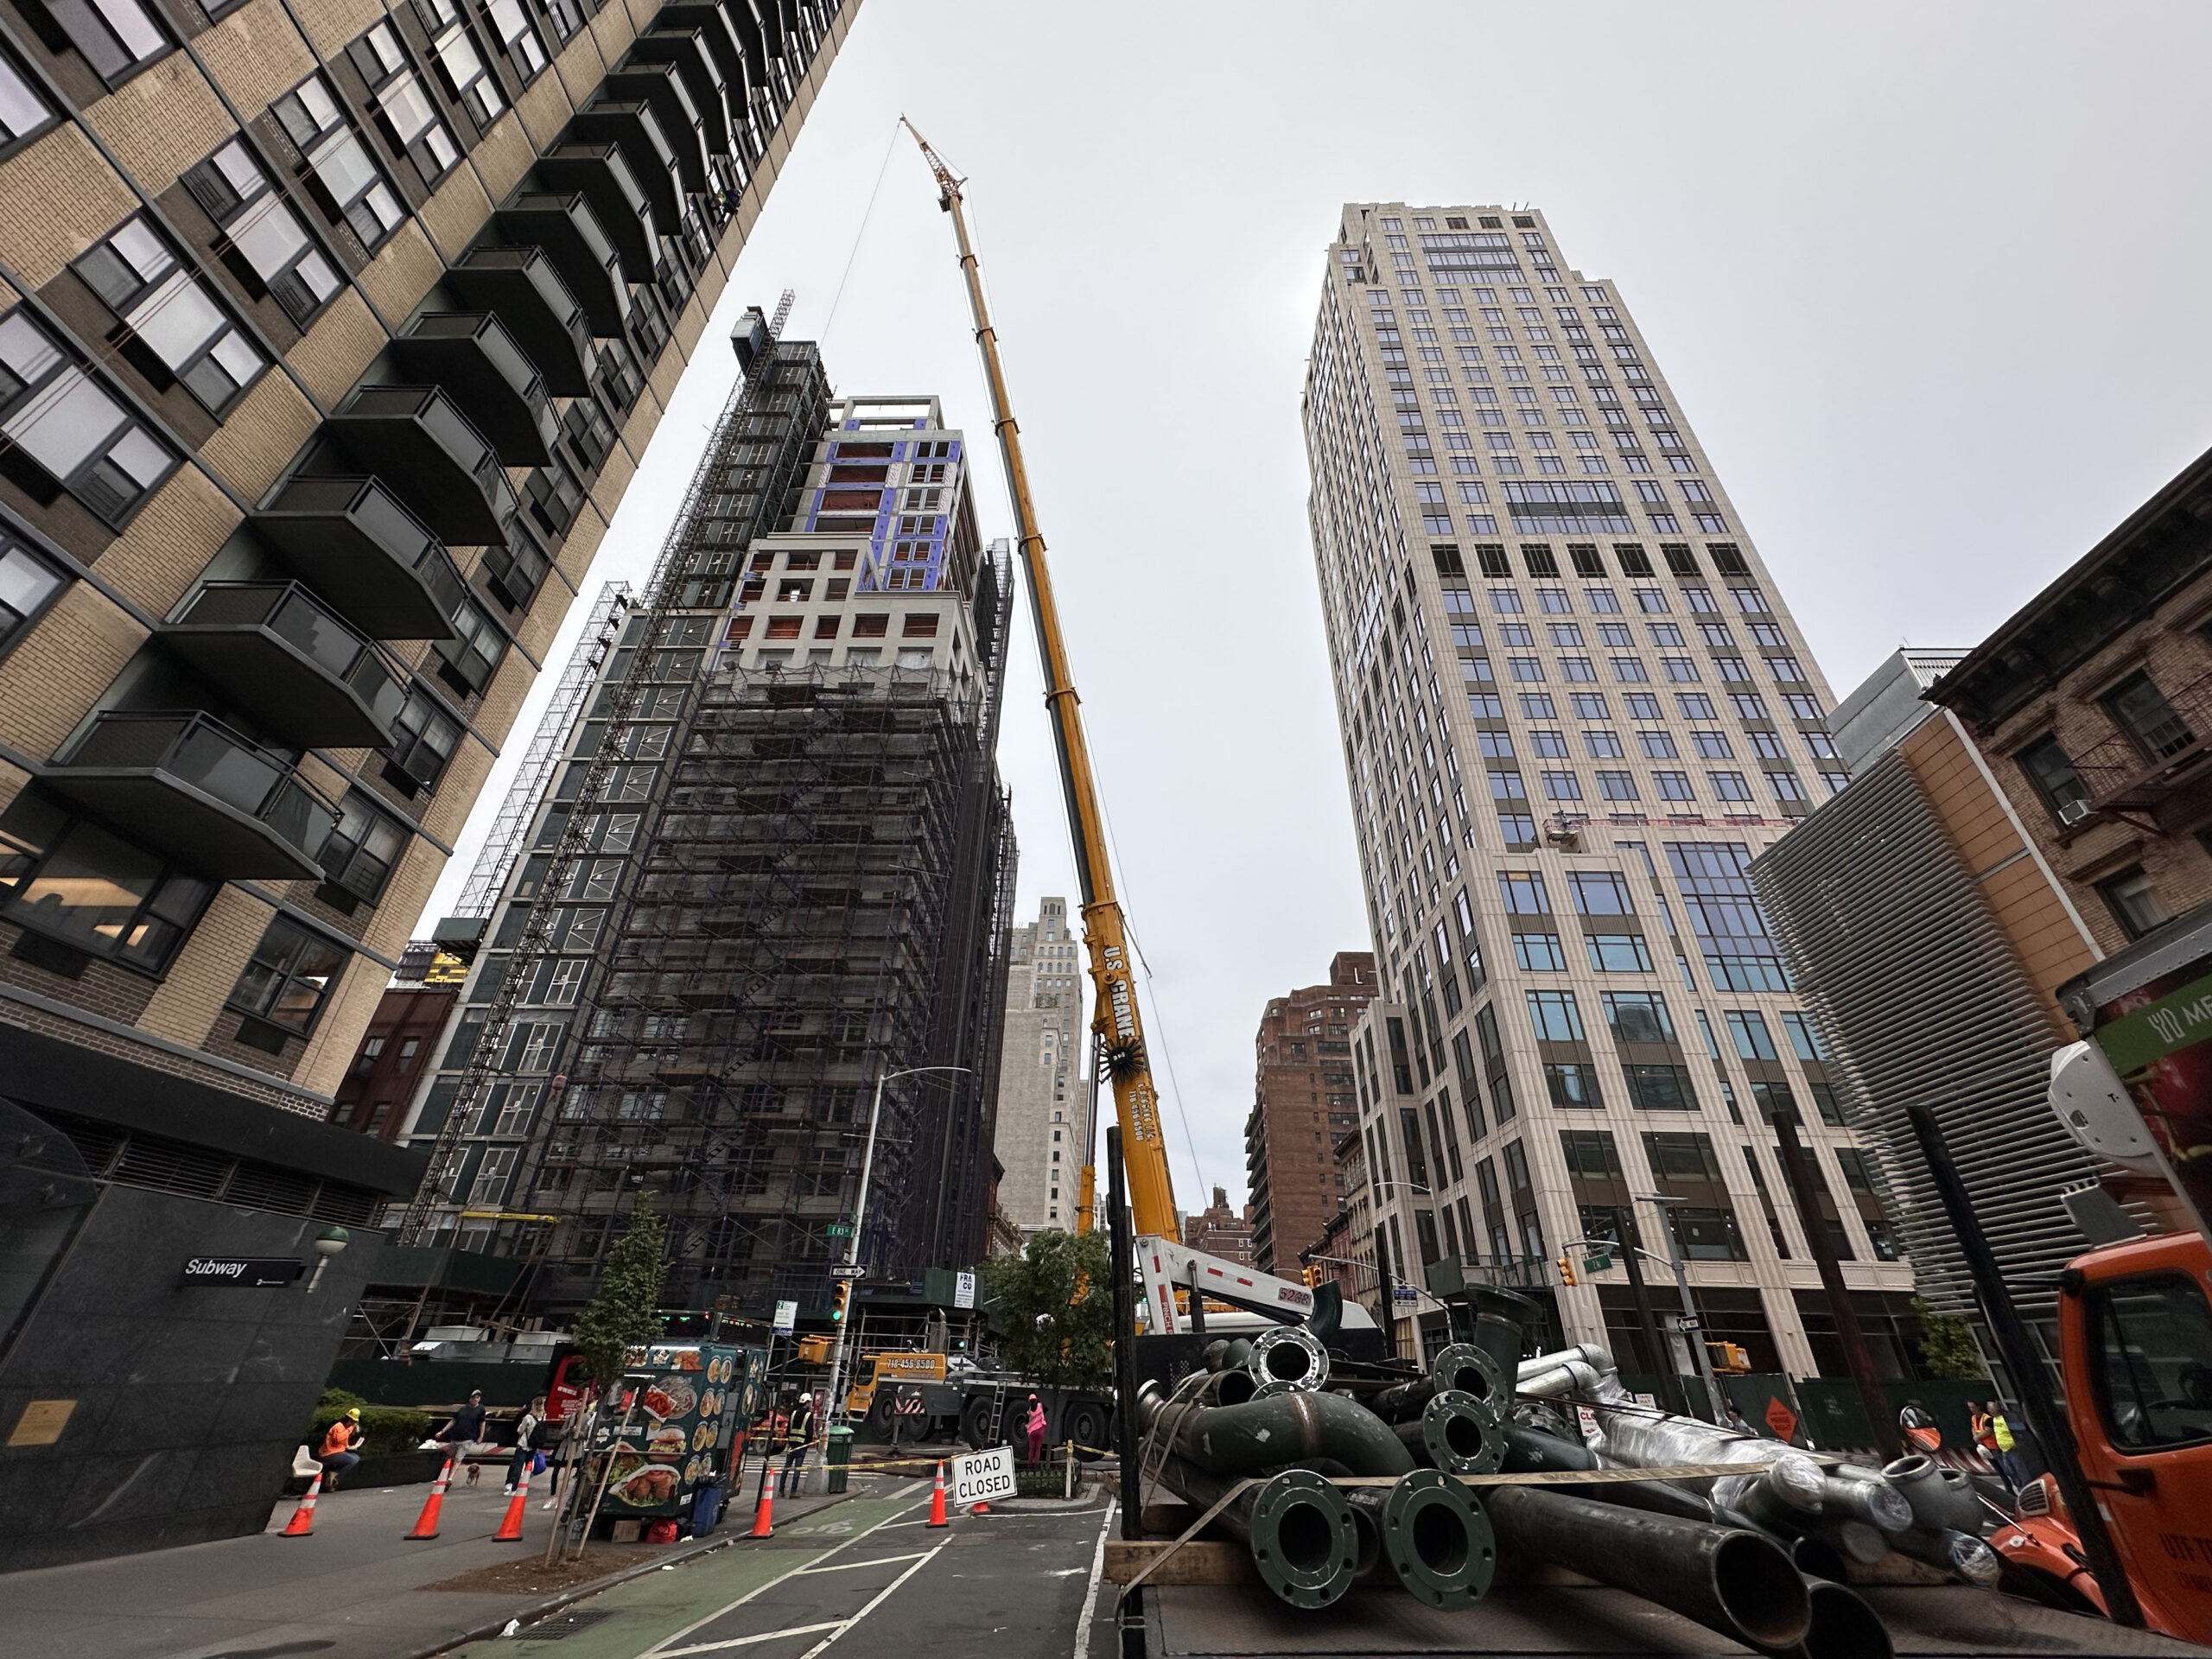
Photo by Michael Young
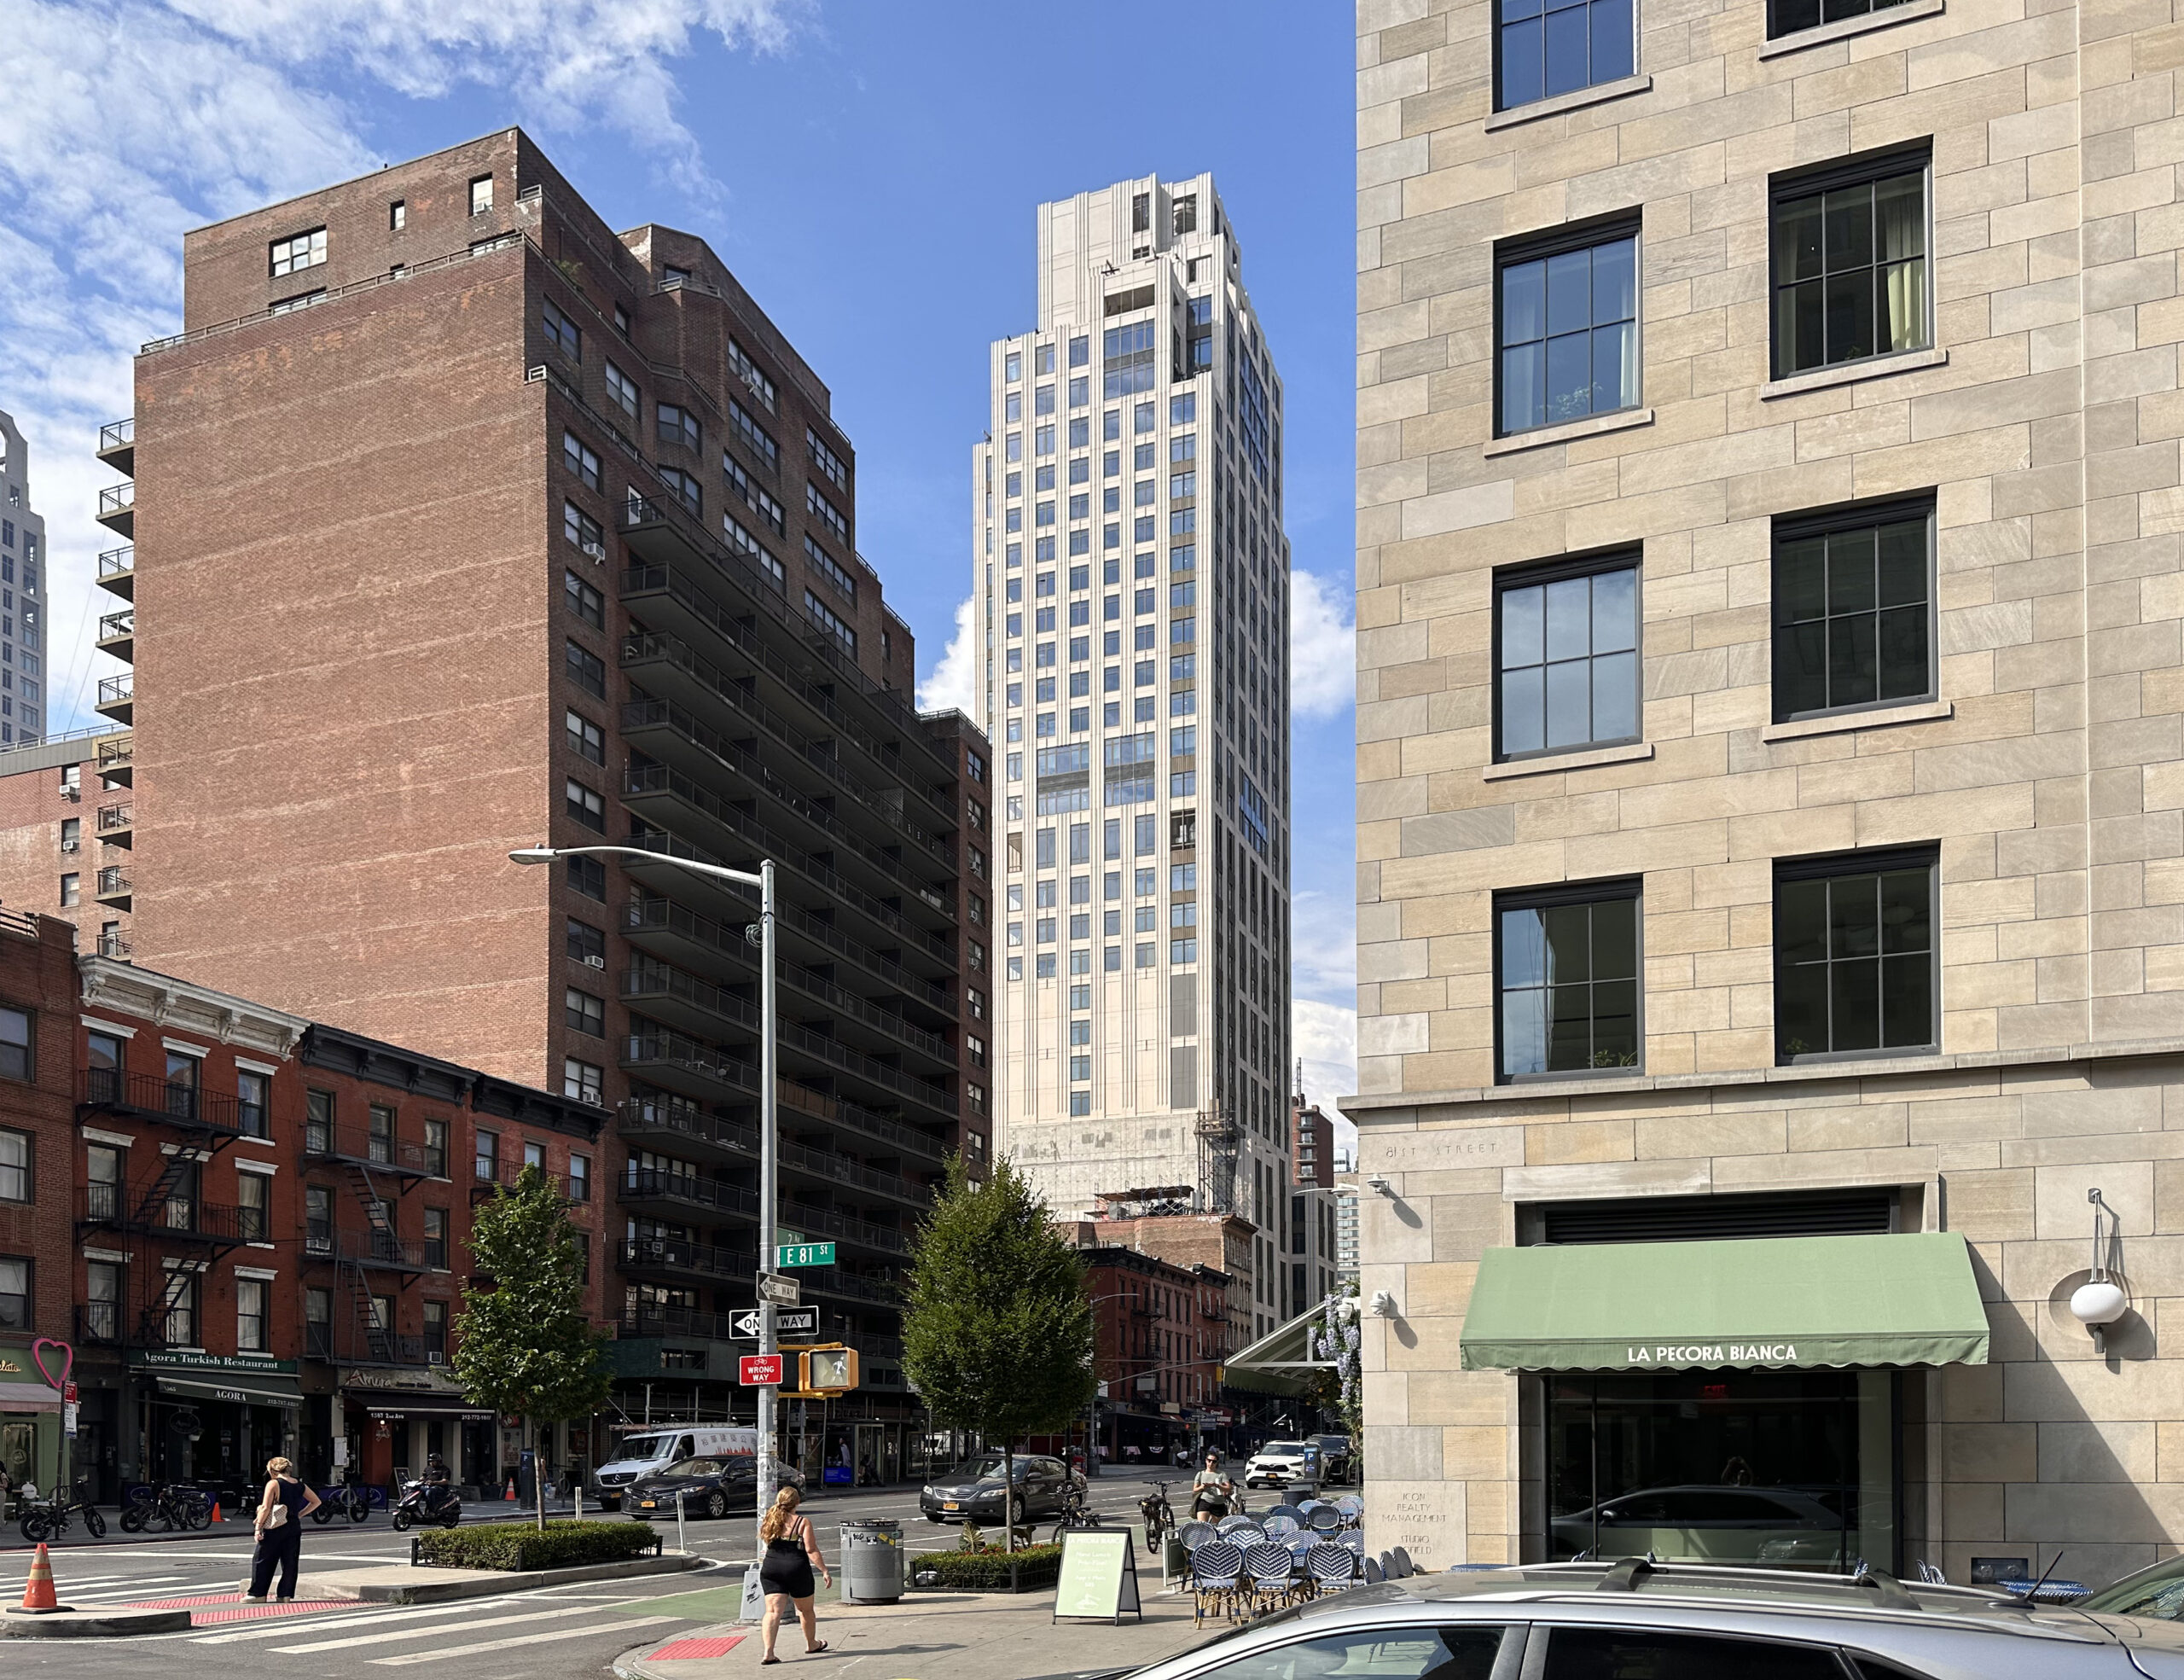
Photo by Michael Young
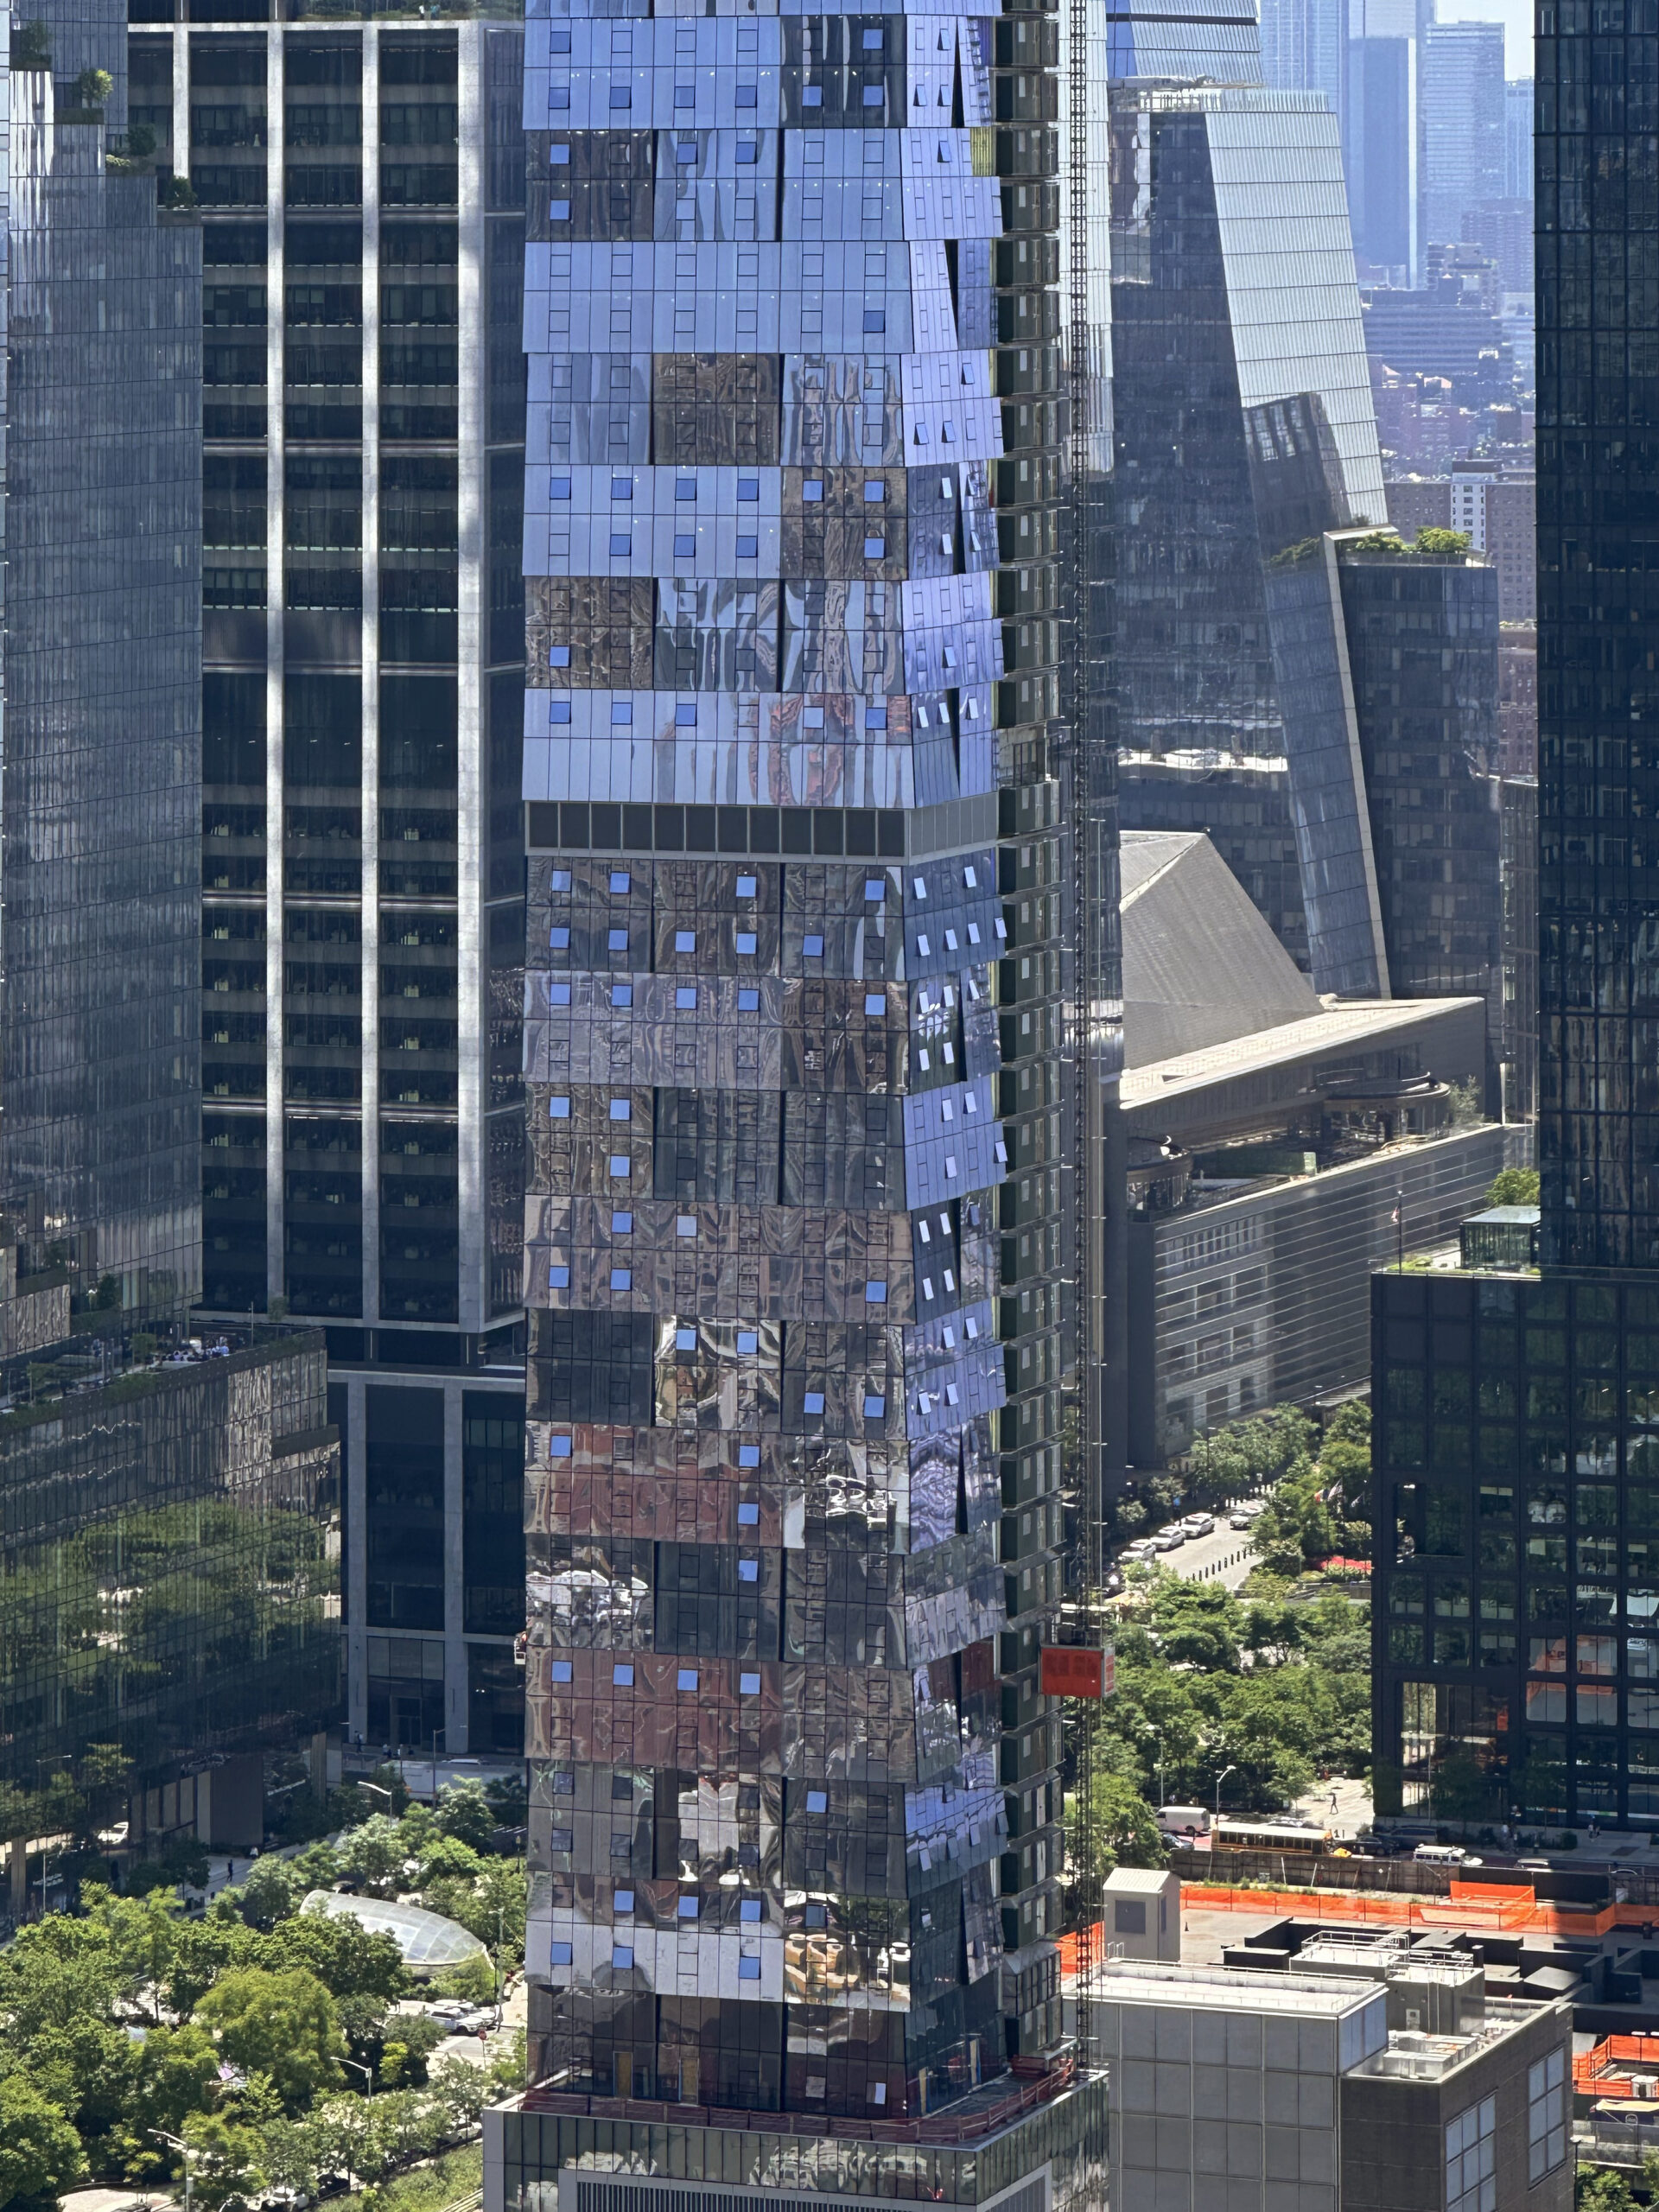
Photo by Michael Young
Subscribe to YIMBY’s daily e-mail
![]()
Follow YIMBYgram for real-time photo updates
Like YIMBY on Facebook
Follow YIMBY’s Twitter for the latest in YIMBYnews
470 Kent Ave: A project that was started a few years ago, already topped out and has facade being installed…why is this being counted as “new” for Q2?
It would nice to have captions with locations on all the images presented here.
I’m 76 y/o. I can’t work computers the way young people do. But I have the benefit of being able to spot the landmarks and know what borough and part of the City I’m looking at. There are dead give ways; e.g., Roosevelt Island looking west (the FDR Drive, NY Hosp, HSS), the new LIC, Flatbush Ave and the 1000+ ft condo on Flatbush and DeKalb, right next to Junior’s Restaurant, where my mother and father used to take me when I was a boy during the 50s, and on and on, one picture after the other. A delight.
Yes, we asked for that about six months ago. Another words to additions have come out since. Hopefully somebody could recognize and provide us with these captions.
New York booming again.
Again?
Cities all over the world are building beautiful buildings. These are mostly uninspired and plain in appearance. I guess that they blend in well with the rest of the dull buildings around. There are examples of great architectural beauty in the city. It can be done.
Hooray, I always look forward to Yimby’s quarterly report! Clearly reported, lots of data, and all the Michael Young greatest hits photos from the previous 3 months. Great job!
Great photos!
As this article mentions, zoning laws must be updated to permit many more multifamily, apartments, condominiums and allow high rise buildings, unless there is a clear safety issue.
With so many without a place to live, “architectural style” or “neighborhood character” or “blocks view” is Not a valid reason to deny a new development!
It doesn’t make sense to compare with the previous quarter, if construction is lightly seasonal. Comparing to the same quarter of the previous year makes more sense.