
As New York City enters the second half of the 2020s, YIMBY commemorates five years of sharing detailed quarterly and annual statistics on new building permits filed with the Department of Buildings. Our 2025 Construction Report reveals that in 2024, the city’s developers filed 2,744 new building permits, which combine for a total of more than 71 million square feet. These structures will supply nearly 53,000 new residential and hotel units upon completion, as well as ample newly constructed space for commercial, institutional, and other uses. Below we take a close look at the aggregated data and delineate emergent trends and patterns in a series of analyses of building height, floor area, location, and more.
A detailed data sheet, with thorough information on each proposed project and their development teams, is available with a subscription to YIMBY’s Building Wire.
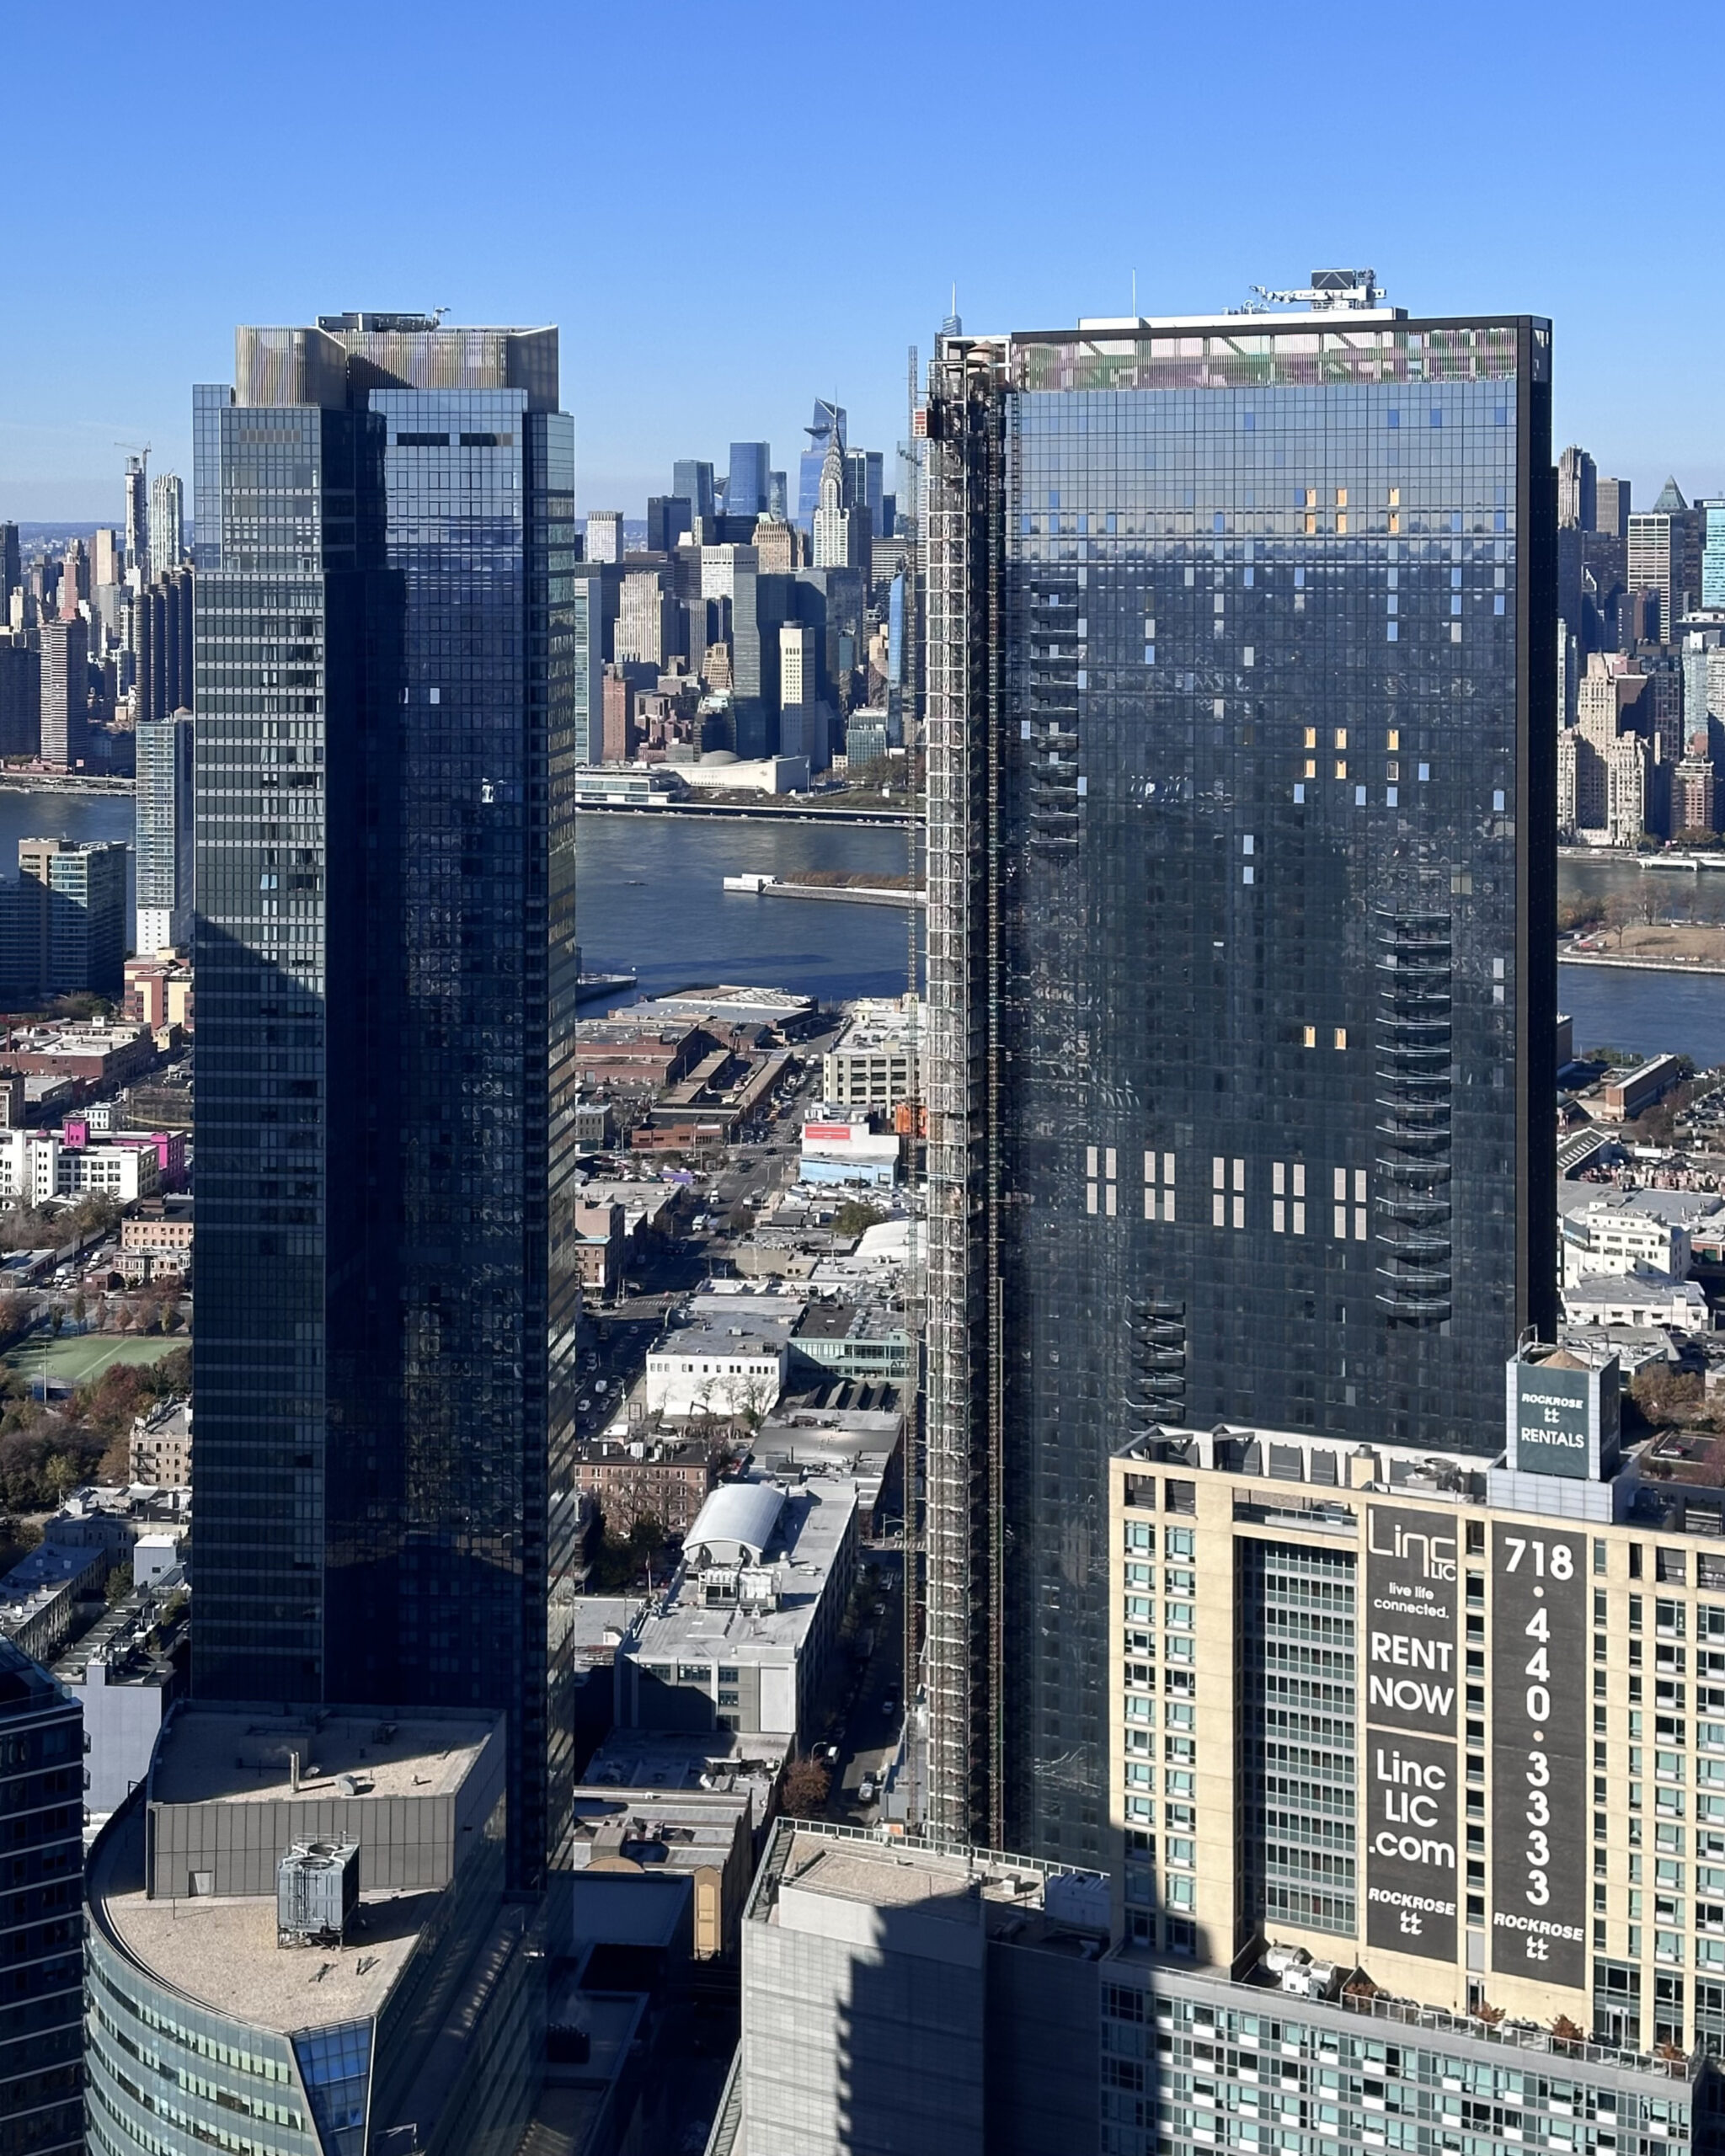
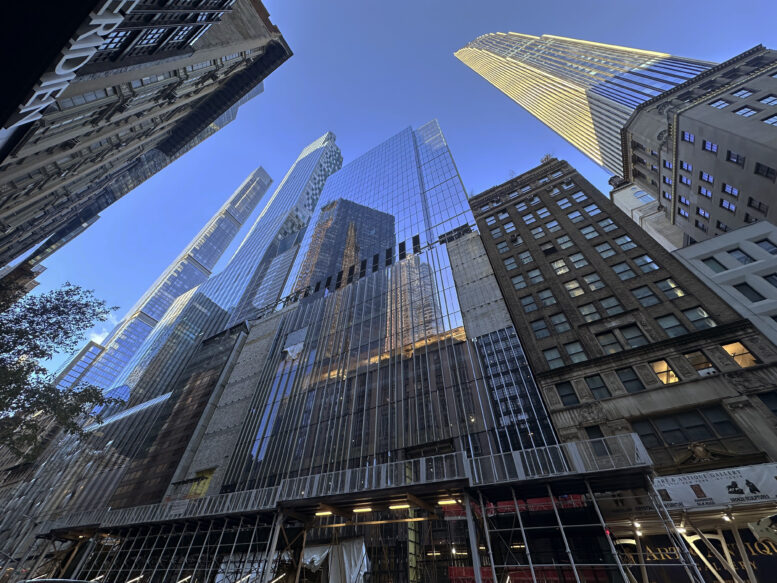
Photo by Michael Young
Number of permit filings per month

Number of new construction permits filed per month in New York City in 2024. Data source: the Department of Buildings. Data aggregation and graphics credit: Vitali D. Ogorodnikov.
New York City’s developers filed permits for a total of 2,744 new structures with the Department of Buildings in 2024. January set the year’s record with a total of 342 new building permit filings, following on the heels of particularly strong filing activity in the second half of 2023 (which culminated with December’s tally of 794 monthly filings, a record since YIMBY began keeping track at the start of the decade). Since then, not a single month has risen above the 300-permit mark, although monthly permit filings trended steadily upward over the course of the year.
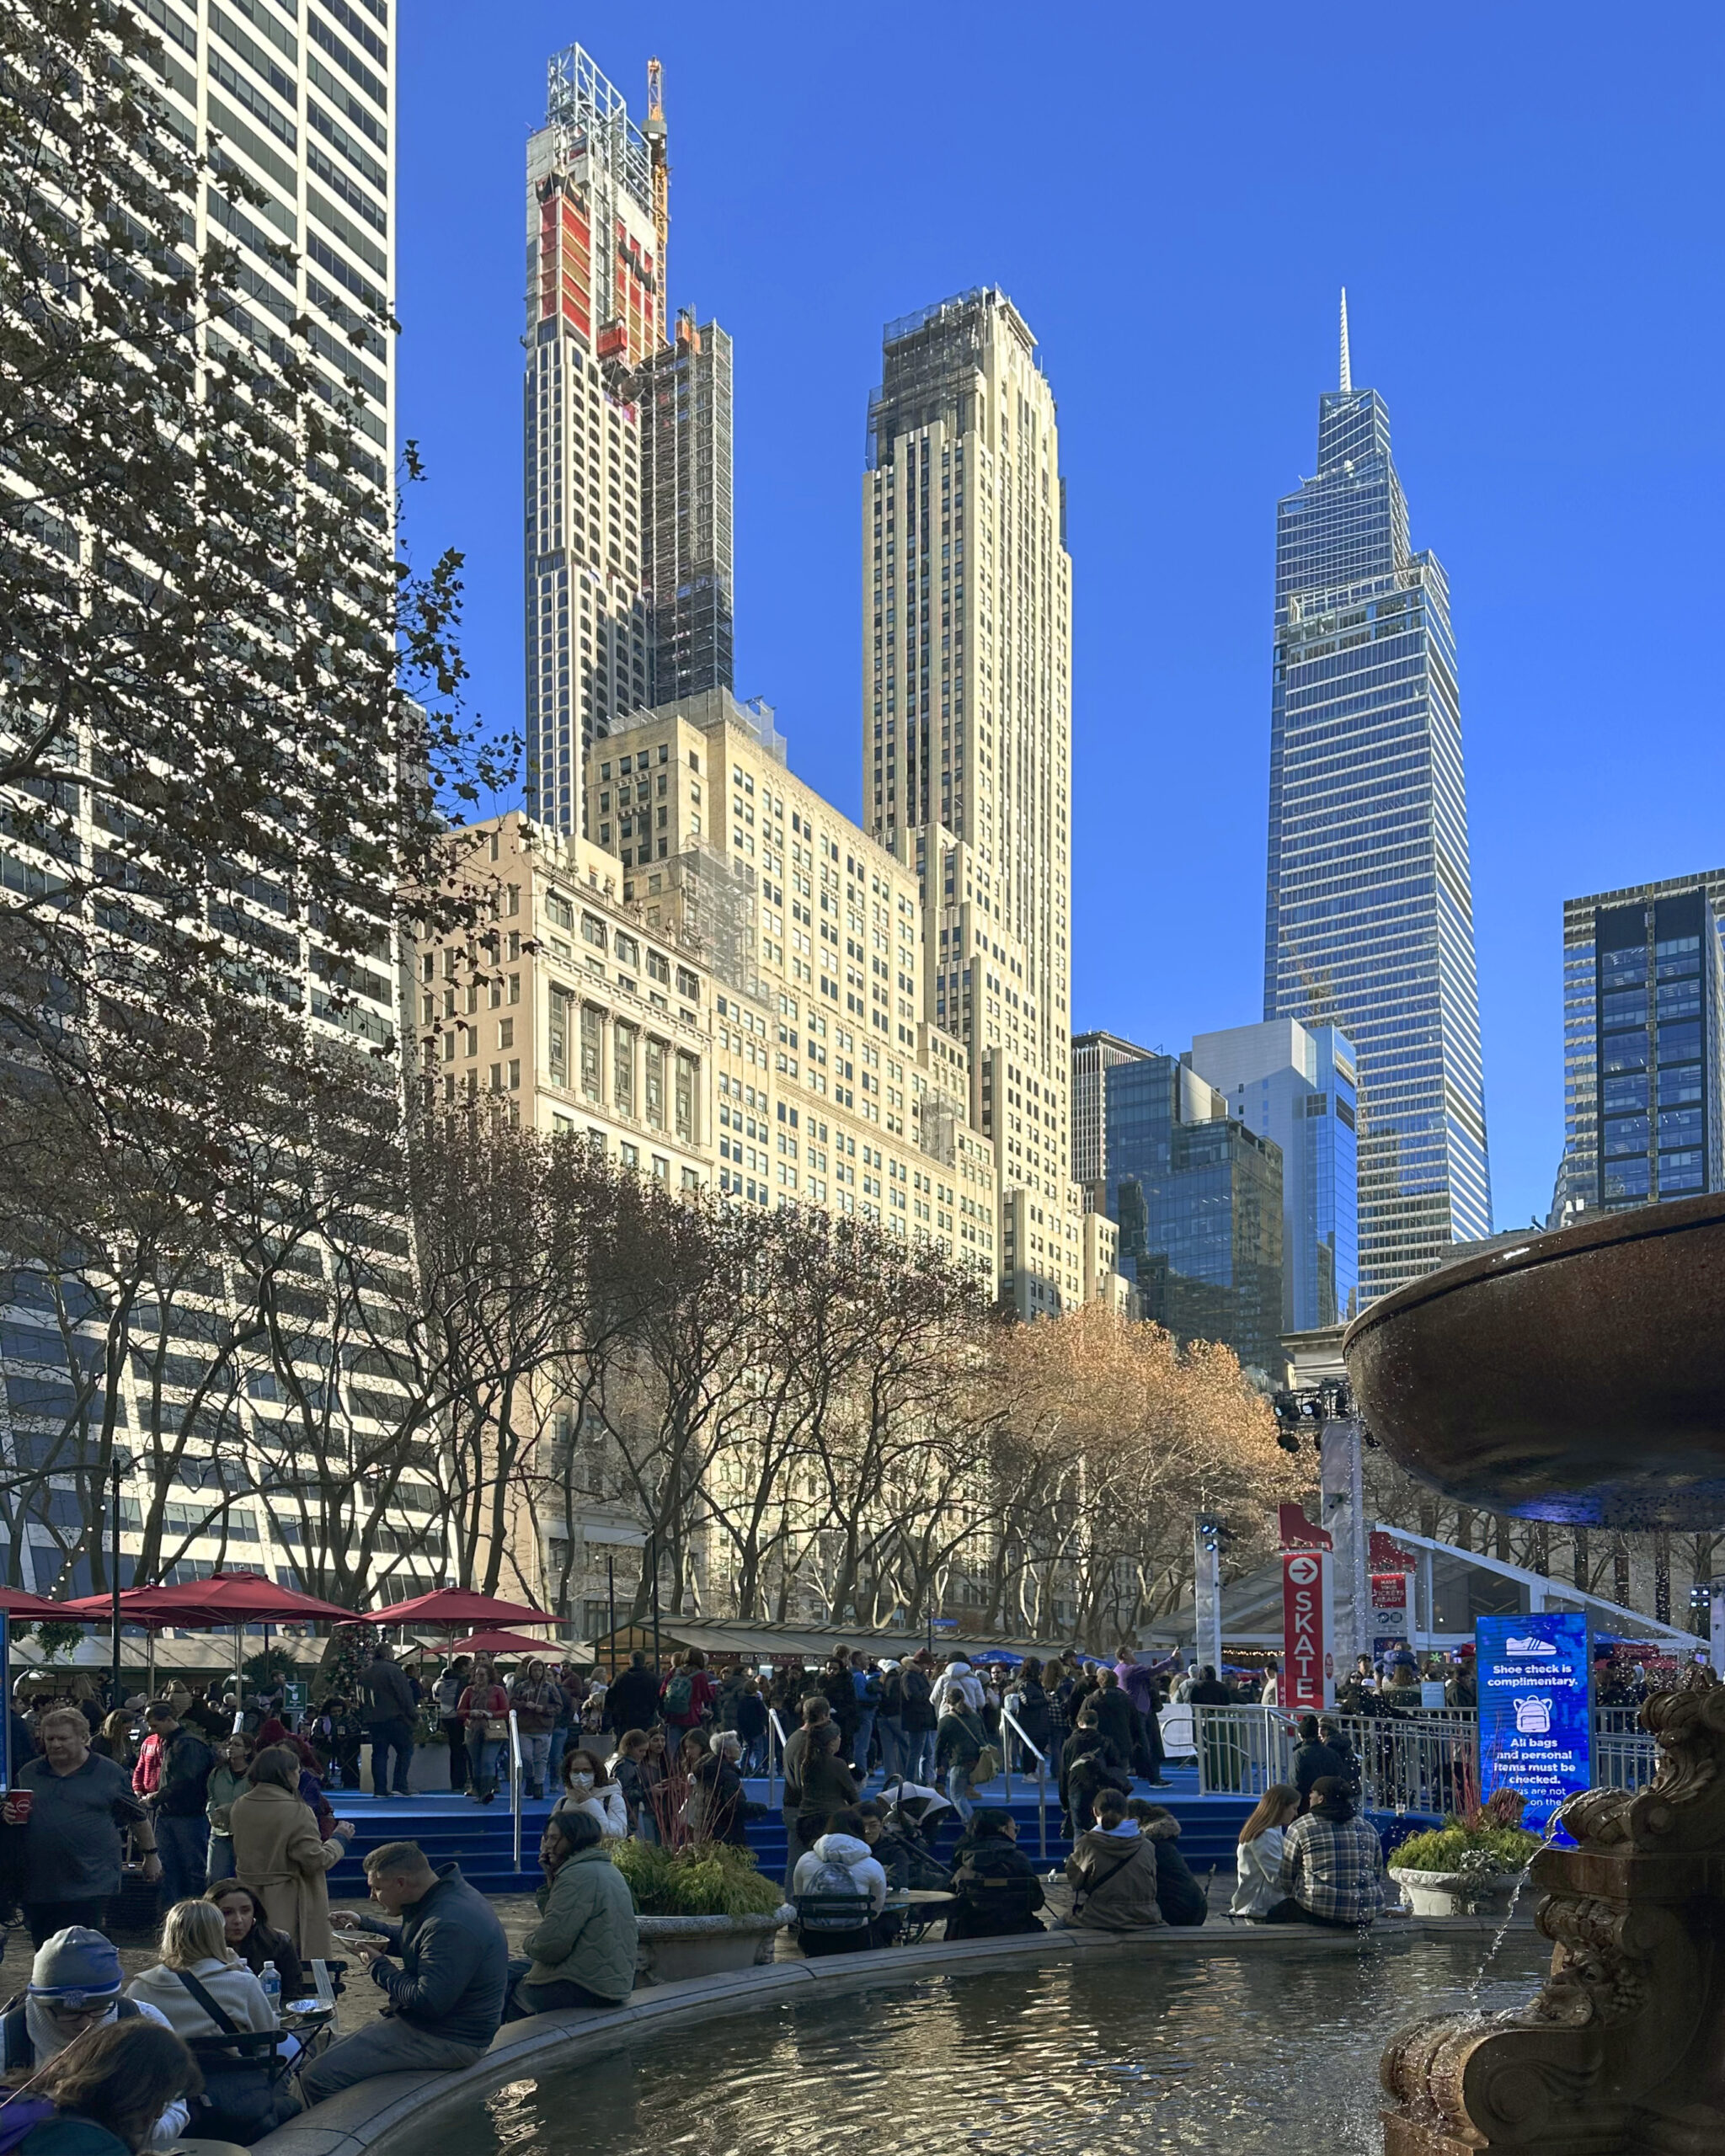
Photo by Michael Young
Number of permit filings by borough

Number of new construction permits filed per borough in New York City in 2024. Data source: the Department of Buildings. Data aggregation and graphics credit: Vitali D. Ogorodnikov.
The overall breakdown of new building permit filings by borough in 2024 maintained the trend we have observed over the recent years. Once again, overall borough size combined with prevailing building typologies (small- versus large-scale) proved to be the primary determinants of permit counts. Though four out of five boroughs registered permit filing decreases from the year before (which tallied a total of 4,306 new building filings), Queens retained its top spot, followed by Brooklyn, Staten Island, The Bronx, and finally Manhattan, with the latter characterized by fewer overall new building permits and with a relatively large size of individual filings.
Below is the breakdown of borough statistic changes between 2023 and 2024:
- The Bronx: 12-percent decrease (417 new building permits filed in 2023 to 366 permits in 2024)
- Brooklyn: 38-percent decrease (1,156 to 719 permits)
- Manhattan: 12-percent decrease (110 to 97)
- Queens: 4-percent increase (968 to 1,002)
- Staten Island: 57-percent decrease (1,302 to 560)
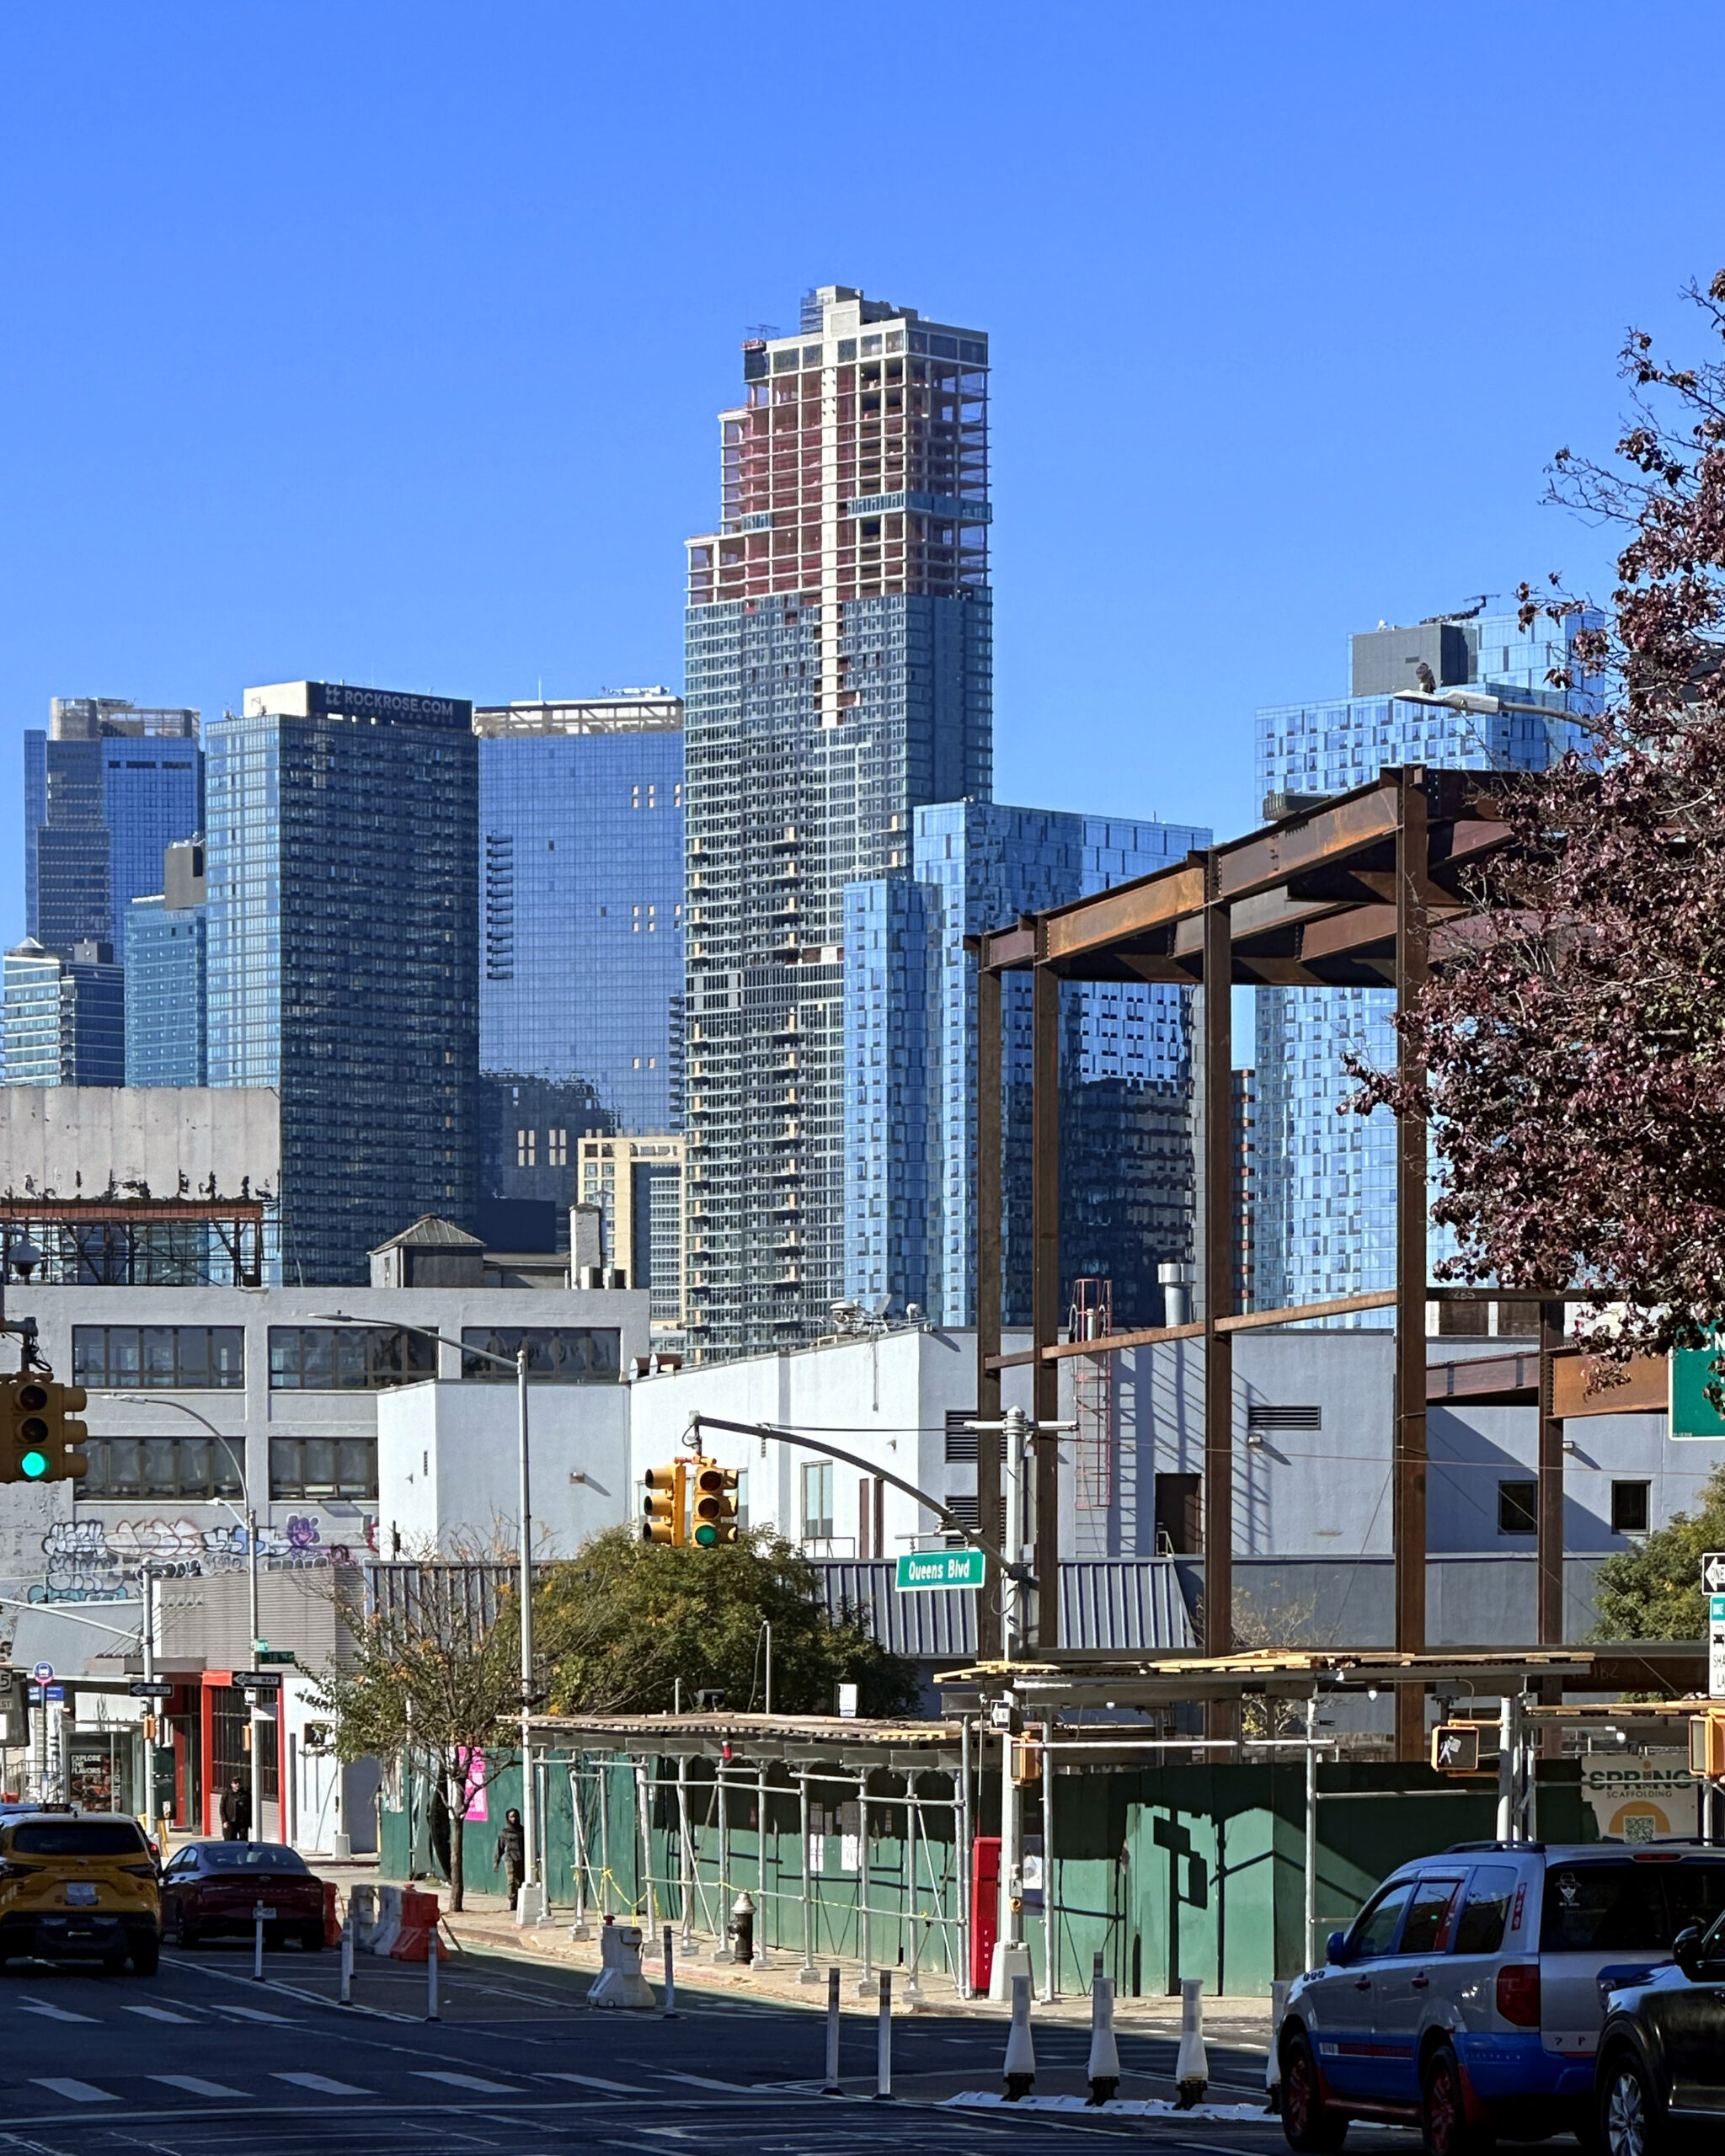
Photo by Michael Young
Permits listed by unit count per filing

New residential and hotel construction permits filed in New York City in 2024, grouped by unit count per filling. Data source: the Department of Buildings. Data aggregation and graphics credit: Vitali D. Ogorodnikov.
In 2024, New York City registered 2,o87 new building permit filings for residential and hotel developments, with residential projects comprising the majority of the filings. Of these, roughly half (1,072) were for single- and two-family dwellings, with another 746 permits filed for mid-sized apartment buildings and hotels with three to 49 units. Compared to 2023, each of the four categories within the abovementioned range registered a permit count decrease, albeit lowering in total percentage volume drop for larger-building categories. The trend reverses at the upper range, with two of the three largest-building categories registering increases compared to the previous year. In all, the data indicates that, in 2024, the city’s developers have gradually shifted toward residential filings that are fewer in count yet larger in scale than those in the previous year.
Below, the filing size categories are compared between 2023 and 2024:
- Single-family – 63-percent decrease (1,023 new building filings in 2023 to 382 filings in 2024)
- Two-family – 42-percent decrease (1,188 to 69 filings)
- Three to nine units – 29-percent decrease (568 to 401)
- Ten to 49 units – 26-percent decrease (469 to 345)
- 50 to 99 units – 6-percent increase (120 to 127)
- 100 to 499 units – 15-percent increase (121 to 139)
- 500 to 599 units – 67-percent decrease (9 to 3)
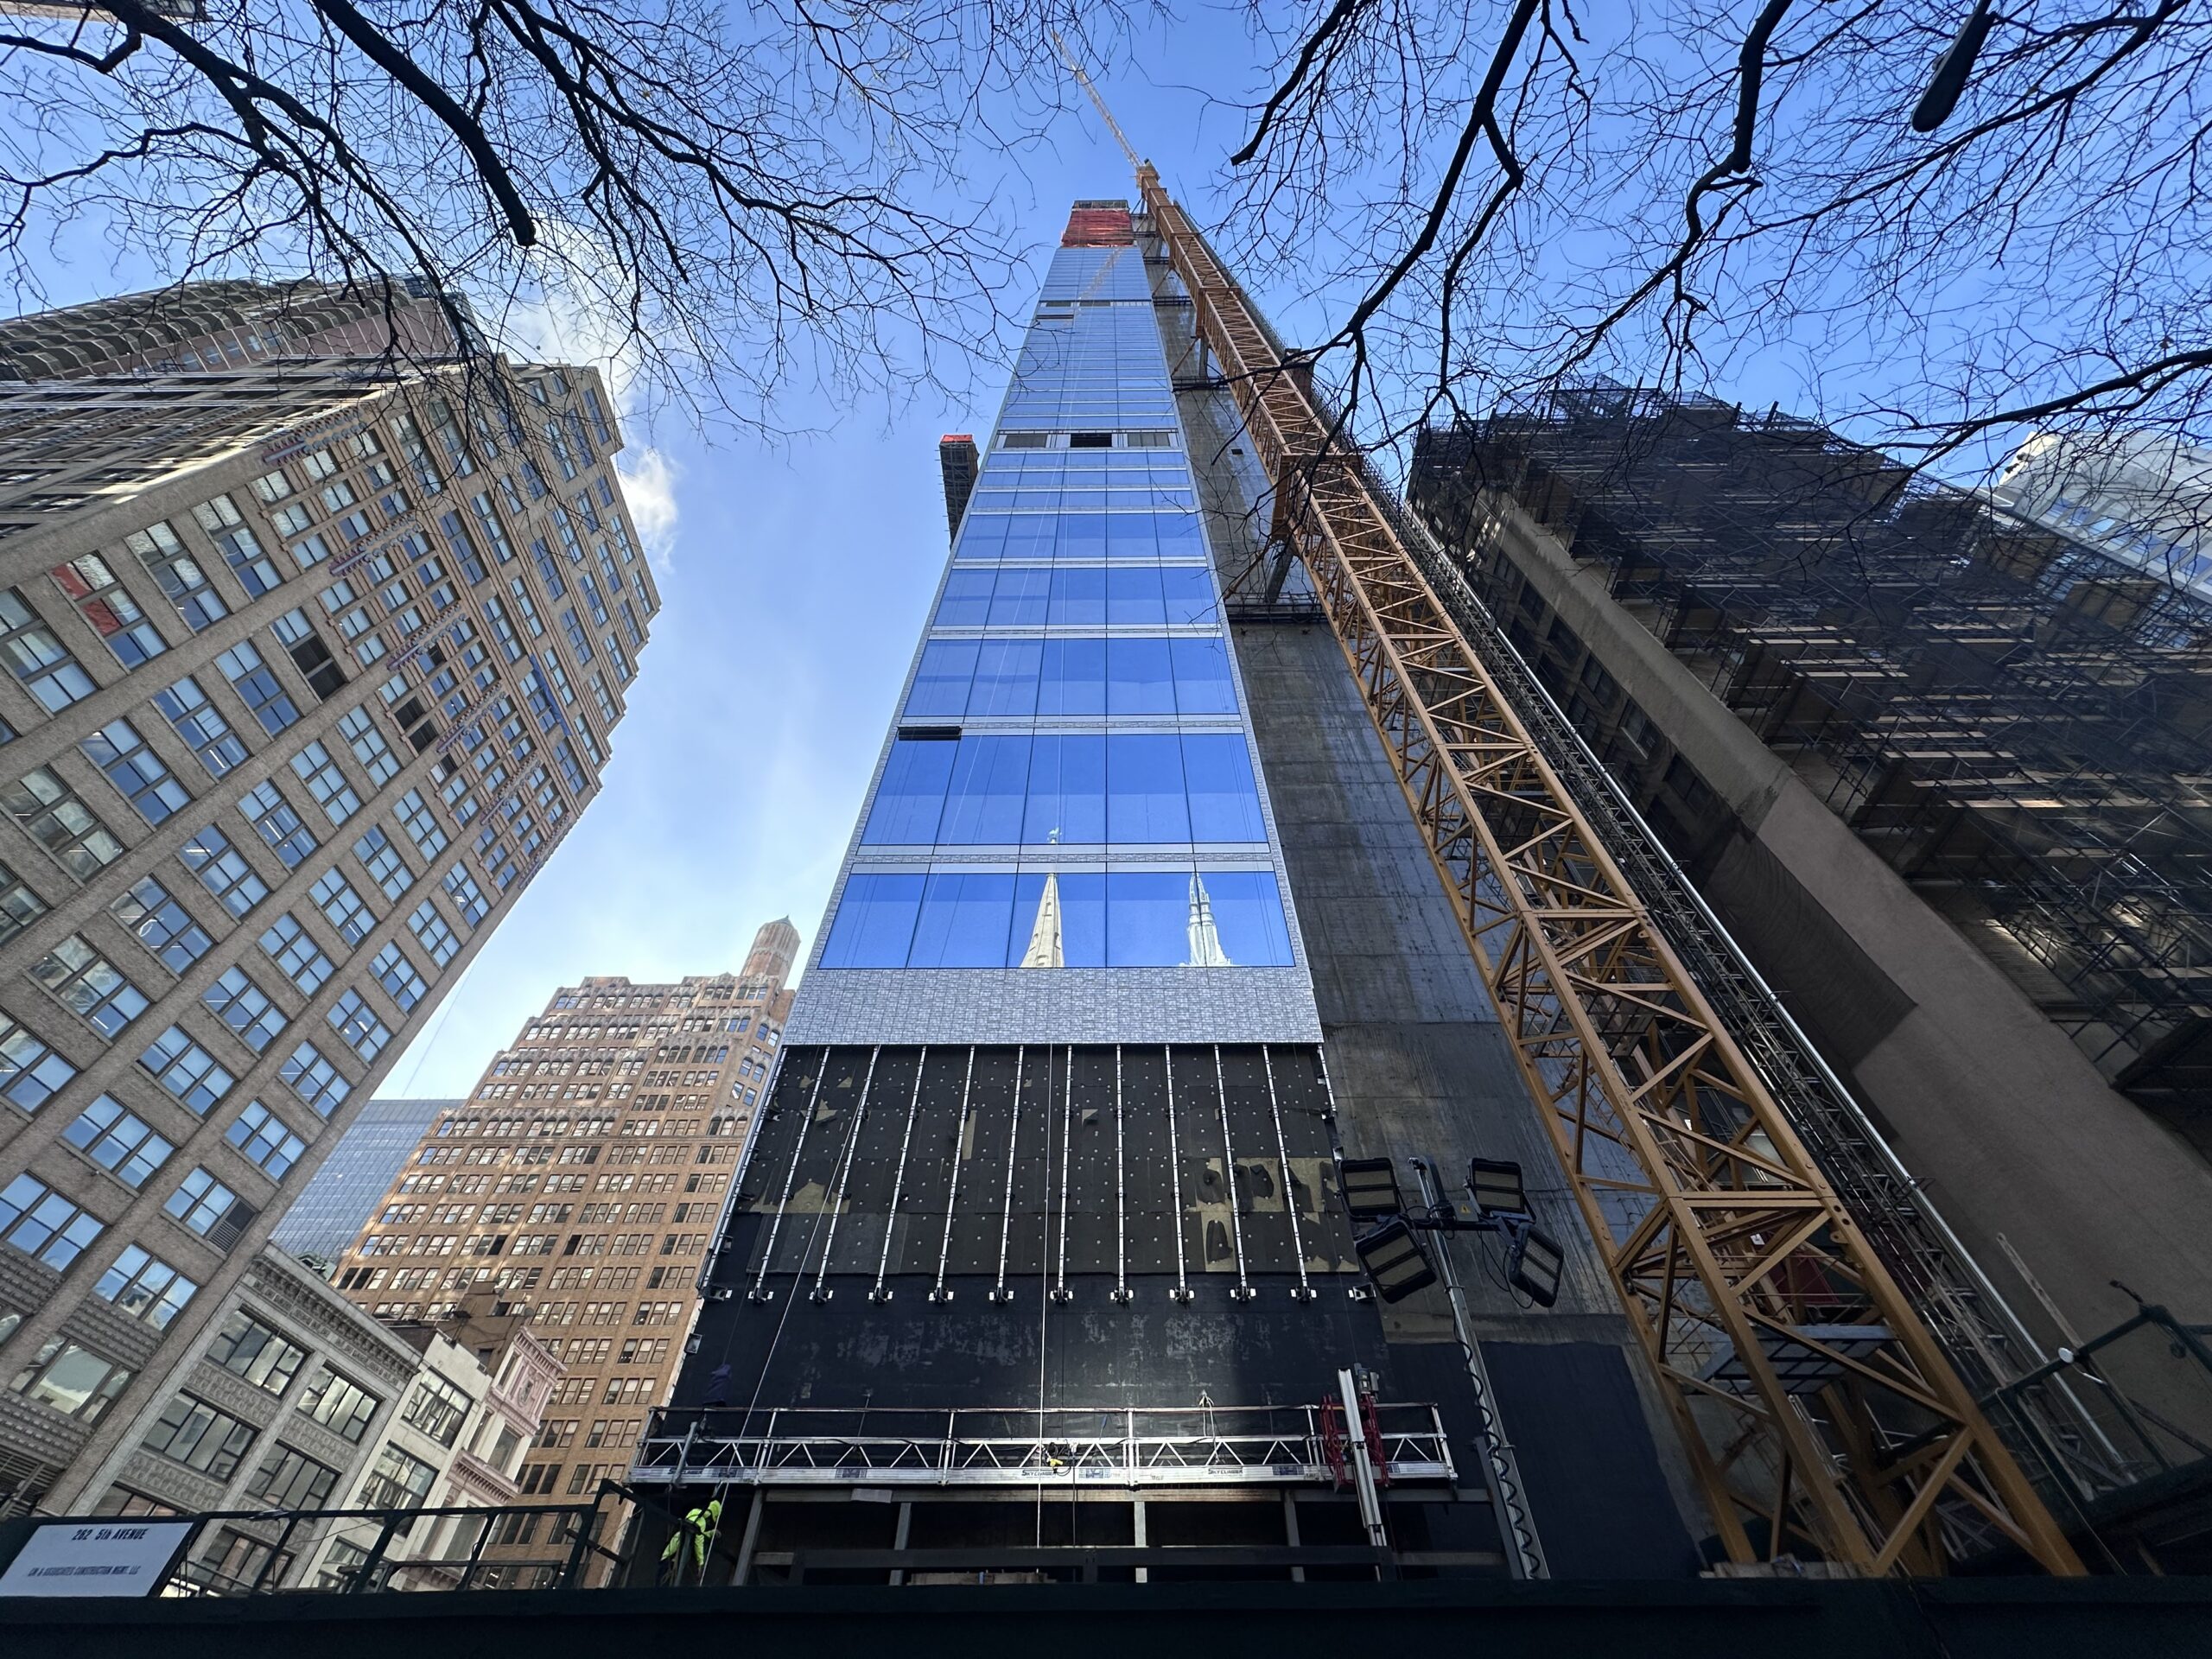
Photo by Michael Young
Residential and hotel units filed per borough

Combined floor area of new construction permits filed per borough in New York City in 2024. Data source: the Department of Buildings. Data aggregation and graphics credit: Vitali D. Ogorodnikov.
The total of 52,585 new residential and hotel units (primarily residential) recorded in new building permits filed in 2024 represents a 7 percent drop compared to the respective 2023 count of 56,438. As such, almost every borough registered a slight unit count decrease during the period, except for Brooklyn, which notched an 8-percent gain. The overall trend, however, has remained very similar to that observed in the previous years, with Brooklyn as the leader with nearly 22,000 units. The Bronx and Queens remain nearly tied for second place with close to 12,000 units per borough, though the overall minor fluctuations were enough to swap the two in their respective rankings.
With a 3-percent unit count drop, Manhattan showed the least change between the two years and essentially maintained its nearly 7,000-unit count. In contrast, predominantly low-density Staten Island, which retained its fifth-place ranking, showed the steepest drop by decreasing its filed-for unit count by 71 percent between 2023 and 2024, dropping below the 1,000-unit benchmark.
Below is a by-borough comparison between 2023 and 2024:
- The Bronx: 11-percent decrease (13,250 residential and hotel units filed in 2023 to 11,816 units filed in 2024)
- Brooklyn: 8-percent increase (20,129 to 21,817 units)
- Manhattan: 3-percent decrease (6,841 to 6,635)
- Queens: 14-percent decrease (13,456 to 11,514)
- Staten Island: 71-percent decrease (2,762 to 803)
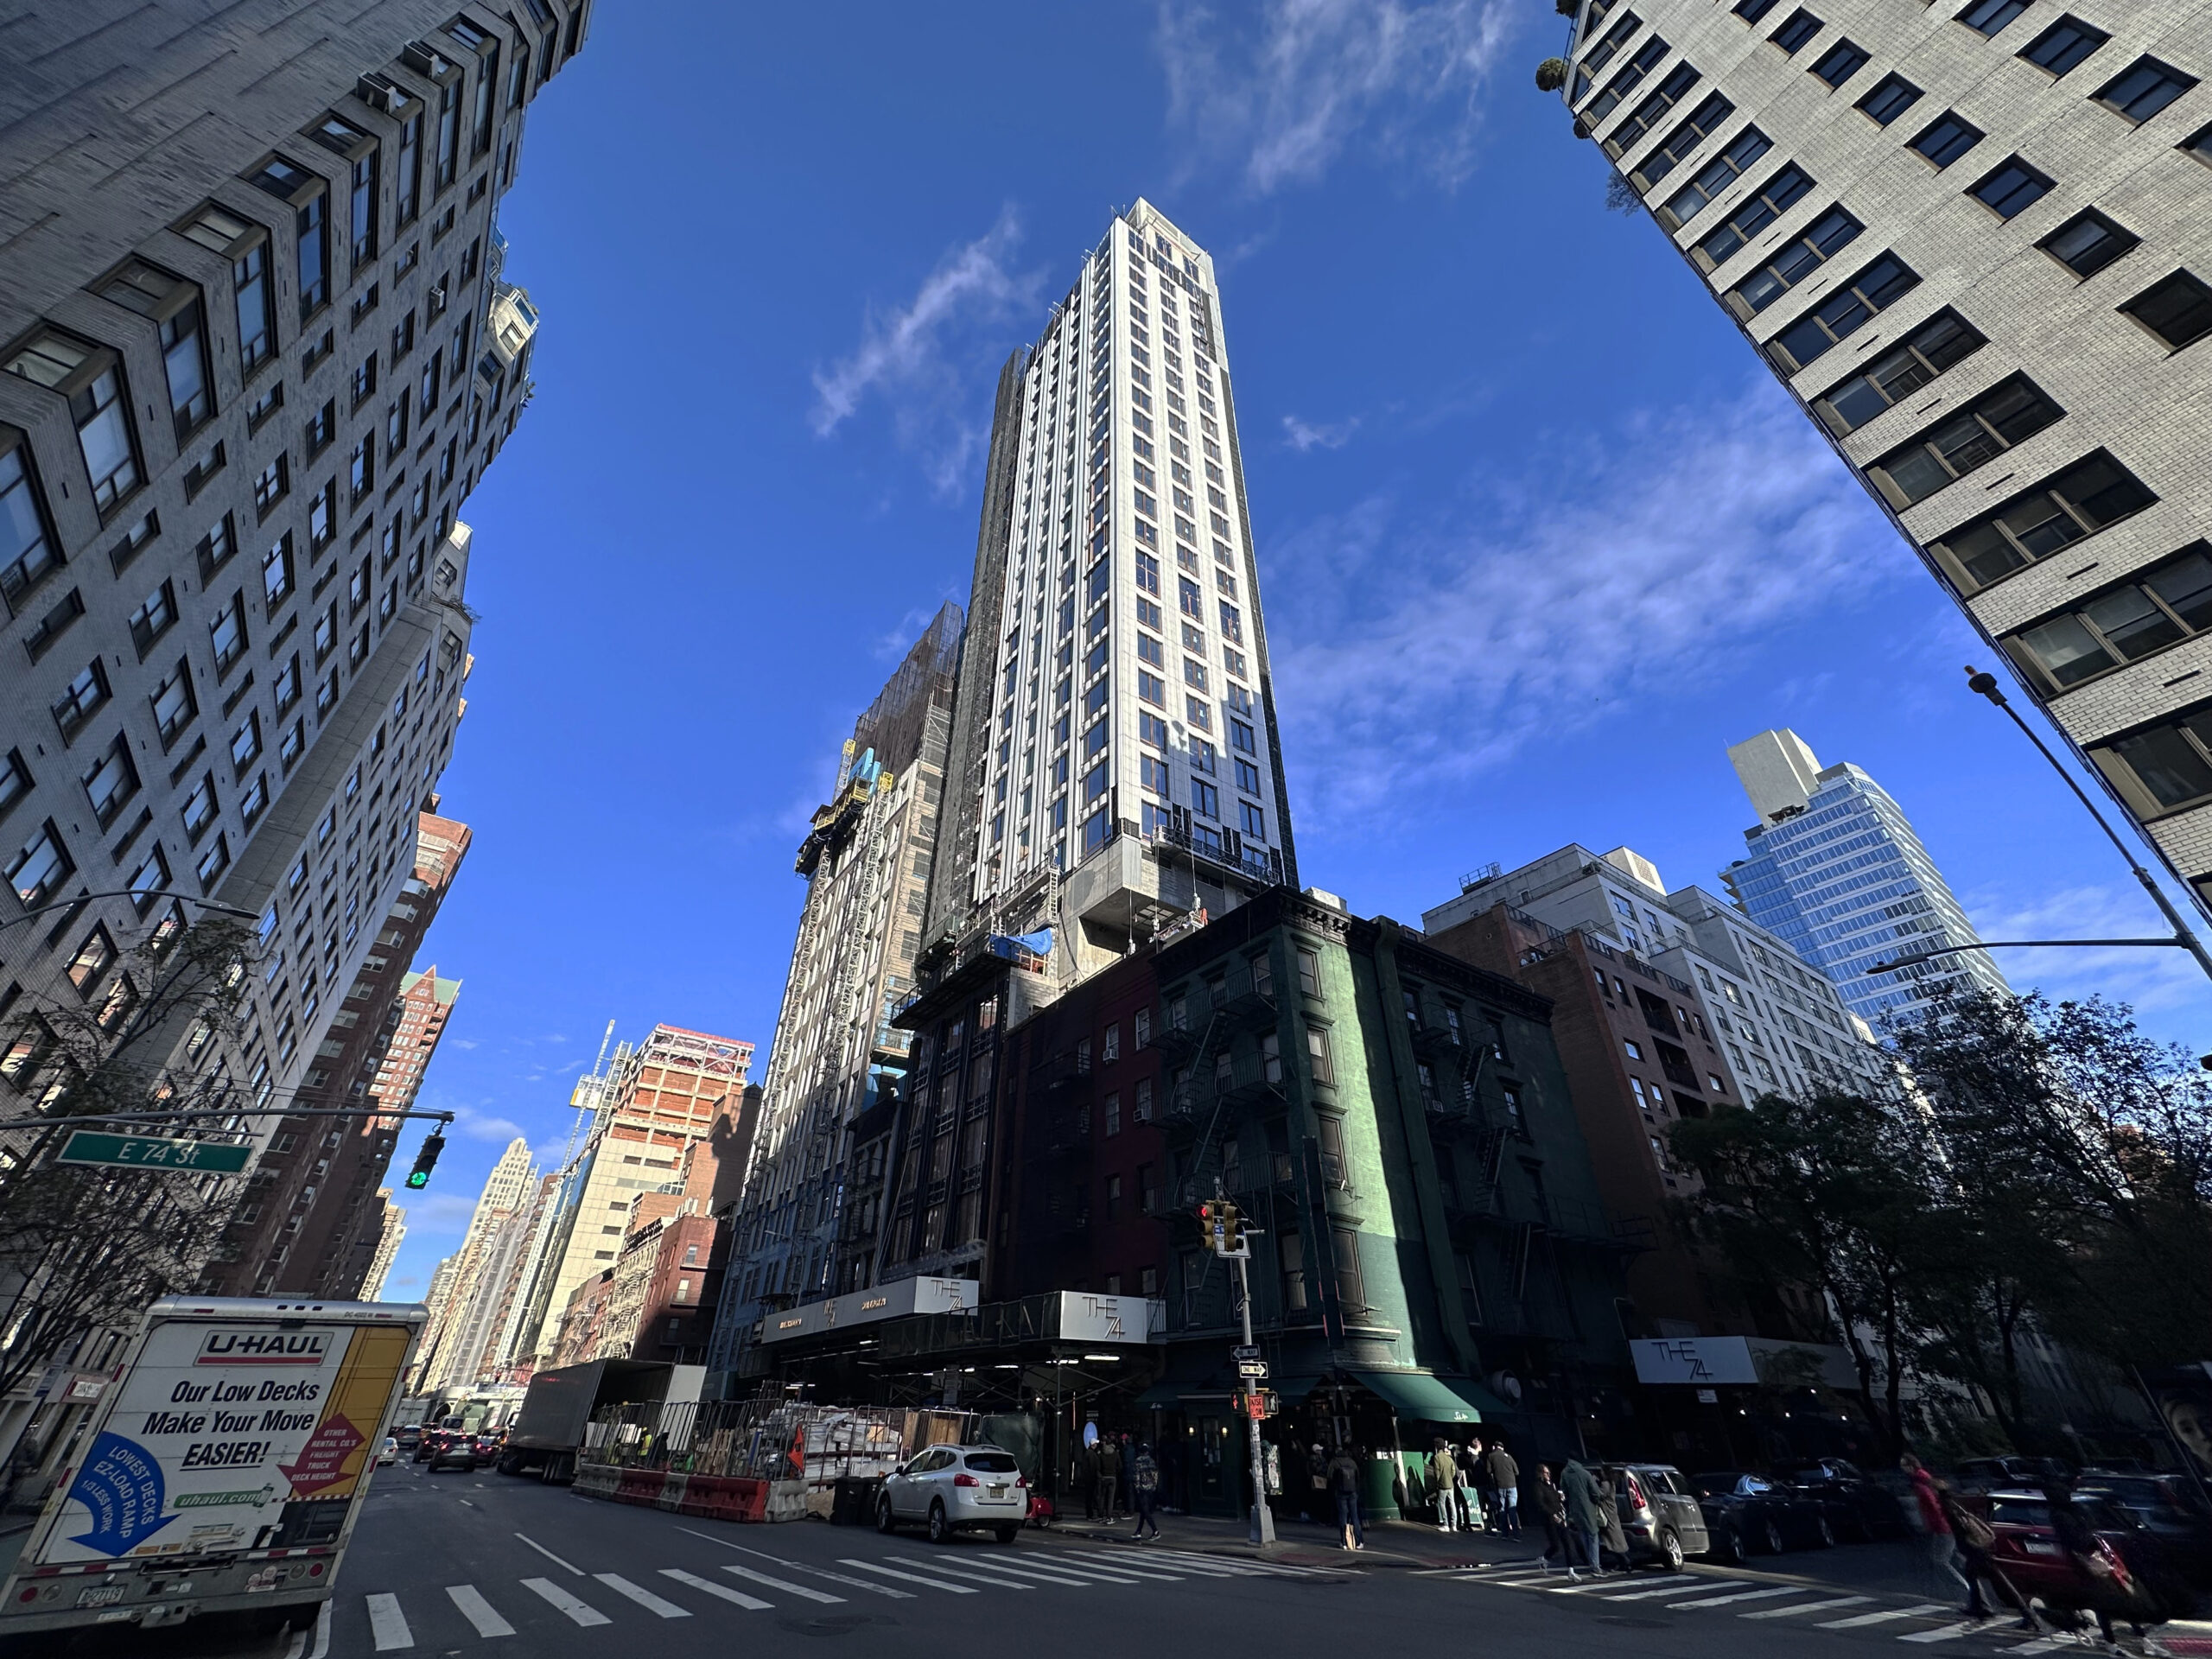
Photo by Michael Young
Permits listed by average unit count per filing

Average unit count (residential and hotel) per new construction permit per borough filed in New York City in 2024. Data source: the Department of Buildings. Data aggregation and graphics credit: Vitali D. Ogorodnikov.
The 2024 averages for unit counts per typical residential and hotel permit filing continue to reflect the city’s built environment. High-density Manhattan still displayed the largest average unit count per new building permit at 80, while sprawling Staten Island recorded an average of just 2.1 residences per filing. The Bronx, Brooklyn, and Queens, each comprised of neighborhoods that span from dense skyscraper clusters to suburban-style cul-de-sacs, fill the in-between space with averages of 36, 36 (again), and 17 average units per filing, respectively.
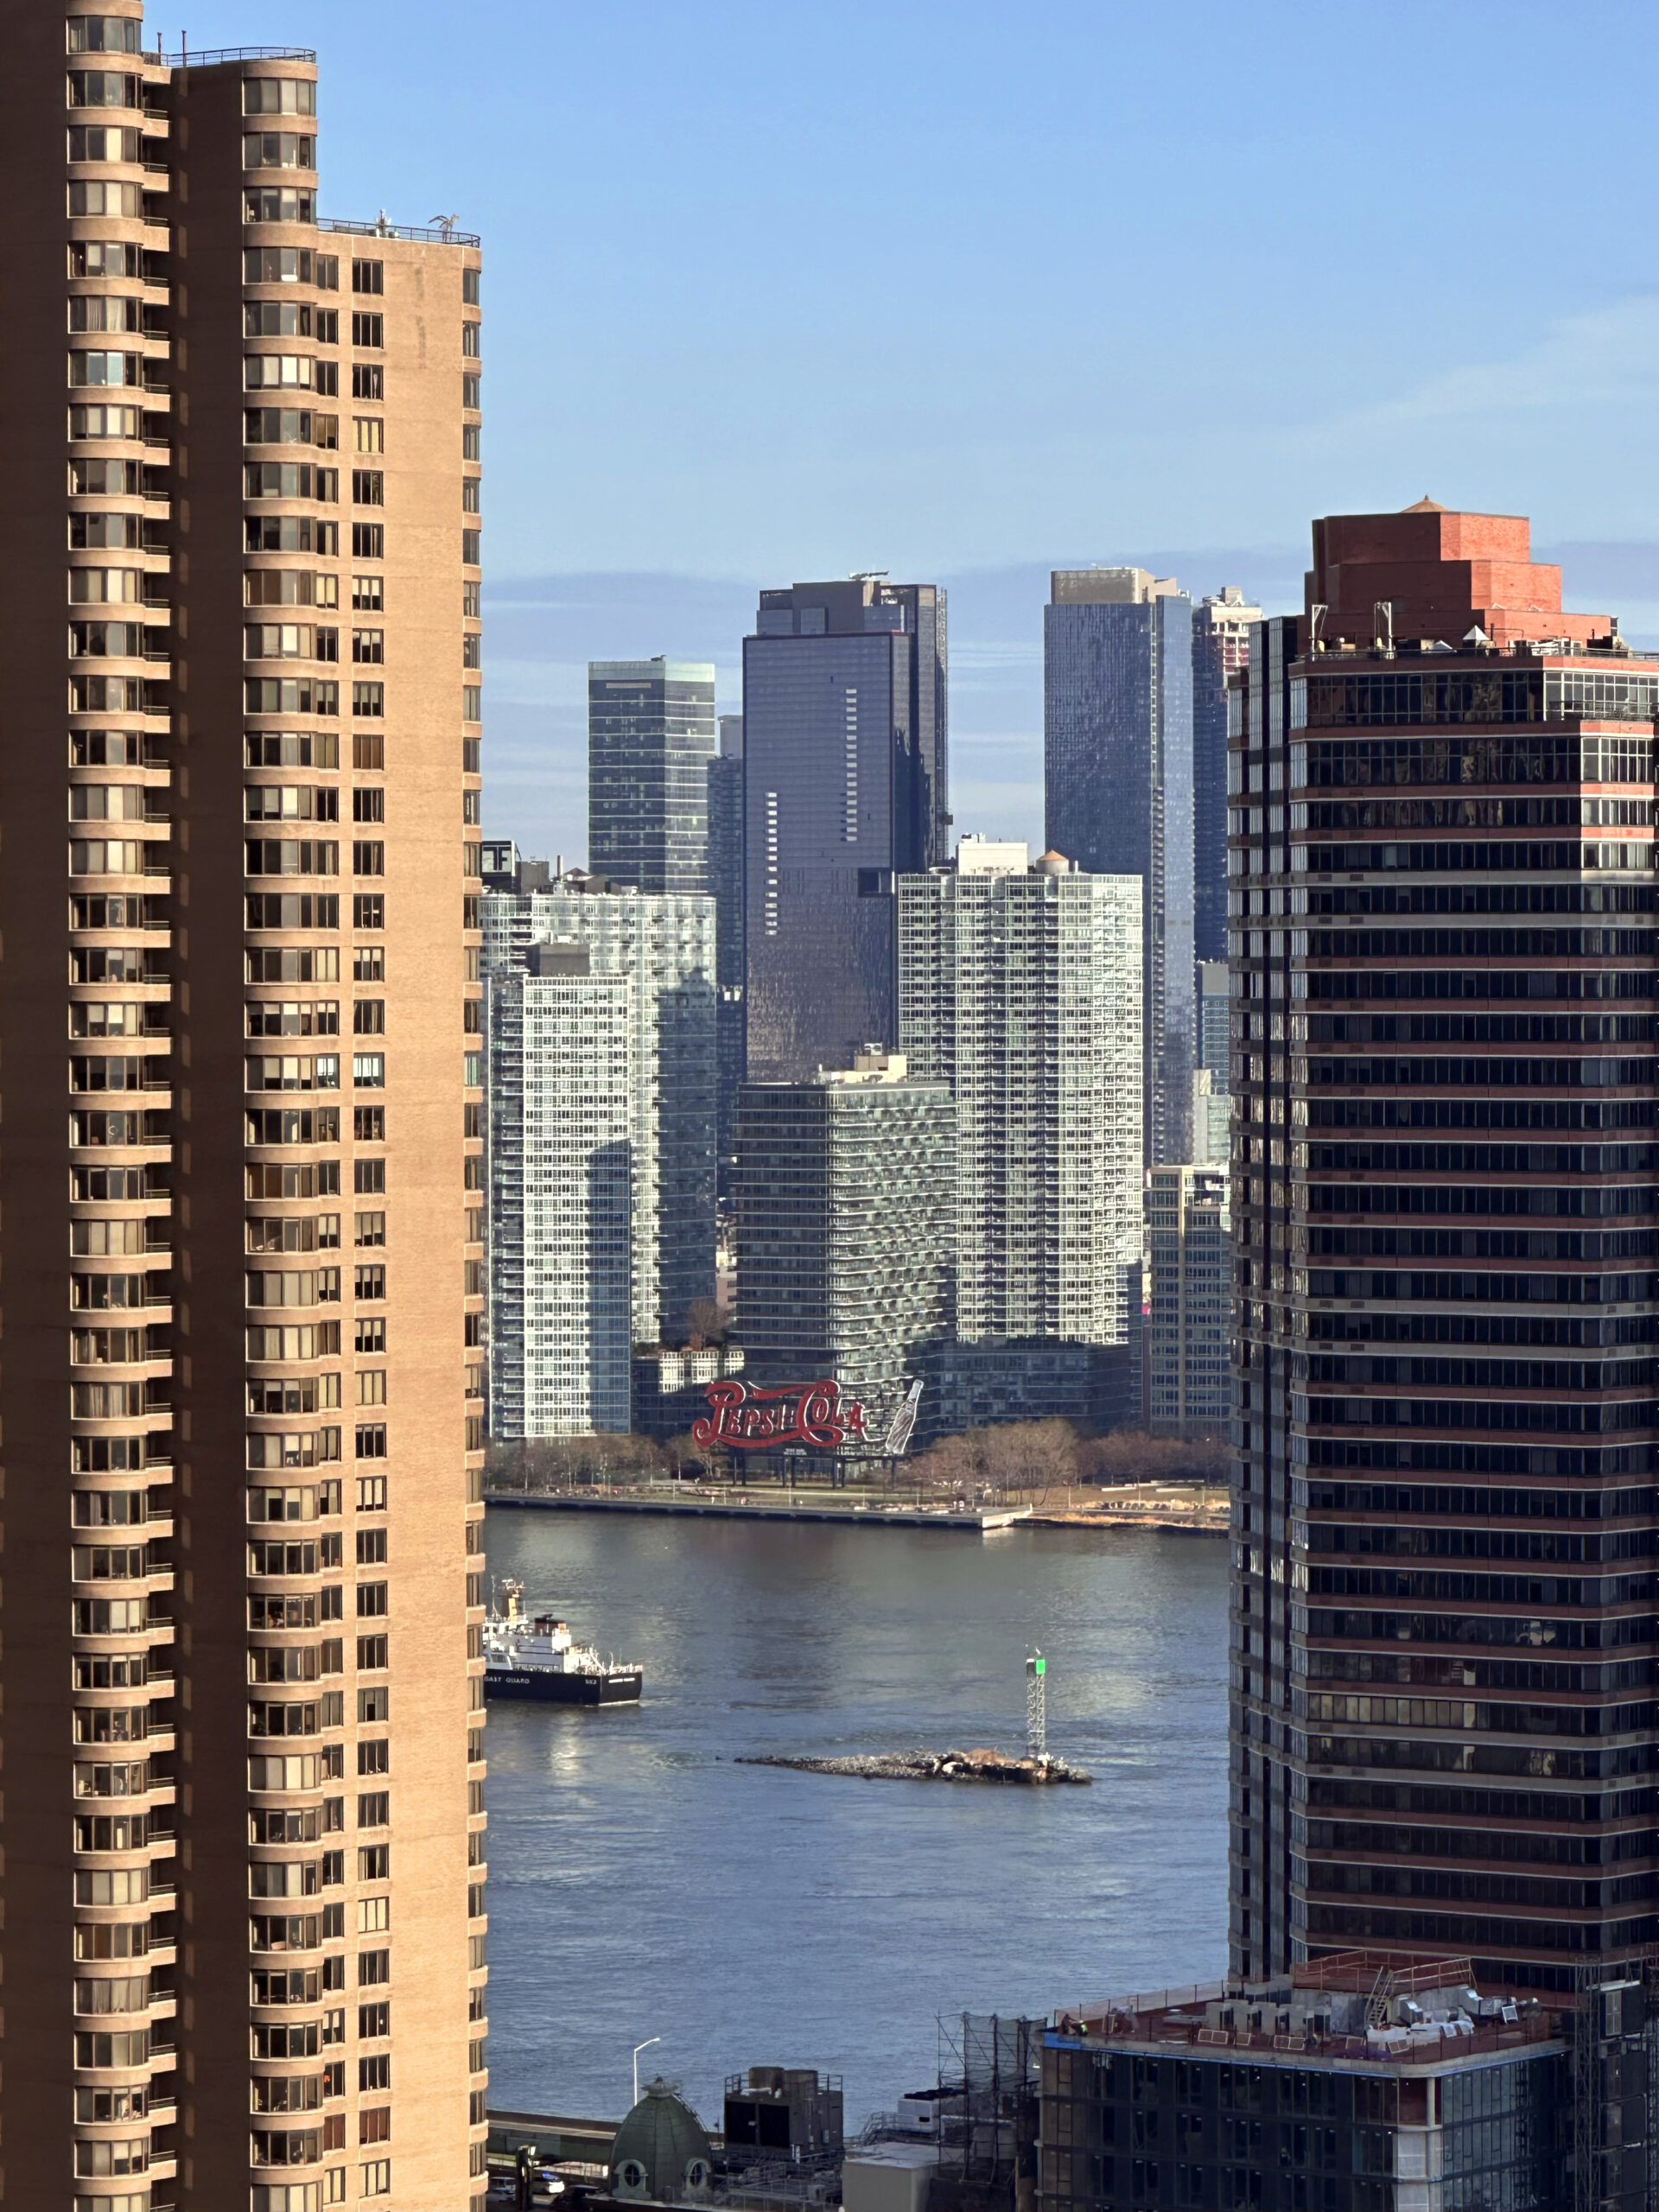
Photo by Michael Young
Permit filings by floor count category

New construction permits filed in New York City in 2024, grouped by floor count. Data source: the Department of Buildings. Data aggregation and graphics credit: Vitali D. Ogorodnikov.
Despite its world-famous skyline, low-rise buildings comprise much of New York City, and new building permit filings in 2024 further this trend. Of the 2,744 permits filed last year, nearly two-thirds fell squarely into the low-rise category with three stories or fewer. Of these, the three-story group was the largest, contrasting with a number of respective datasets from previous years where the two-story group predominated. This statistic in part explains the average floor count of 4.1 per filing, reflecting the higher end of similar tallies for earlier periods covered.
Despite relative gains for some higher categories, given the cumulative decrease of new permits filed compared to previous year, total filing numbers decreased in nearly every category between the two years. Notable exceptions are the 10-19, 20-29, and 60-69-story categories, which saw increases by 13, 18, and 100 percent, respectively. Below is a comparison per floor-count category between 2023 and 2024:
- Single-story: 13-percent decrease (61 new building permit filings in 2023 to 533 permits in 2024)
- Two-story: 47-percent decrease (1,091 to 577 permits)
- Three-story: 49-percent decrease (1,268 to 642)
- Four-story: 43-percent decrease (558 to 319)
- Five to six floors: 27-percent decrease (294 to 215)
- Seven to nine floors: 11-percent decrease (326 to 290)
- Ten to 19 floors: 13-percent increase (111 to 125)
- 20 to 29 floors: 18-percent increase (28 to 33)
- 30 to 39 floors: 25-percent decrease (8 to 6)
- 40 to 49 floors: 67-percent decrease (6 to 2)
- 50 to 59 floors: 100-percent decrease (4 to none)
- 60 to 69 floors: 100-percent increase (1 to 2)
Below are the top ten permits with the highest floor counts filed in 2024, in order:
- 613 Madison Avenue in Midtown Manhattan (68 floors)
- 376 Schermerhorn Street in Downtown Brooklyn (60 floors)
- 205 Montague Street in Downtown Brooklyn (47 floors)
- 51 Willoughby Street in Downtown Brooklyn (43 floors)
- 1448 Third Avenue in Yorkville, Manhattan (38 floors, tie)
- 42-19 24th Street in Long Island City, Queens (38 floors, tie)
- 255 East 77th Street on the Upper East Side, Manhattan (36 floors)
- 80 Clarkson Street in West Village, Manhattan (34 floors)
- 170 West 48th Street in Midtown, Manhattan (33 floors)
- 188 Duffield Street in Downtown Brooklyn (30 floors)
In 2024, the most significant skyscraper permit filing was for 613 Madison Avenue, a 68-story tower rising at least 1,220 feet (likely somewhat higher if including a probable ornamental pinnacle). Situated a block away from Central Park, the supertall will contribute to the spindly Billionaires’ Row skyline, and its 101 units will almost certainly join the highest echelons of the city’s luxury real estate market.
The filing with the second-highest floor count is 376 Schermerhorn Street in Downtown Brooklyn. With a permit height of 753 feet (again, lightly higher if including an ornamental top), the skyscraper will become the borough’s second-tallest after the 1,067-foot-tall Brooklyn Tower completed at 9 DeKalb Street in 2023. With three more entries in the top ten (205 Montague Street, 47 floors; 51 Willoughby Street, 43 floors; and 188 Duffield Street, 30 floors), Downtown Brooklyn appears to be the year’s most prolific neighborhood when it comes to newly proposed skyscrapers.
In contrast, Long Island City, the Queens counterpart to the burgeoning Brooklyn skyline, registered only one entrant, a 38-story tower poised to rise at 42-19 24th Street across from the Queensboro Plaza subway station. However, we expect high-rise permit filing activity to pick up once again as a proposed neighborhood rezoning will enable more centrally located, transit-adjacent parcels to accommodate high-rise, high-density housing.
The remainder of the list’s entrants are scattered throughout Manhattan, with two permits on the Upper East Side, one in the Theater District, and one in the West Village. Also notable is the permit filing at 574 Fifth Avenue. With 29 floors, the proposed office tower lands at number 11 on the list at 567 feet, and boasts the year’s fourth-tallest permit height.
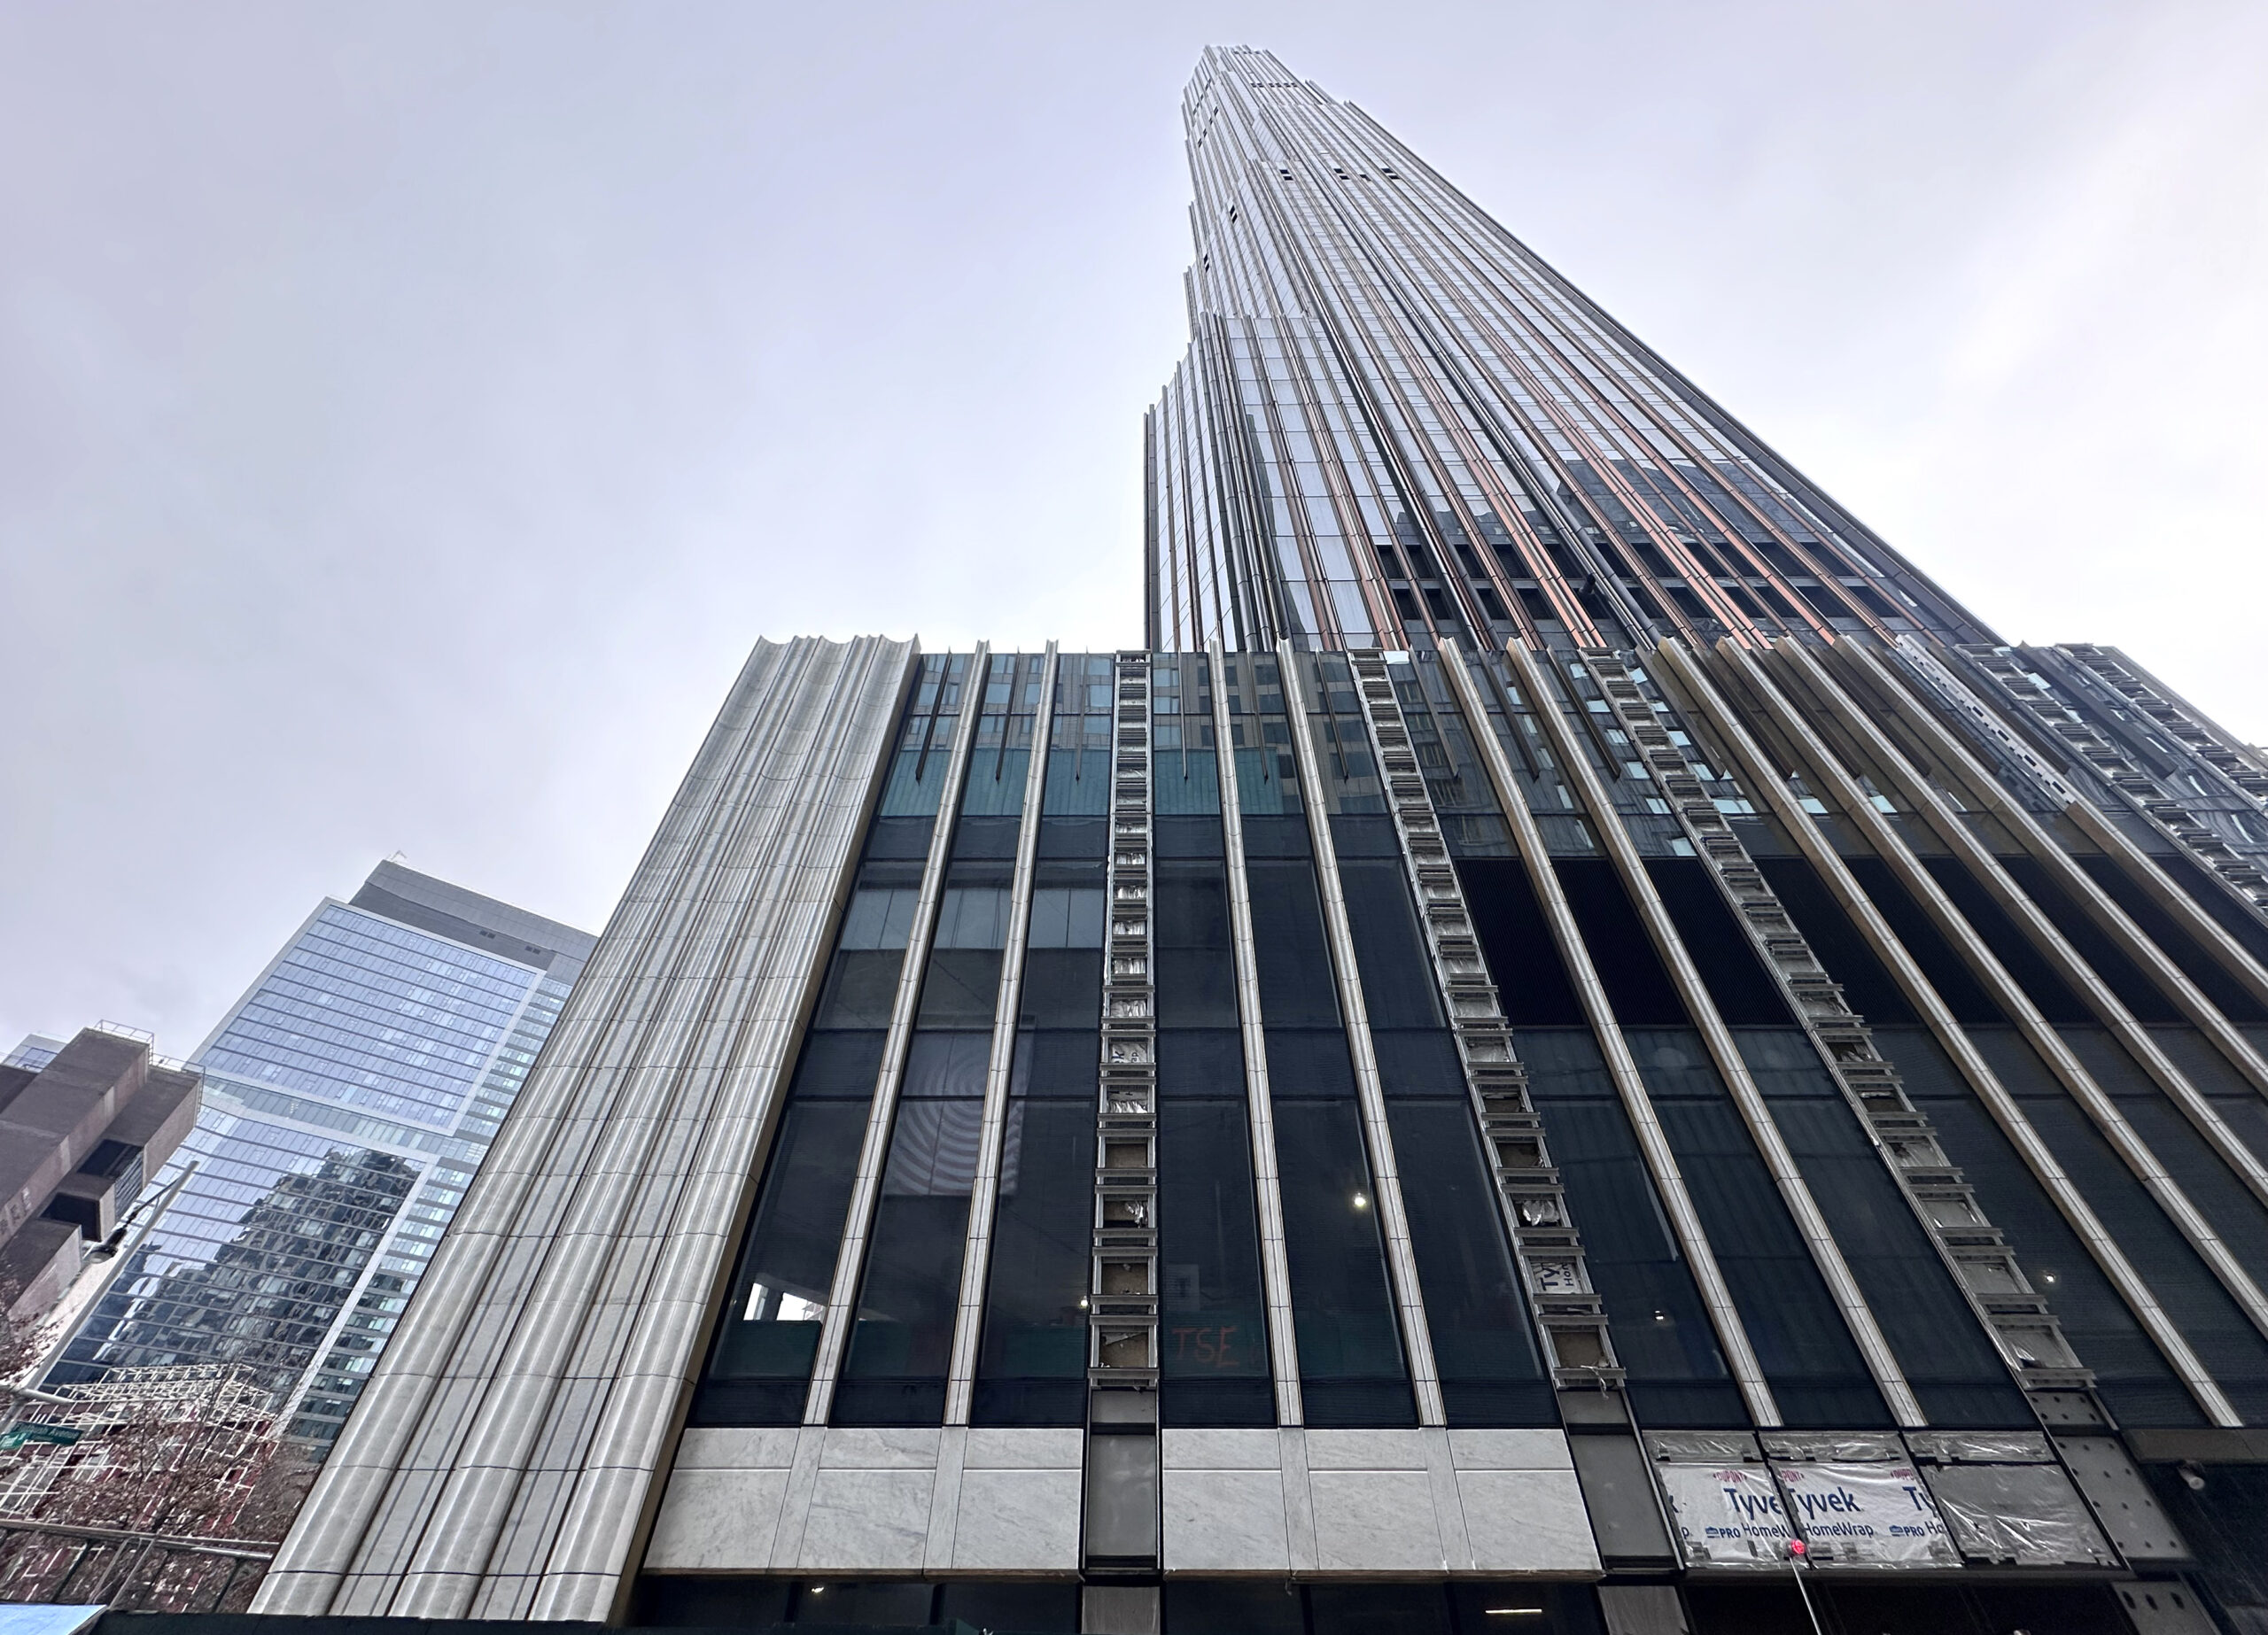
Photo by Michael Young
Average number of floors per filing per borough

Average number of floors per new construction permit per borough filed in New York City in 2024. Data source: the Department of Buildings. Data aggregation and graphics credit: Vitali D. Ogorodnikov.
The average new building permit filing in 2024 yielded an floor count of 4.1, which reaches the higher end of annual averages that YIMBY has tracked over the years. As before, average floor counts per filing reflect the density of their respective borough. Manhattan remained far ahead at nearly 13 floors per average filing, with Brooklyn and The Bronx nearly tied for second place at 5.5 and 5.2 stories per filing, respectively. Queens took the fourth place with an average of 2.9 floors per filing. Staten Island rounds off the group with an average of 2.2 stories per new building permit filing.
The following are the permits with the highest floor counts filed in 2024 in each borough:
- The Bronx: 3728 Park Avenue in Claremont (18 floors)
- Brooklyn: 376 Schermerhorn Street in Downtown Brooklyn (60 floors)
- Manhattan: 613 Madison Avenue in Midtown Manhattan (68 floors)
- Queens: 42-19 24th Street in Long Island City (38 floors)
- Staten Island: 5 Stuyvesant Place in St. George (7 floors)
As expected, Manhattan recorded the filing with the highest floor count of 2024, the 68-story supertall at 613 Madison Avenue. Brooklyn followed rather close with a planned 60-story tower at 376 Schermerhorn Street, which would become the borough’s second-tallest. Queens, hamstrung by airport proximity-driven regulations that extend throughout the borough (including Long Island City, where a number of developments were downsized by the Federal Aviation Authority’s regulations), comes in at third place, with an LIC proposal poised to rise a comparatively modest 38 stories tall at 42-19 24th Street. The Bronx, a borough with an up-and-coming skyline, features a relatively low 18-story filing at 3728 Park Avenue as its top entrant, though a number of significantly taller proposals in the pipeline promise a change for the better for the borough in the coming months. Finally, the tallest permit filing in Staten Island, at 5 Stuyvesant Place, will rise seven stories tall, a figure paltry for the city average yet rather tall for the predominantly low-rise borough.
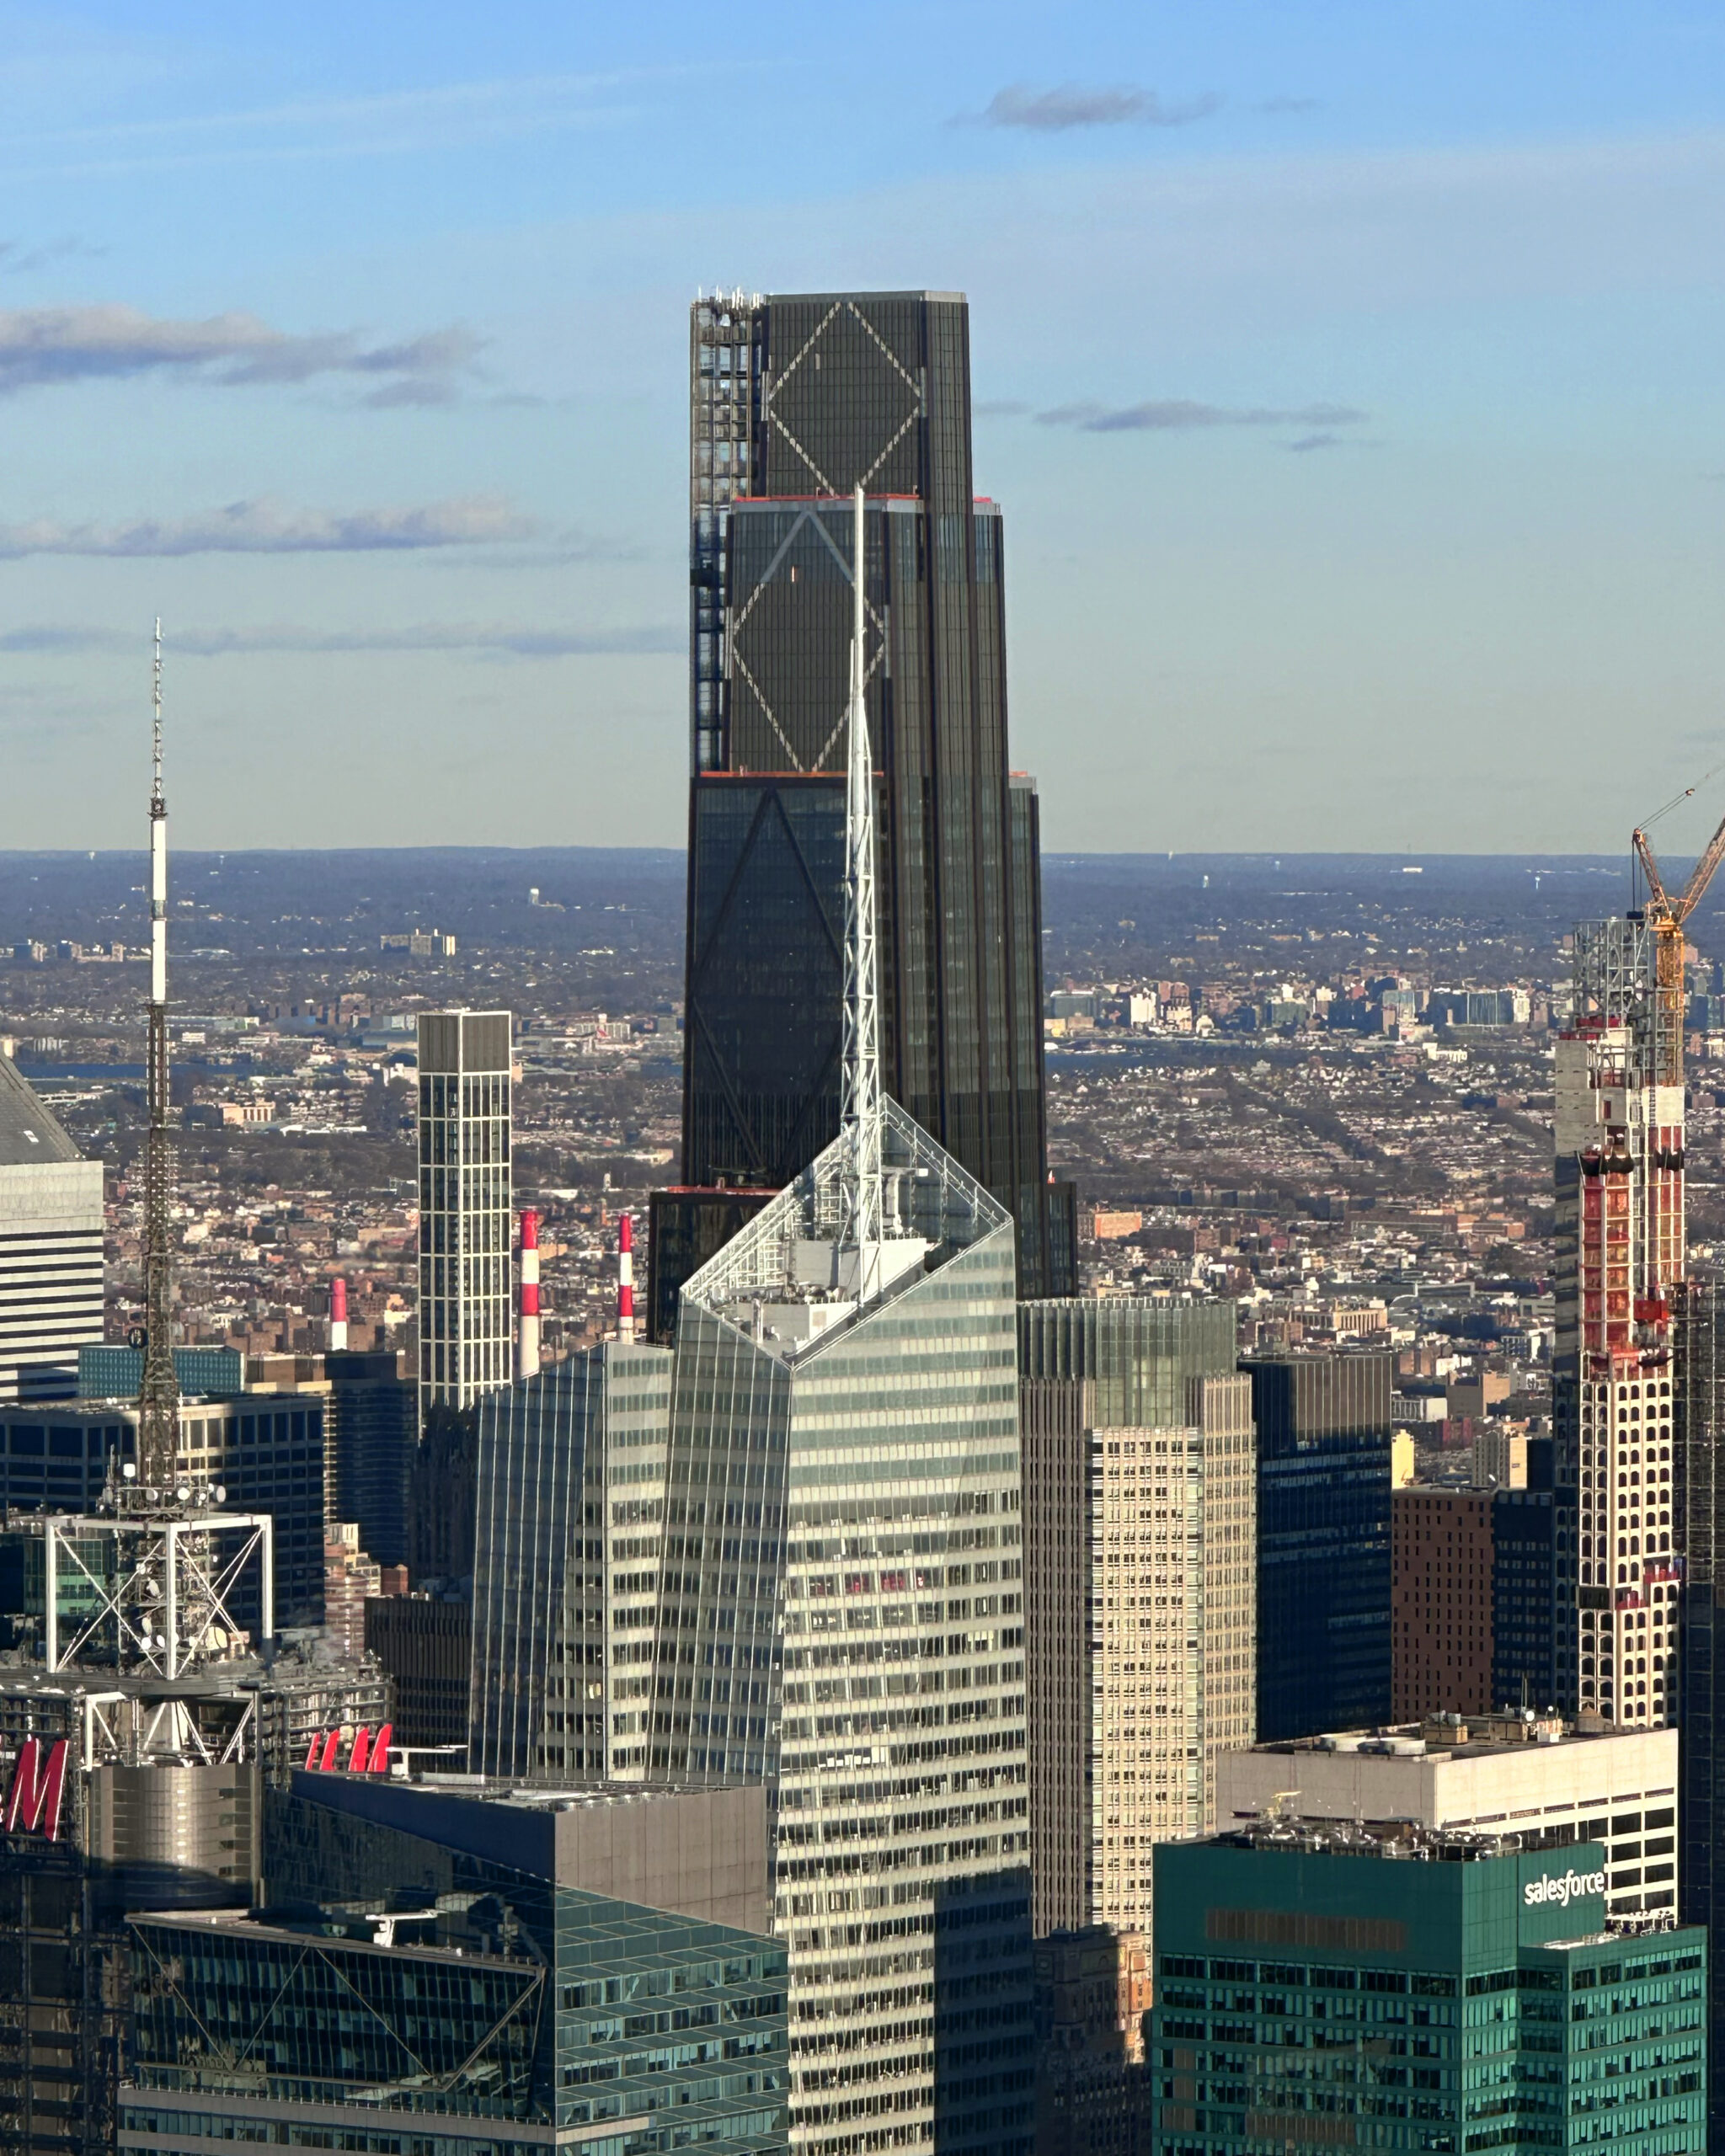
Photo by Michael Young
Permits listed by floor area per filing

New construction permits filed in New York City in 2024, grouped by total floor area. Data source: the Department of Buildings. Data aggregation and graphics credit: Vitali D. Ogorodnikov.
Compared to the previous year, 2024 saw decreases in every new building permit filing category measuring below 100,000 square feet. However, an increase in the two higher categories, which span between 100,000 and 1 million square feet, and a steady figure for filings measuring 1 million square feet and above, act as a balancing factor in the overall filed-for floor area figure.
Below is a breakdown by floor area category:
- Under 1,000 square feet: 9-percent decrease (518 new building permits filed in 2023 to 471 permits filed in 2024)
- 1,000 to 2,999 SF: 52-percent decrease (799 to 386 permits)
- 3,000 to 4,999 SF: 46-percent decrease (1,285 to 699)
- 5,000 to 9,999 SF: 46-percent decrease (773 to 418)
- 10,000 to 49,999 SF: 27-percent decrease (590 to 431)
- 50,000 to 99,999 SF: 9-percent decrease (164 to 150)
- 100,000 to 499,999 SF: 6-percent increase (168 to 178)
- 500,000 to 999,999 SF: 11-percent increase (9 to 10)
- 1,000,000 SF and over SF: no change (one in each year)
Below are the top ten new building permits with the largest floor area filed in 2024, in order:
- 275 Atlantic Avenue in Downtown Brooklyn (1,008,700 square feet)
- 980 East 149th Street in Port Morris, The Bronx (986,360 SF)
- 574 Fifth Avenue in Midtown, Manhattan (875,720 SF)
- 613 Madison Avenue in Midtown, Manhattan (757,430 SF)
- 80 Clarkson Street in West Village, Manhattan (679,952 SF)
- 376 Schermerhorn Street in Downtown Brooklyn (639,873 SF)
- 126-87 Willets Point Boulevard in Willets Point, Queens (612,205 SF)
- 2-33 50th Avenue in Long Island City, Queens (562,607 SF)
- 407 West 206th Street in Inwood, Manhattan (537,702 SF)
- 126-43 39th Avenue in Willets Point, Queens (527,158 SF)
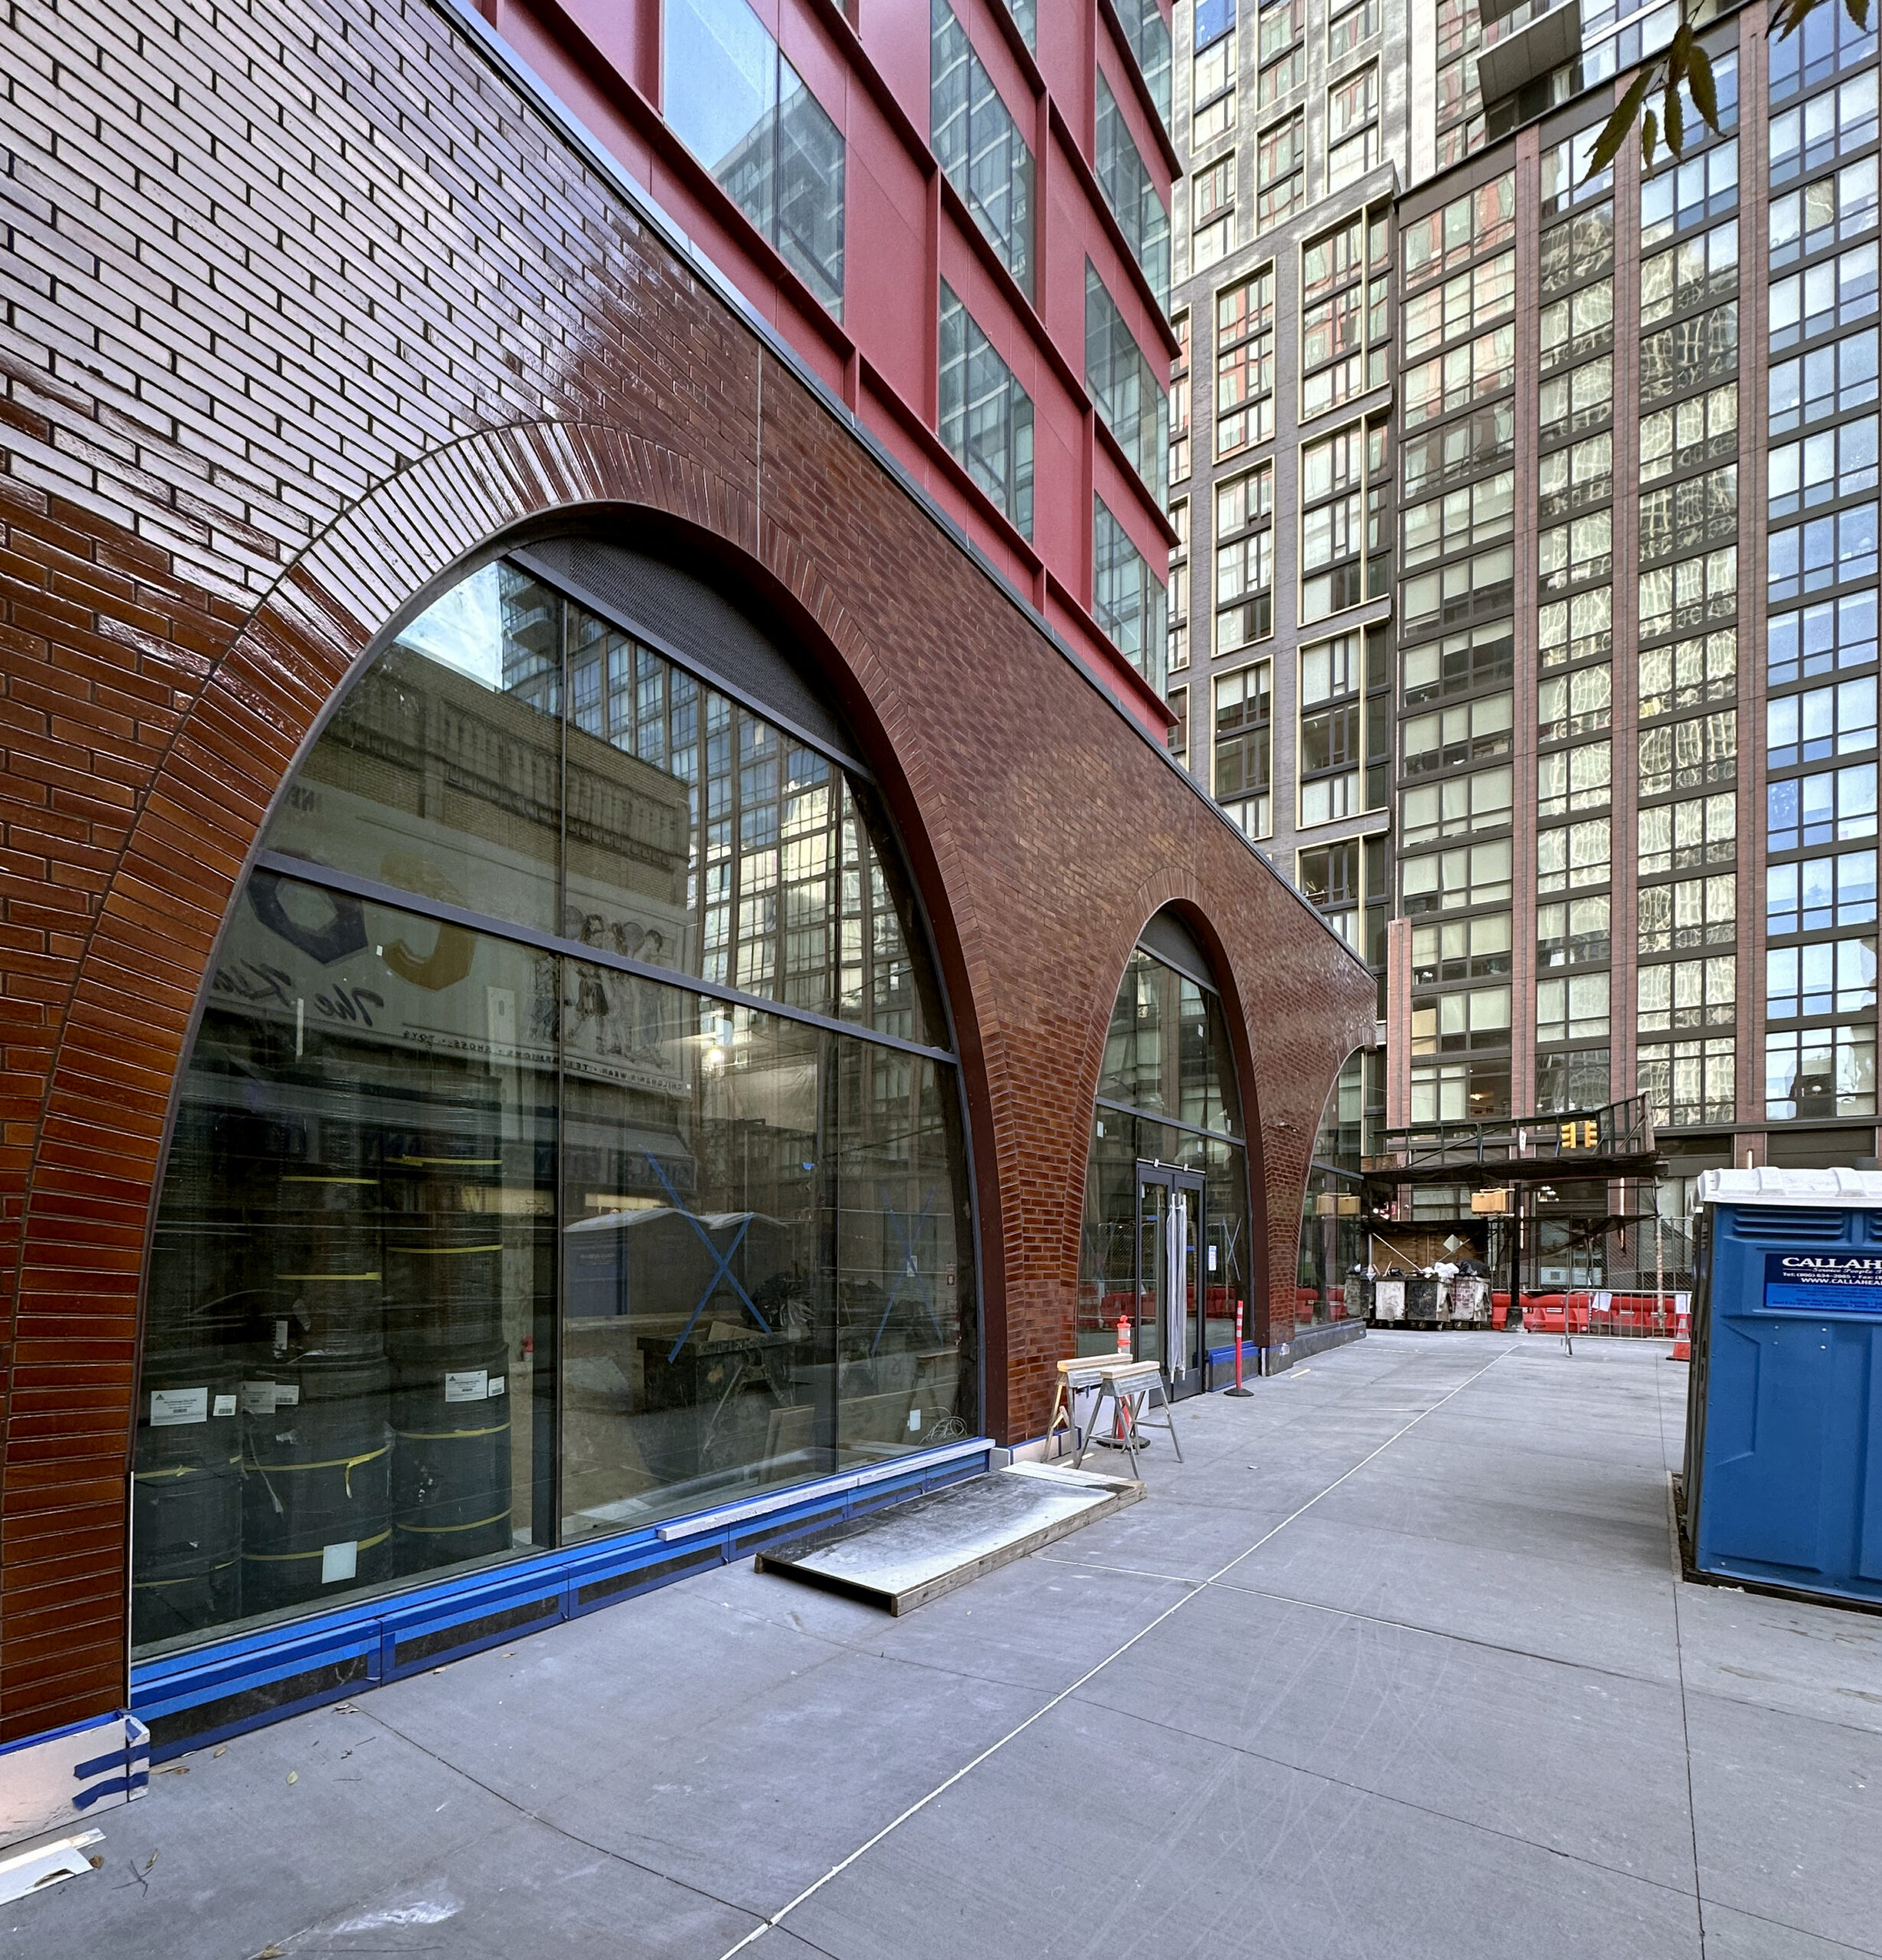
Photo by Michael Young
Total floor area filed by borough

Combined floor area of new construction permits filed per borough in New York City in 2024. Data source: the Department of Buildings. Data aggregation and graphics credit: Vitali D. Ogorodnikov.
In 2024, new building square footage figures remained consistent with the previous year’s. Two boroughs displayed notable gains, with 5- and 10-percent gains in Brooklyn and Manhattan, respectively. In turn, The Bronx, Queens, and Staten Island registered decreases in overall filed-for square footage. While Staten Island displays the highest percentage drop between the two years at 63 percent, its overall drop accounts for less than 1 million square feet, a paltry figure in the city’s overall statistics for the year.
Below are the square footage totals per borough compared between 2023 and 2024:
- The Bronx: 10-percent decrease (13.2 million square feet filed in new building permits in 2023 to 11.9 MSF filed in 2024)
- Brooklyn: 5-percent increase (28.3 to 29.7 MSF)
- Manhattan: 10-percent increase (10.2 to 11.2 MSF)
- Queens: 19-percent decrease (20.1 to 16.3 MSF)
- Staten Island: 63-percent decrease (6.2 to 2.3 MSF)
The following are the permits with the largest floor area filed in 2024 in each borough:
- The Bronx: 980 East 149th Street in Port Morris (986,360 square feet)
- Brooklyn: 275 Atlantic Avenue in Downtown Brooklyn (1,008,700 SF)
- Manhattan: 574 Fifth Avenue in Midtown, Manhattan (875,720 SF)
- Queens: 126-87 Willets Point Boulevard in Willets Point (612,205 SF)
- Staten Island: 45 Cleveland Place in Concord (184,800 SF)
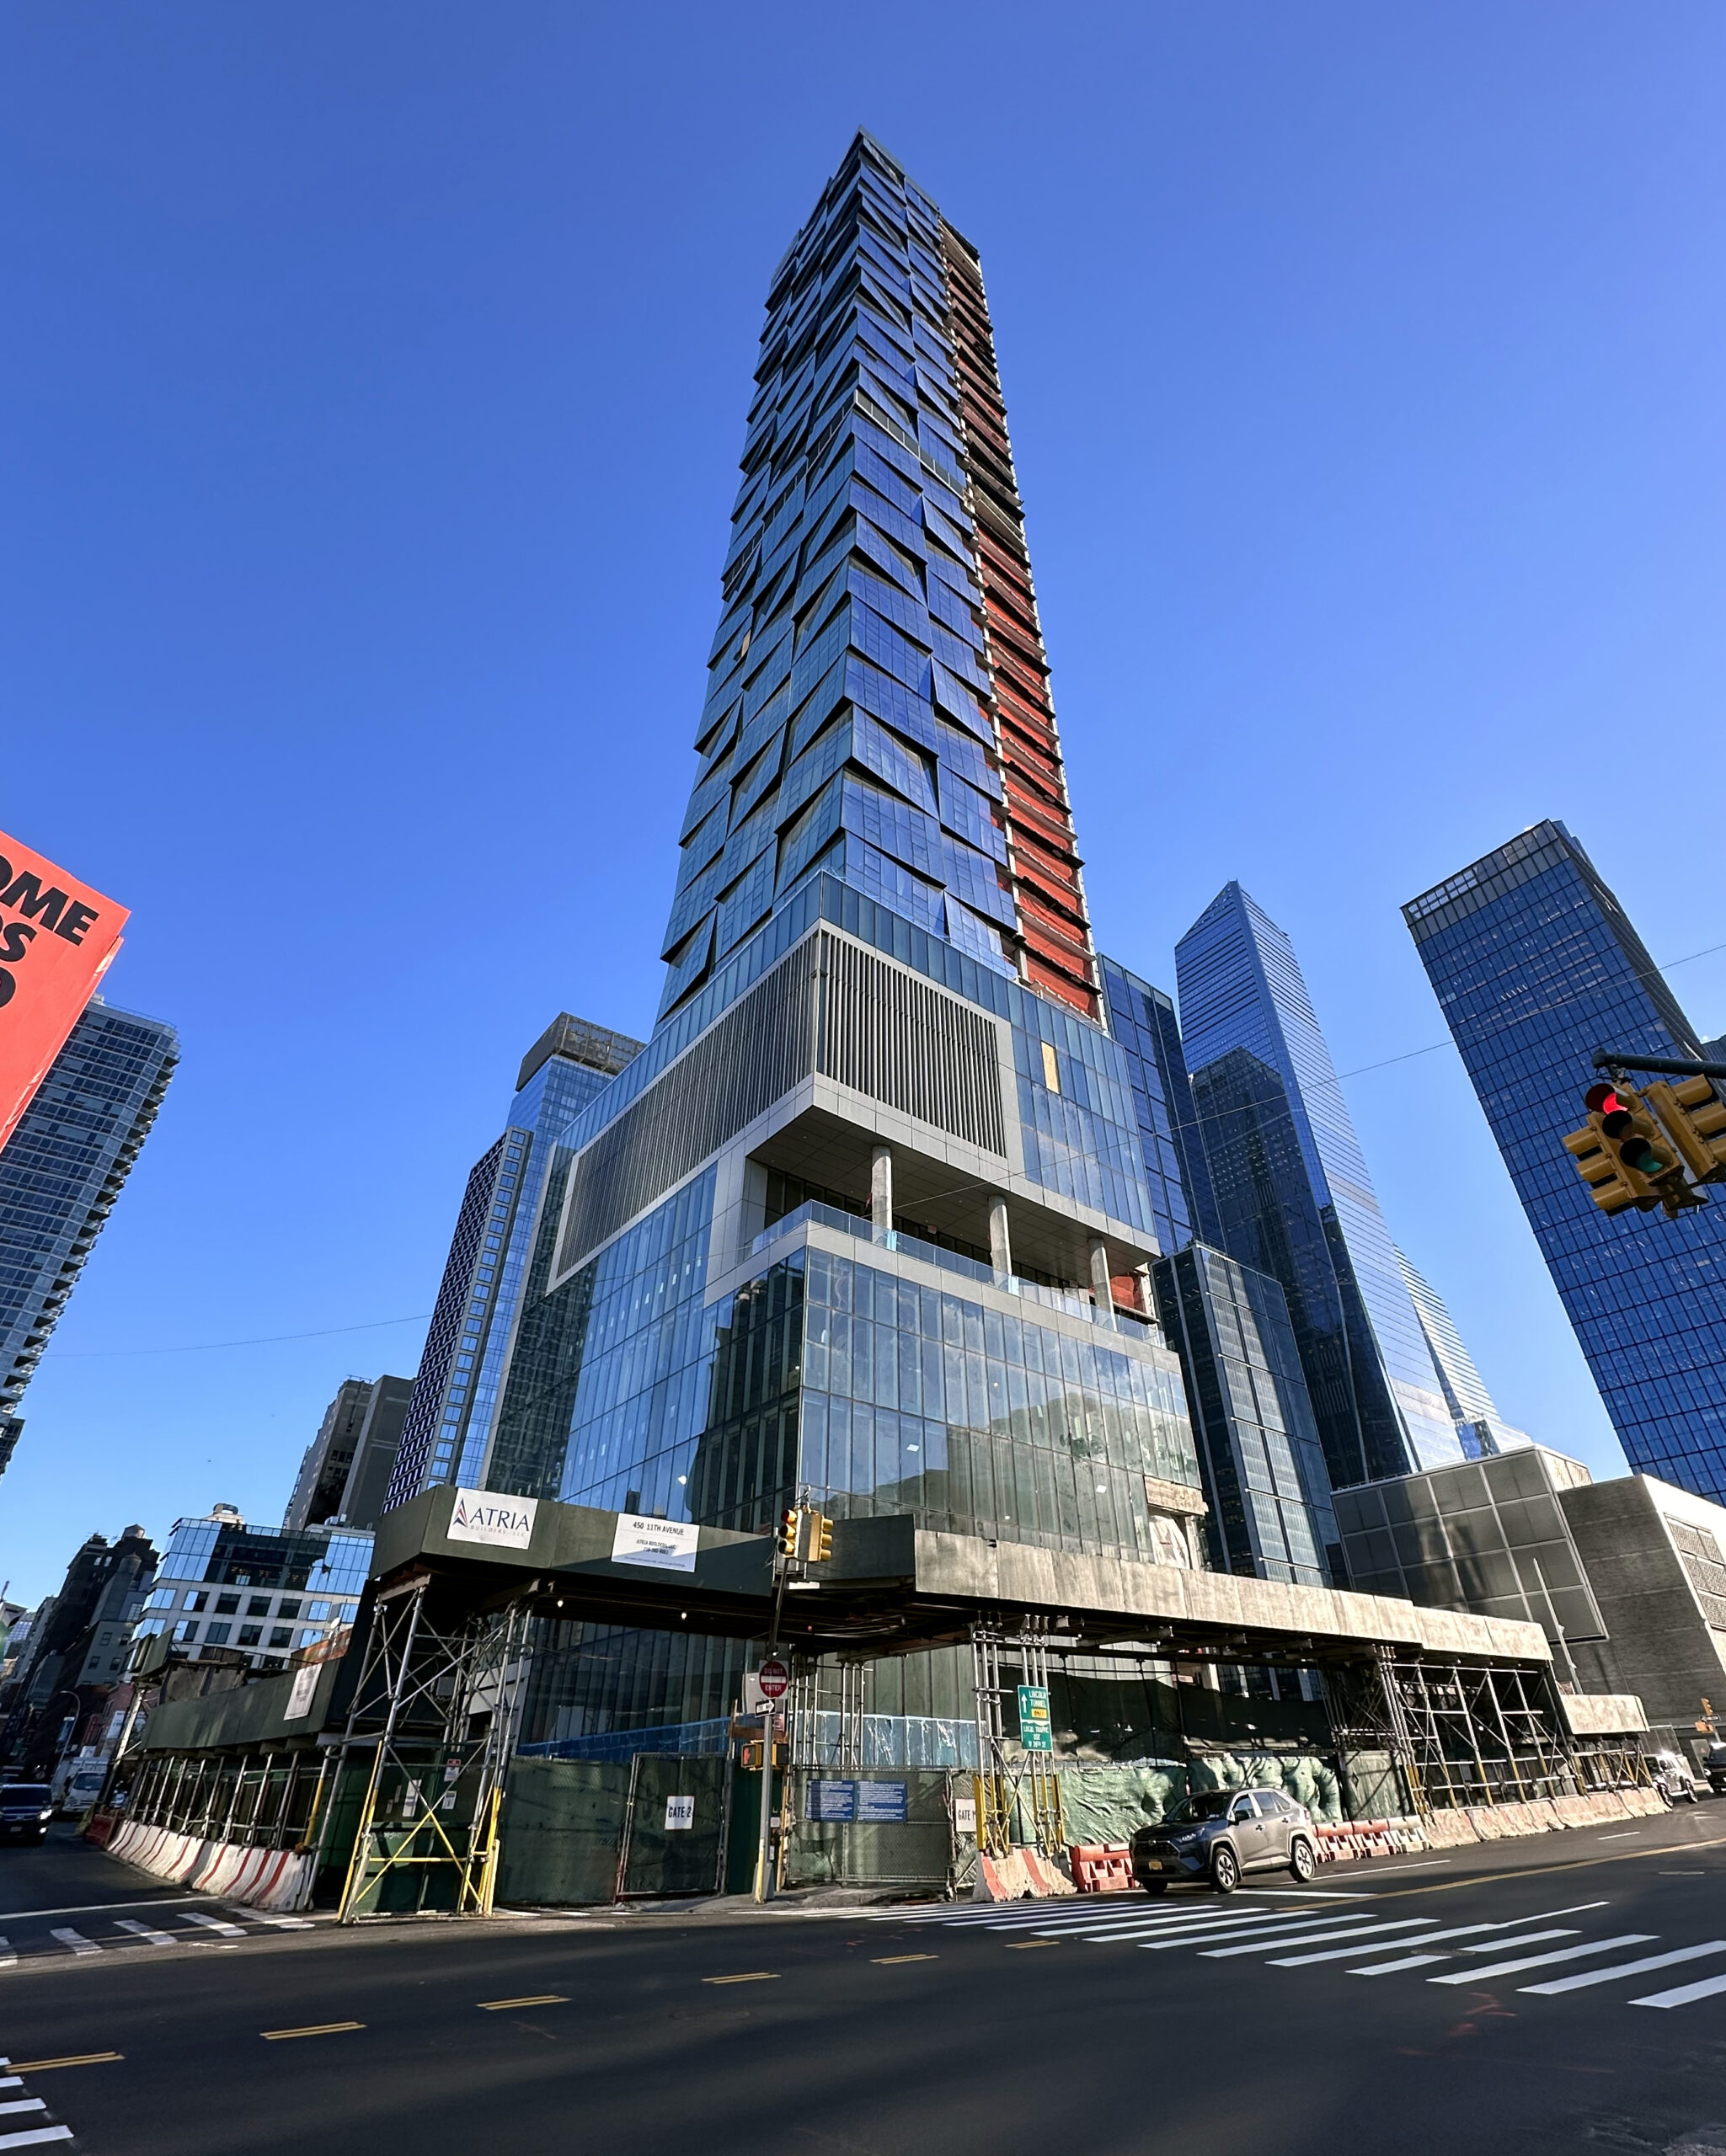
Photo by Michael Young
Average floor area per permit filing by borough

Combined floor area of new construction permits filed per borough in New York City in 2024. Data source: the Department of Buildings. Data aggregation and graphics credit: Vitali D. Ogorodnikov.
In 2024, three of the city’s five boroughs registered increases in their average floor area sizes per filing, ranging from 3 percent for The Bronx to 69 percent in Brooklyn. In turn, Queens and Staten Island showed drops of 22 and 19 percent, respectively, though both boroughs’ relative small average floor area spans per filing make the negative downward trend less significant.
Below is the comparison for the boroughs between 2023 and 2024:
- The Bronx: 3-percent increase (31,634 square feet per average new building permit filing in 2023 to 32,467 SF in 2024)
- Brooklyn: 69-percent increase (24,507 to 41,343 SF)
- Manhattan: 24-percent increase (92,428 to 115,024 SF)
- Queens: 22-percent decrease (20,776 to 16,304 SF)
- Staten Island: 15-percent decrease (4,767 to 4,048 SF)
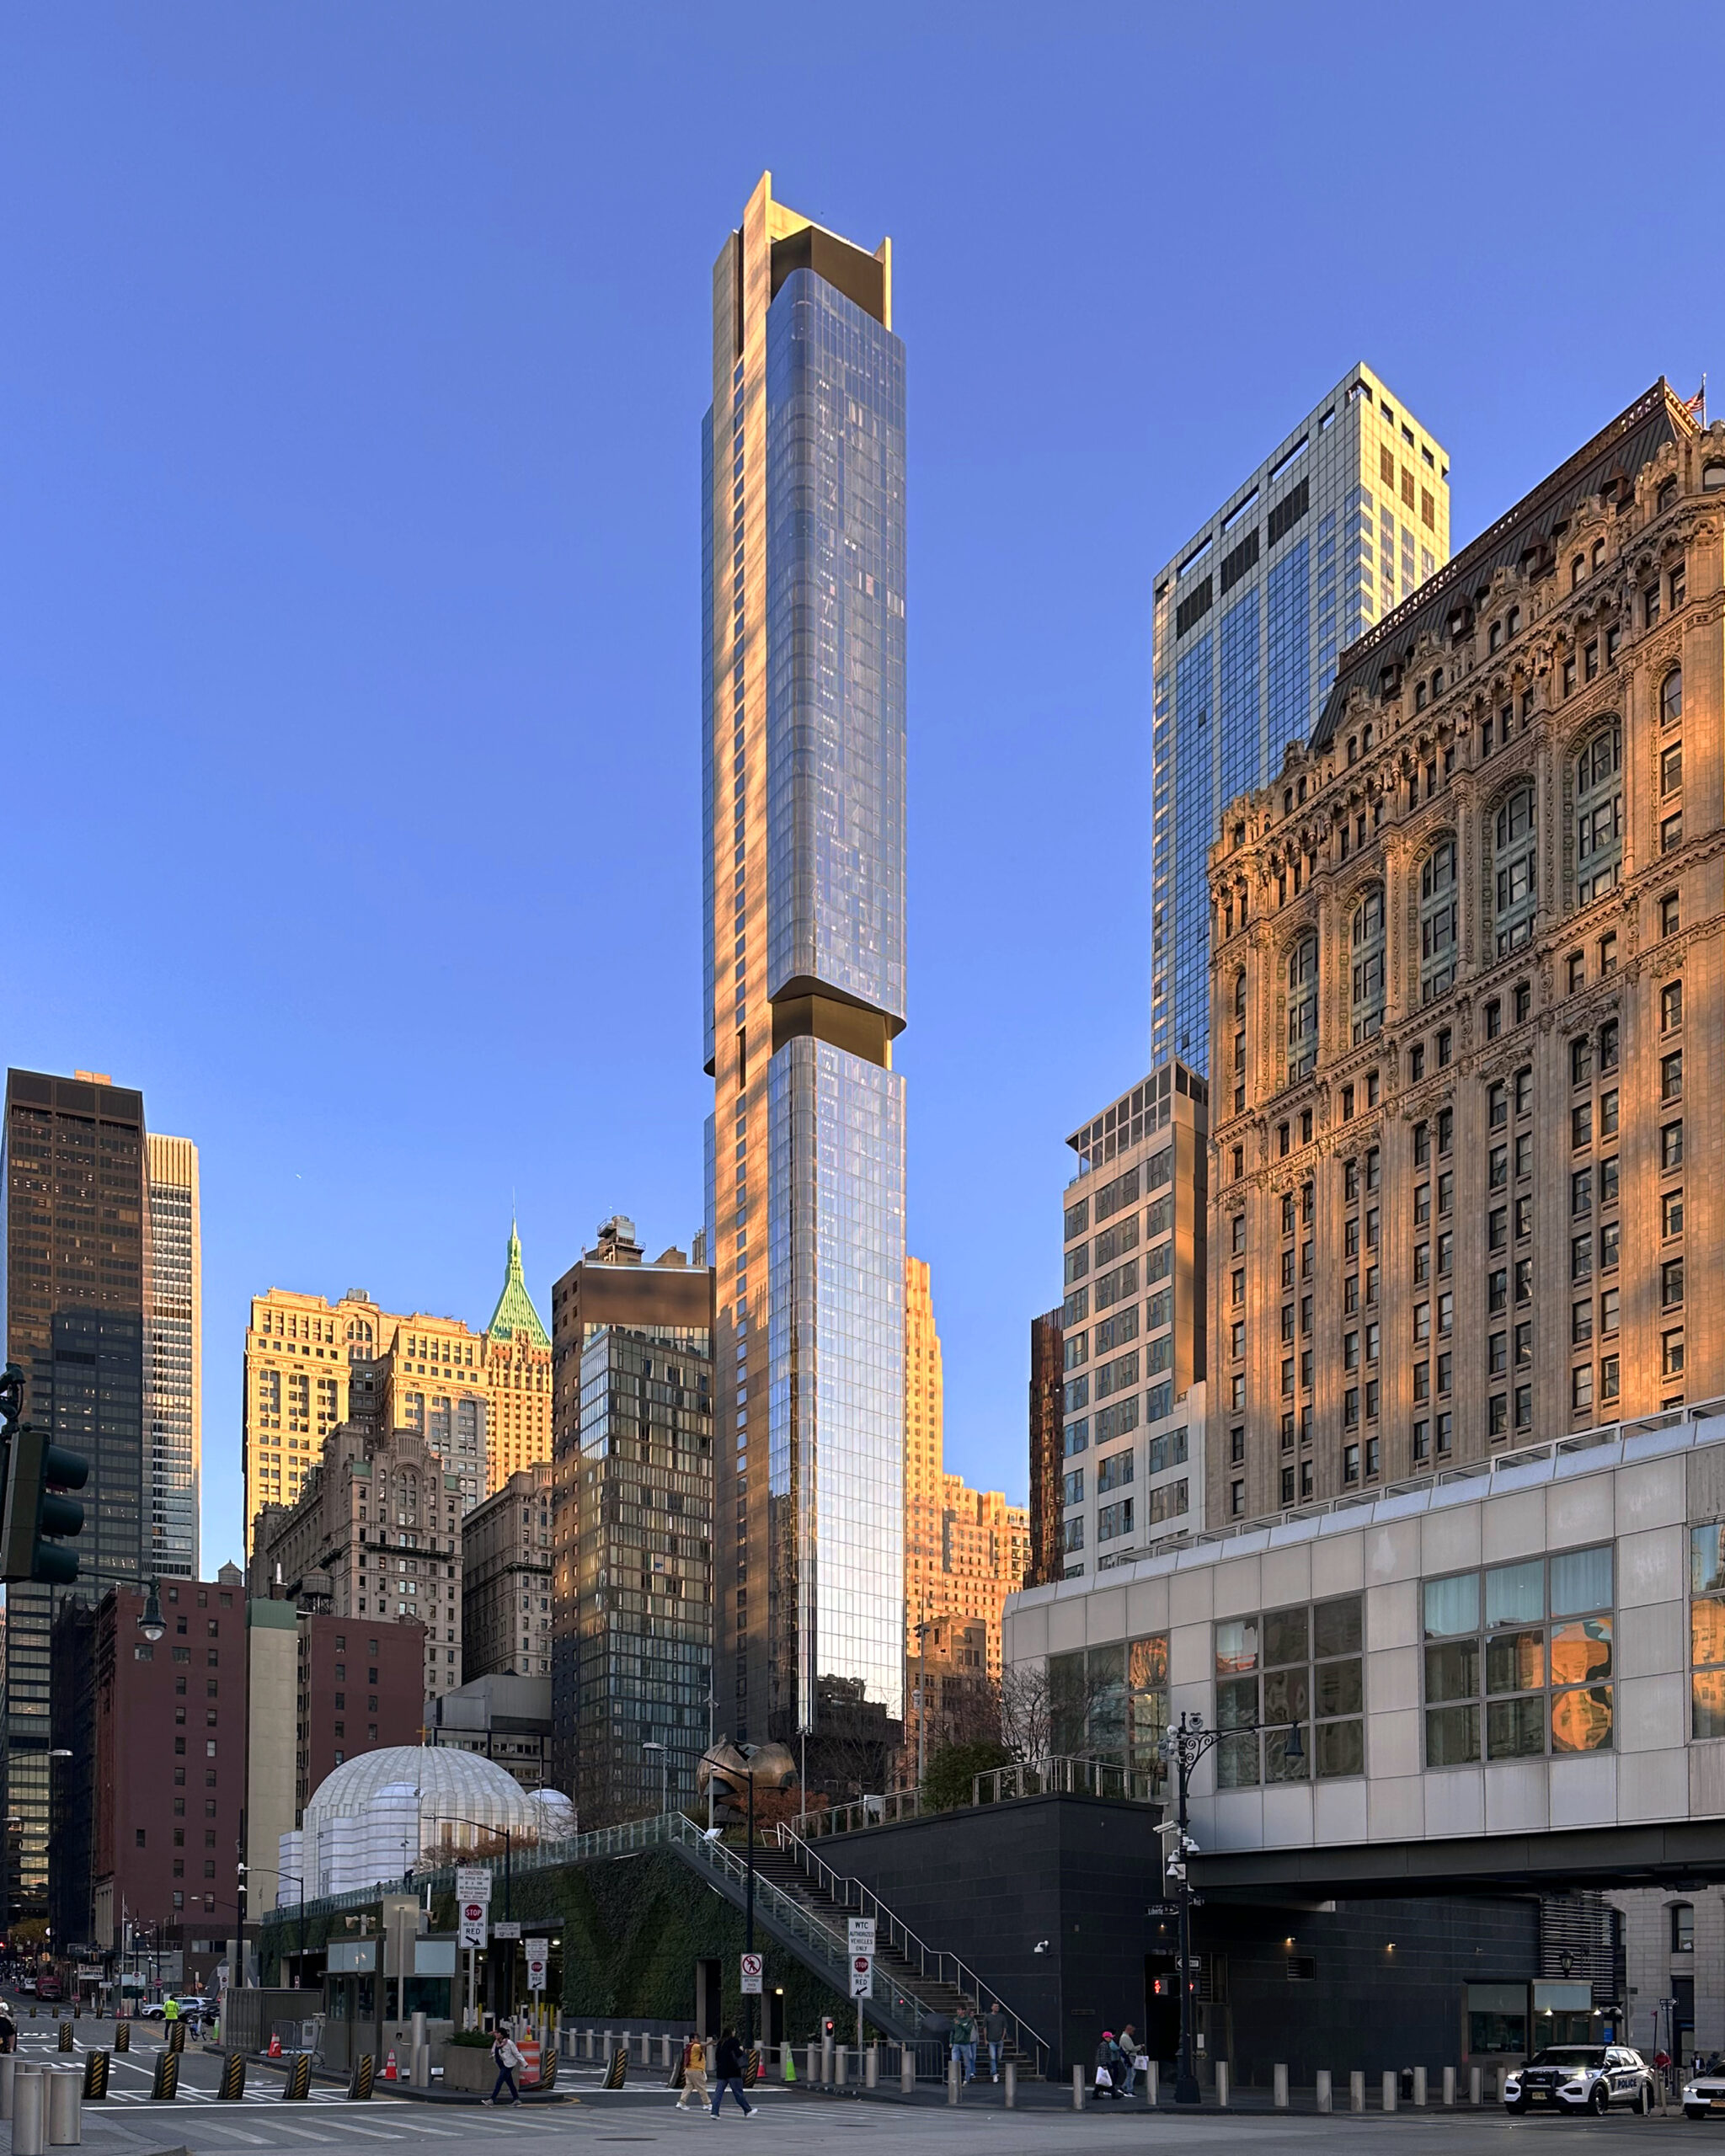
Photo by Michael Young
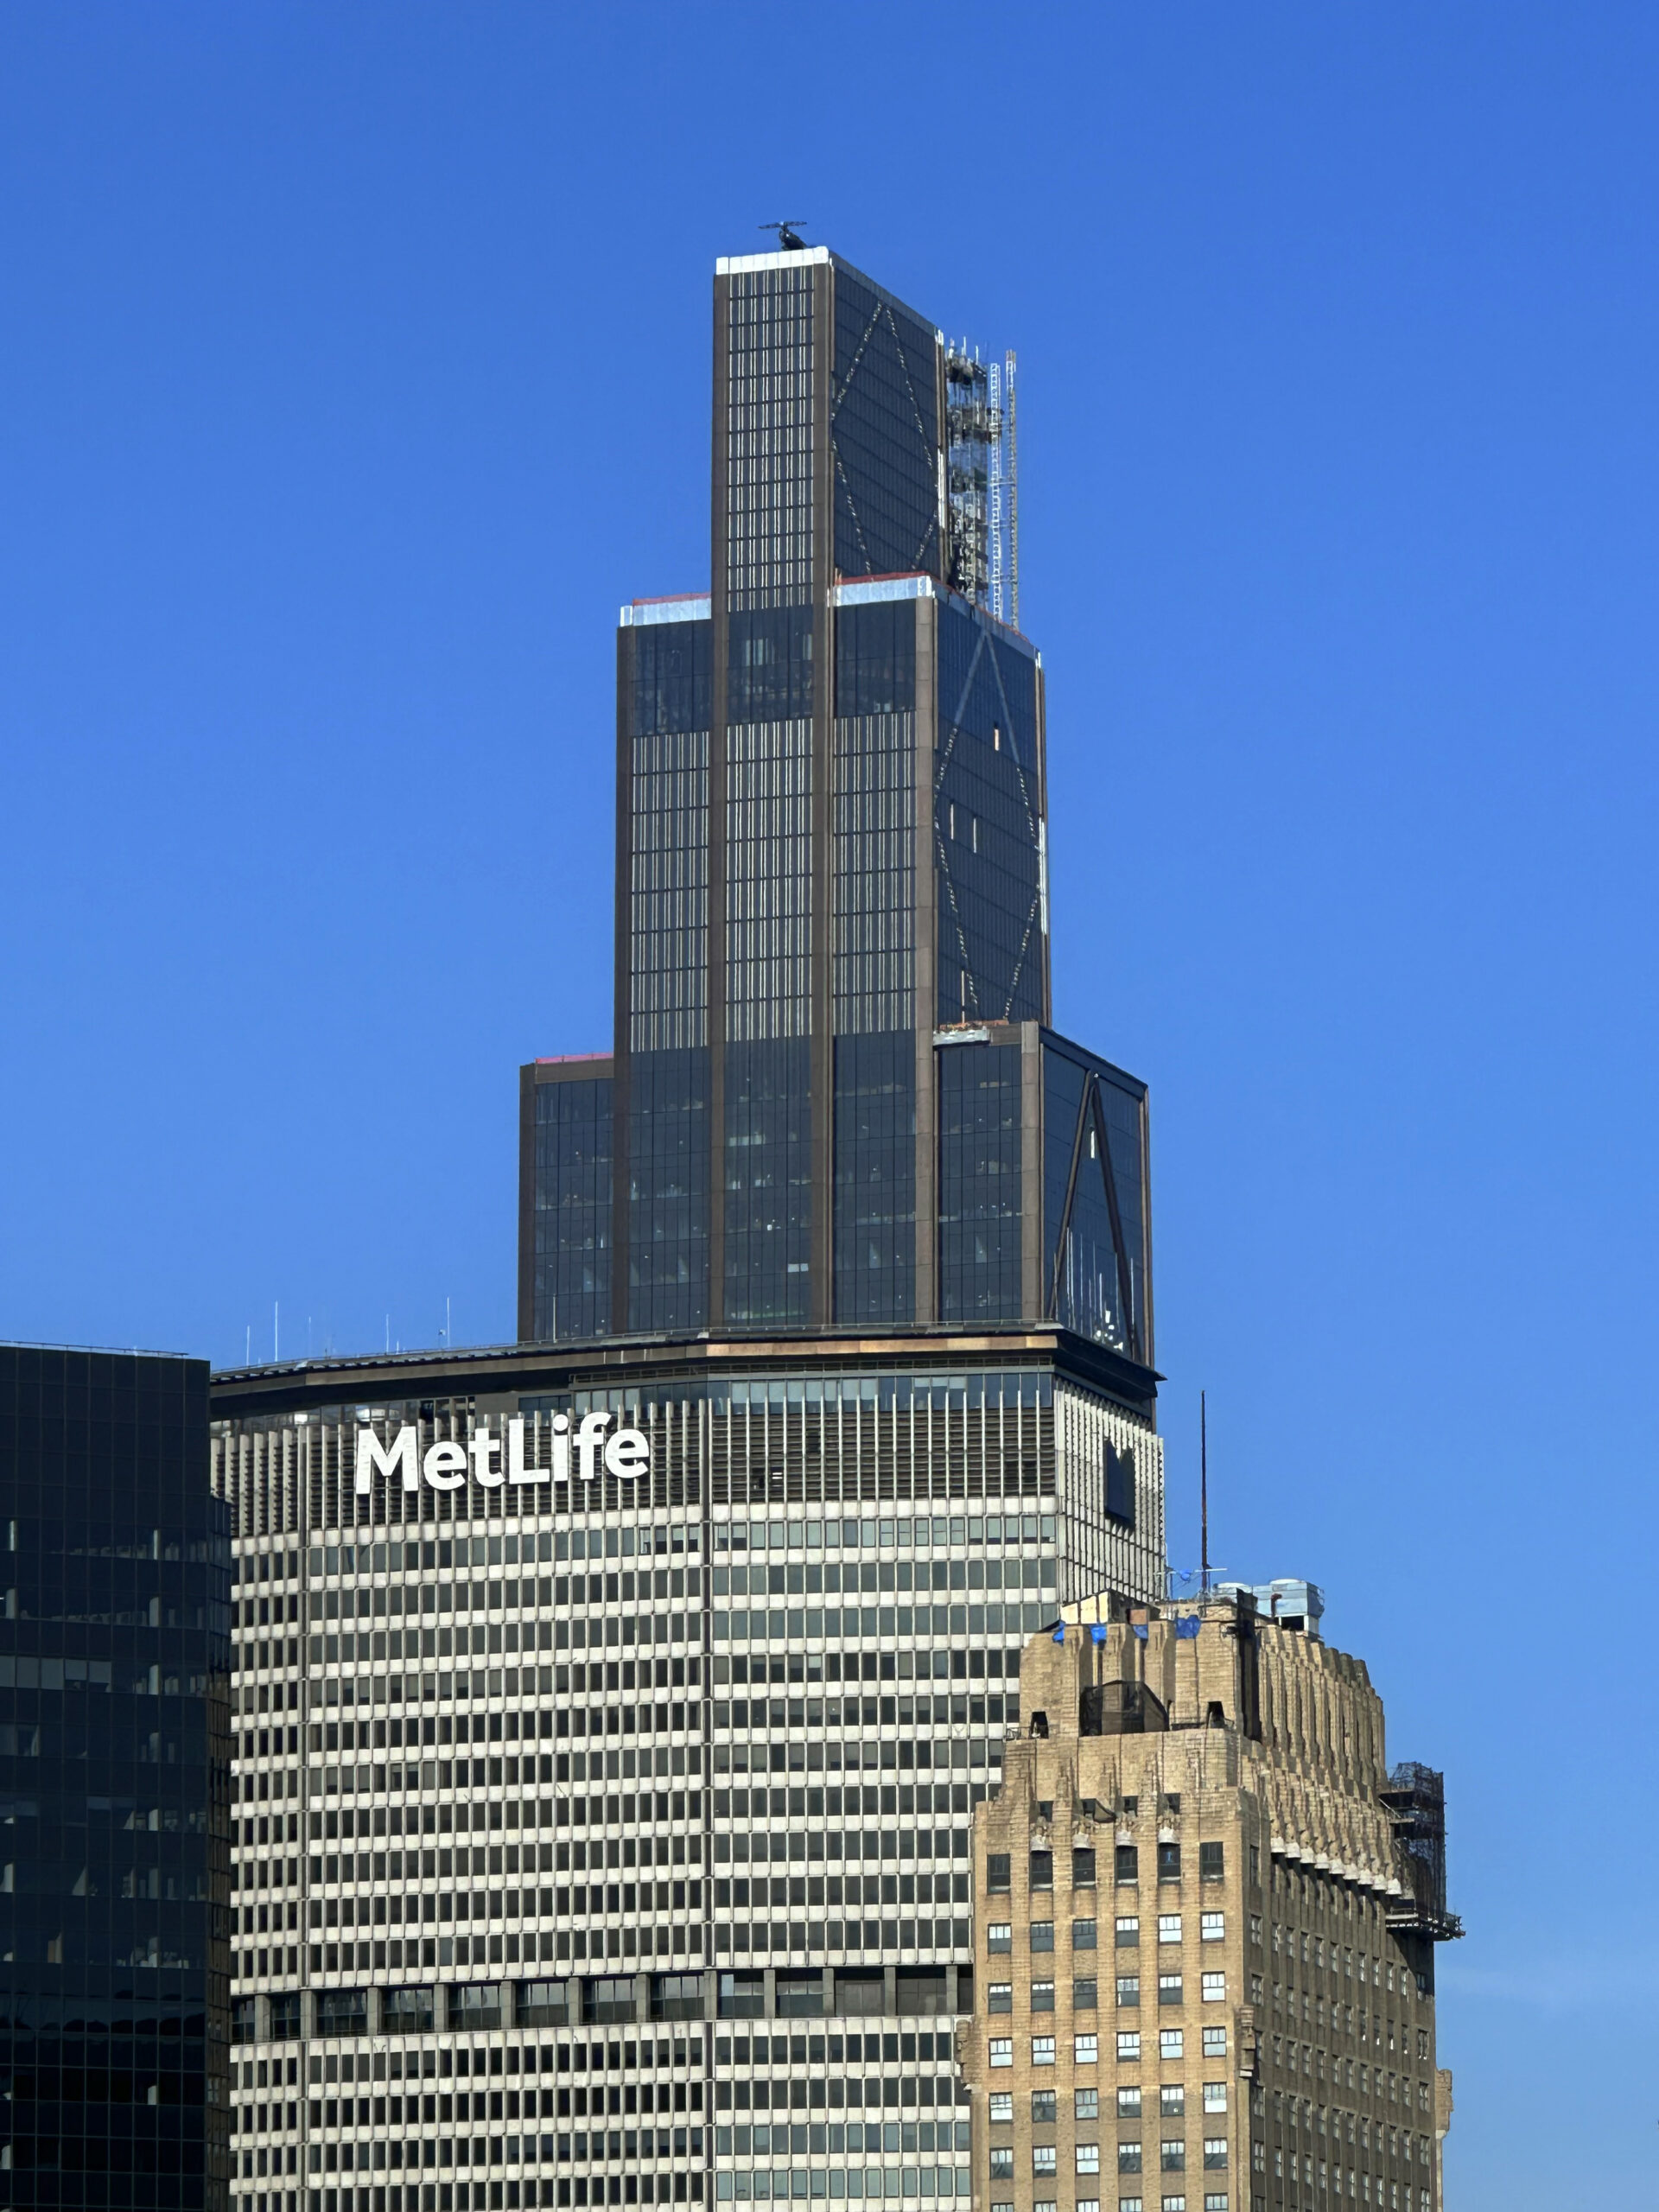
Photo by Michael Young
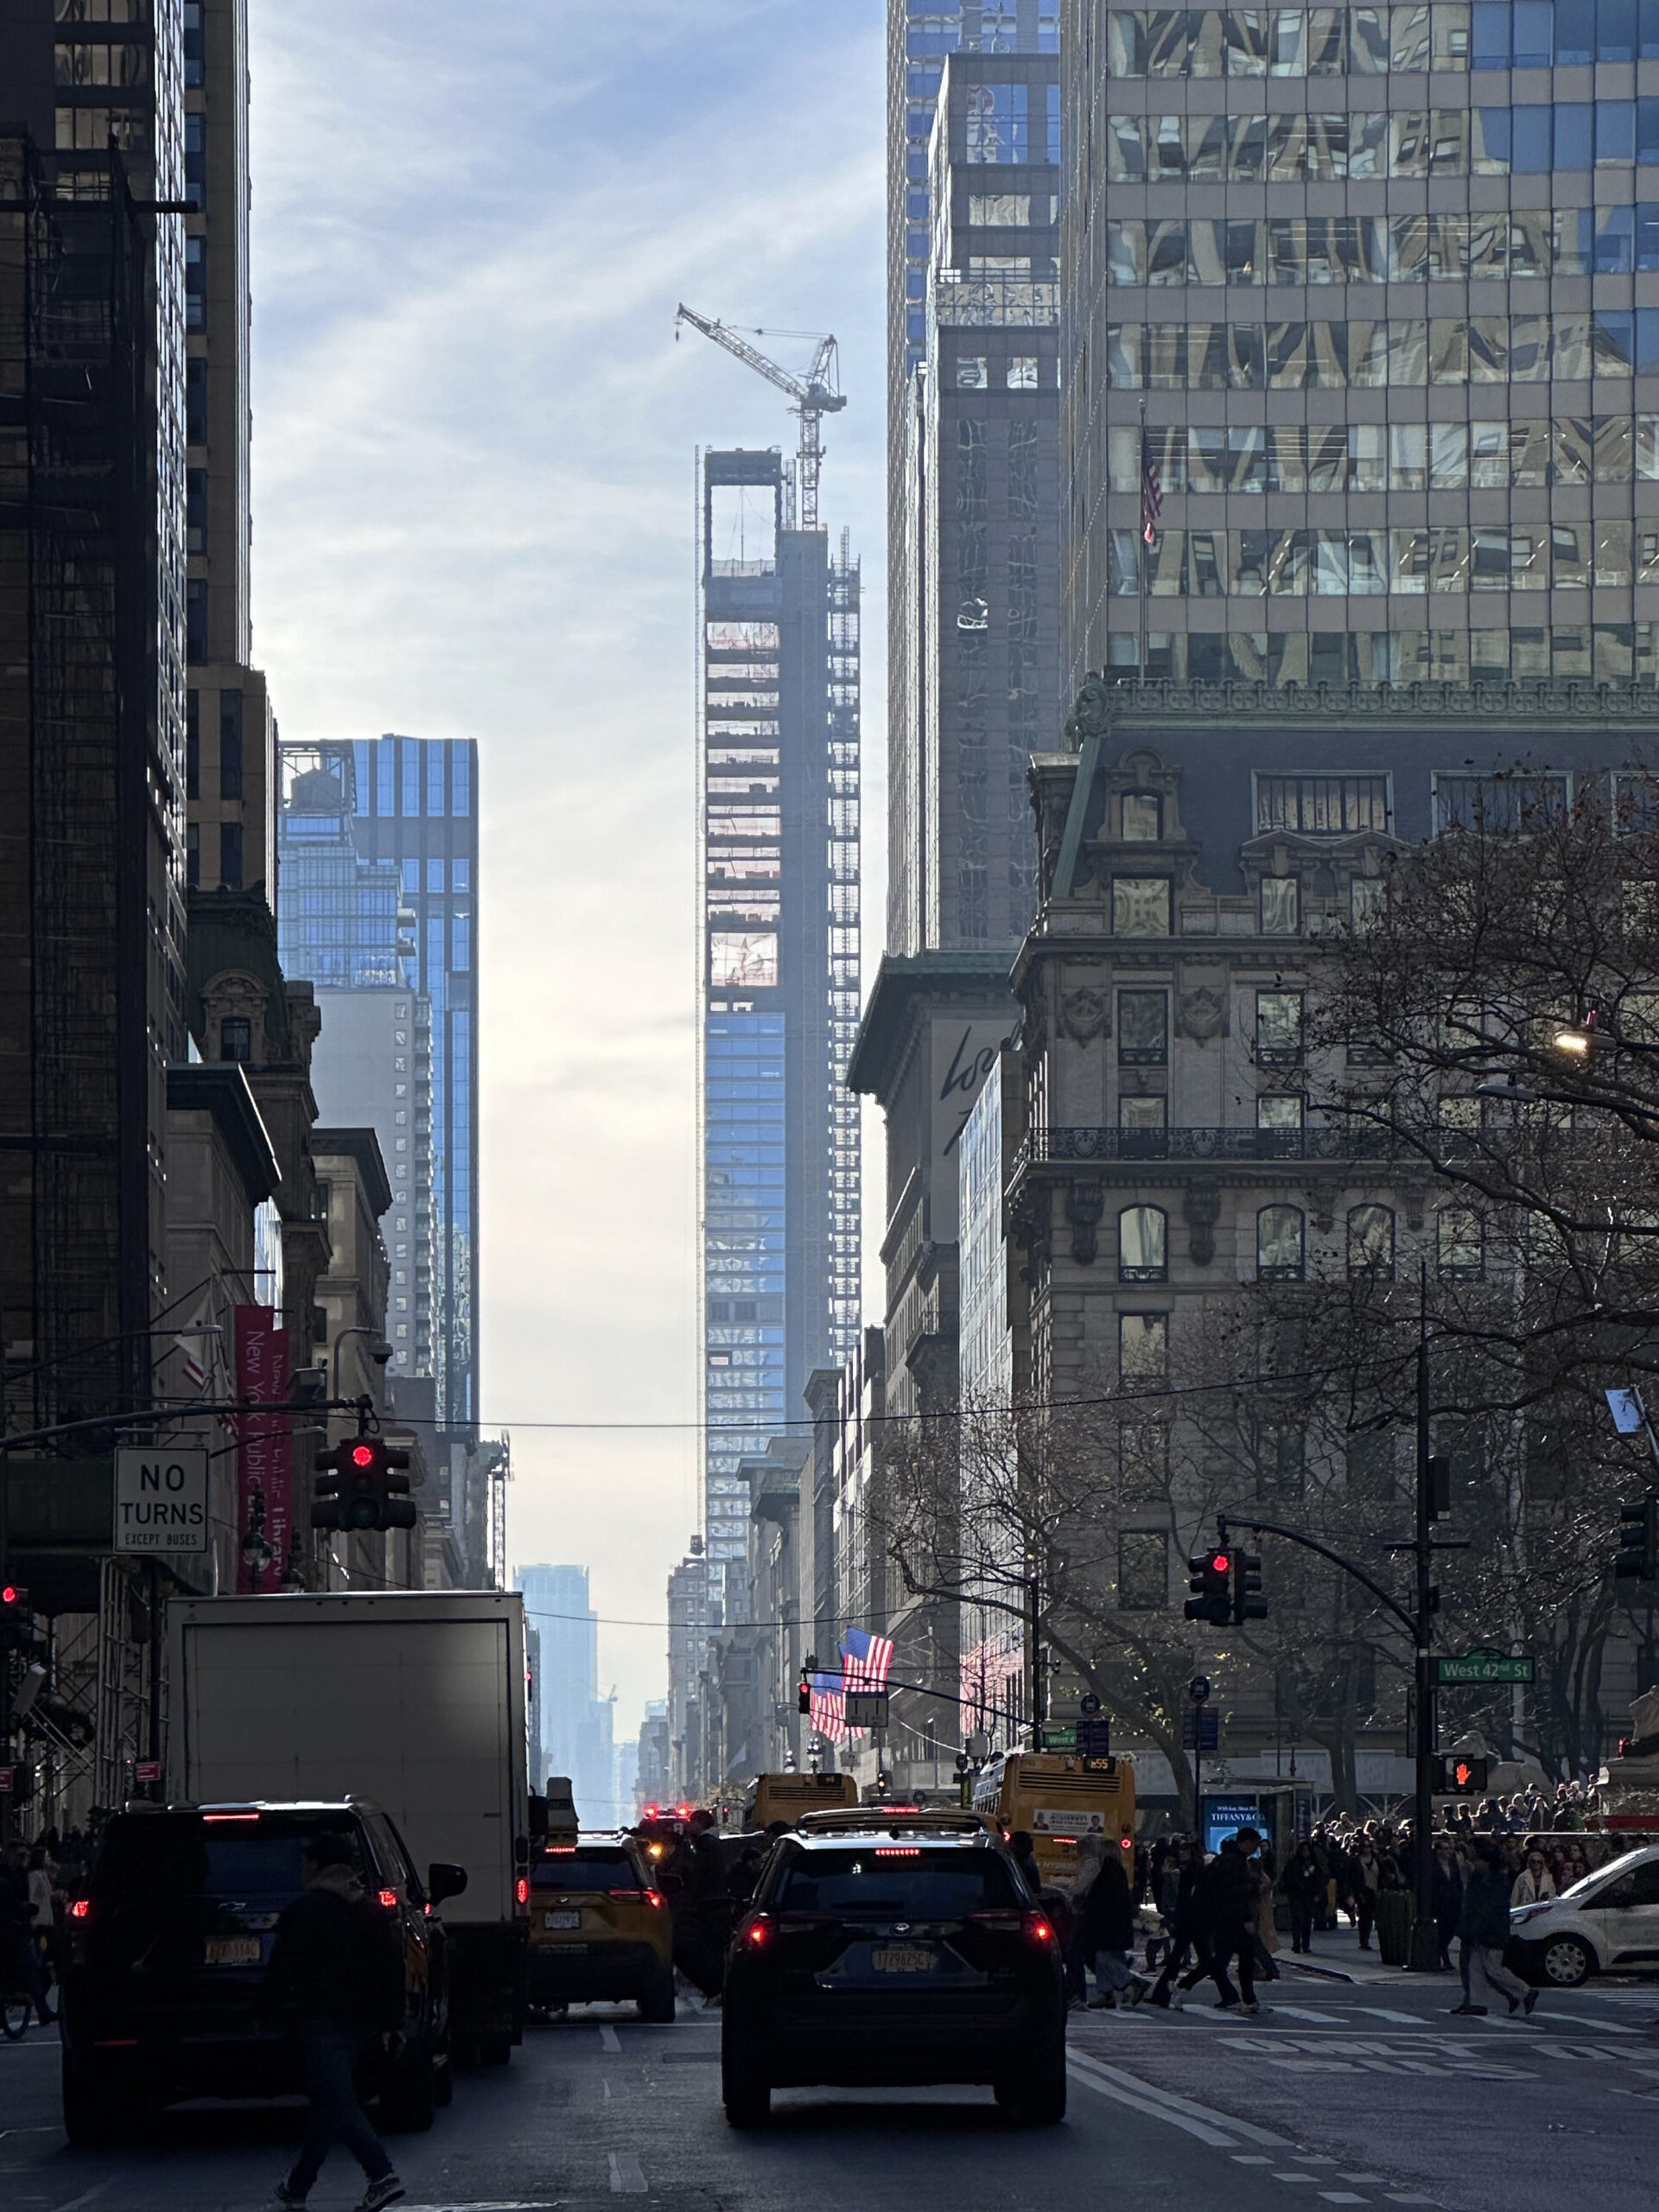
Photo by Michael Young
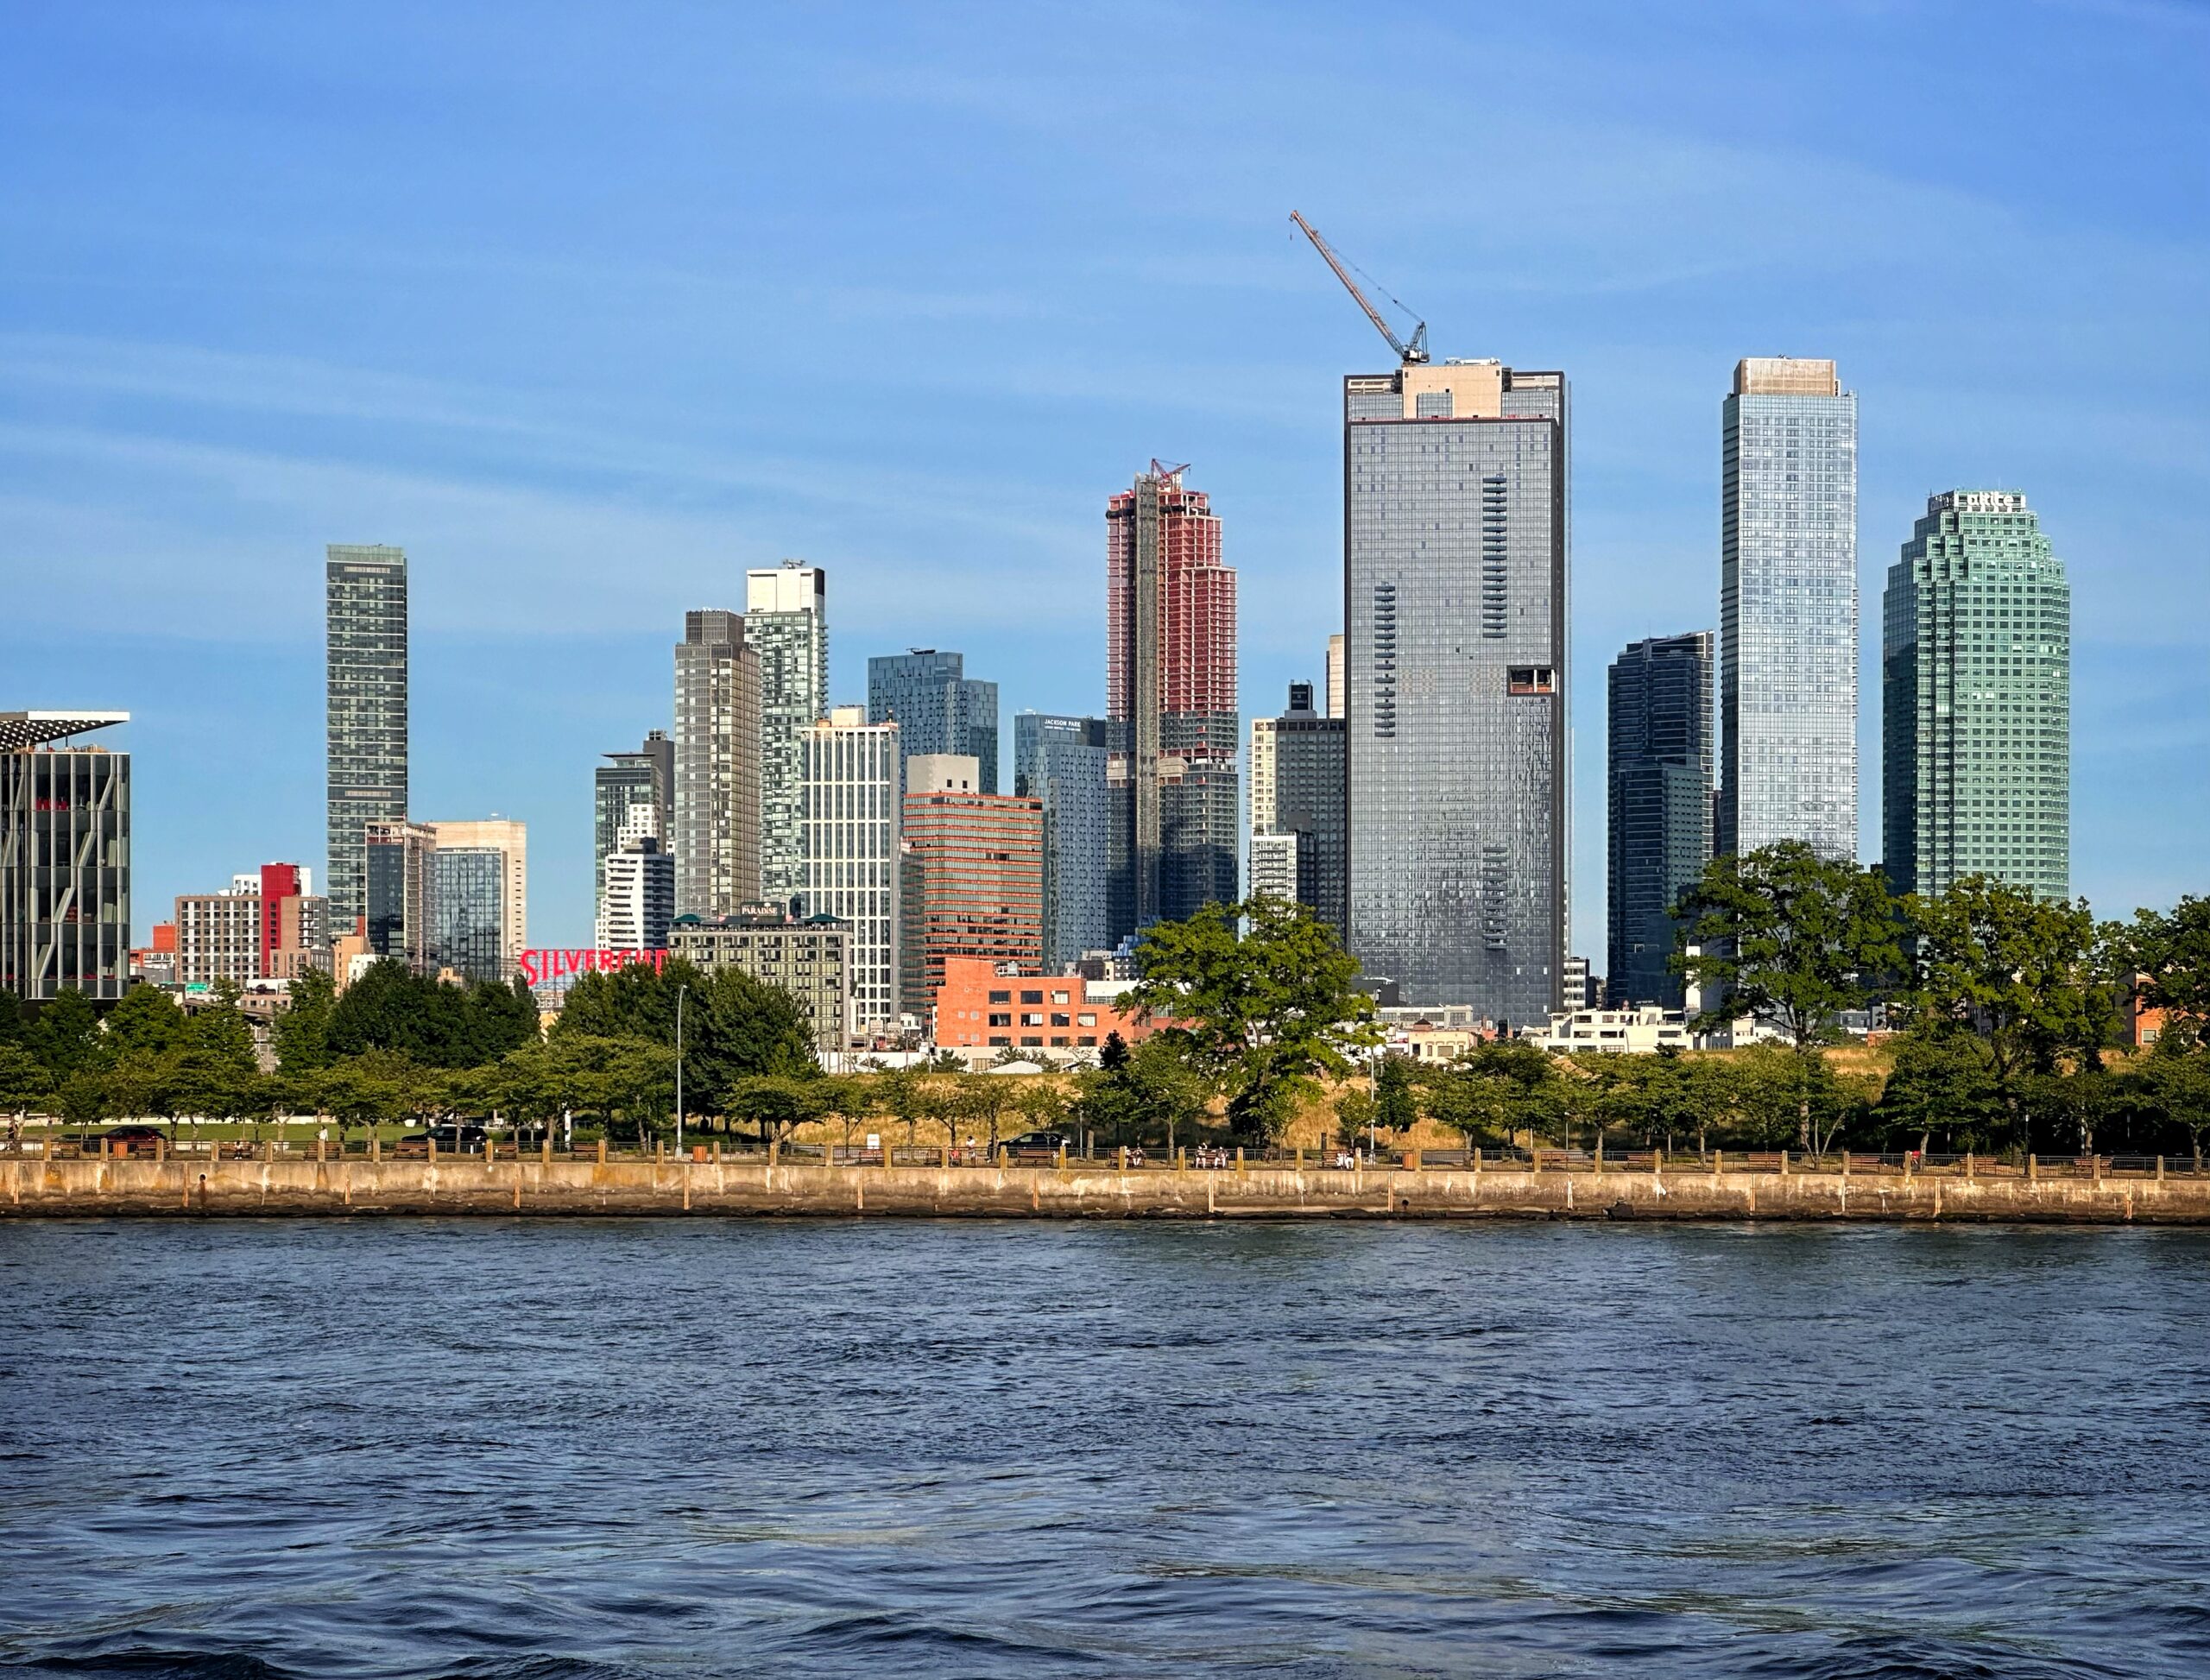
Photo by Michael Young
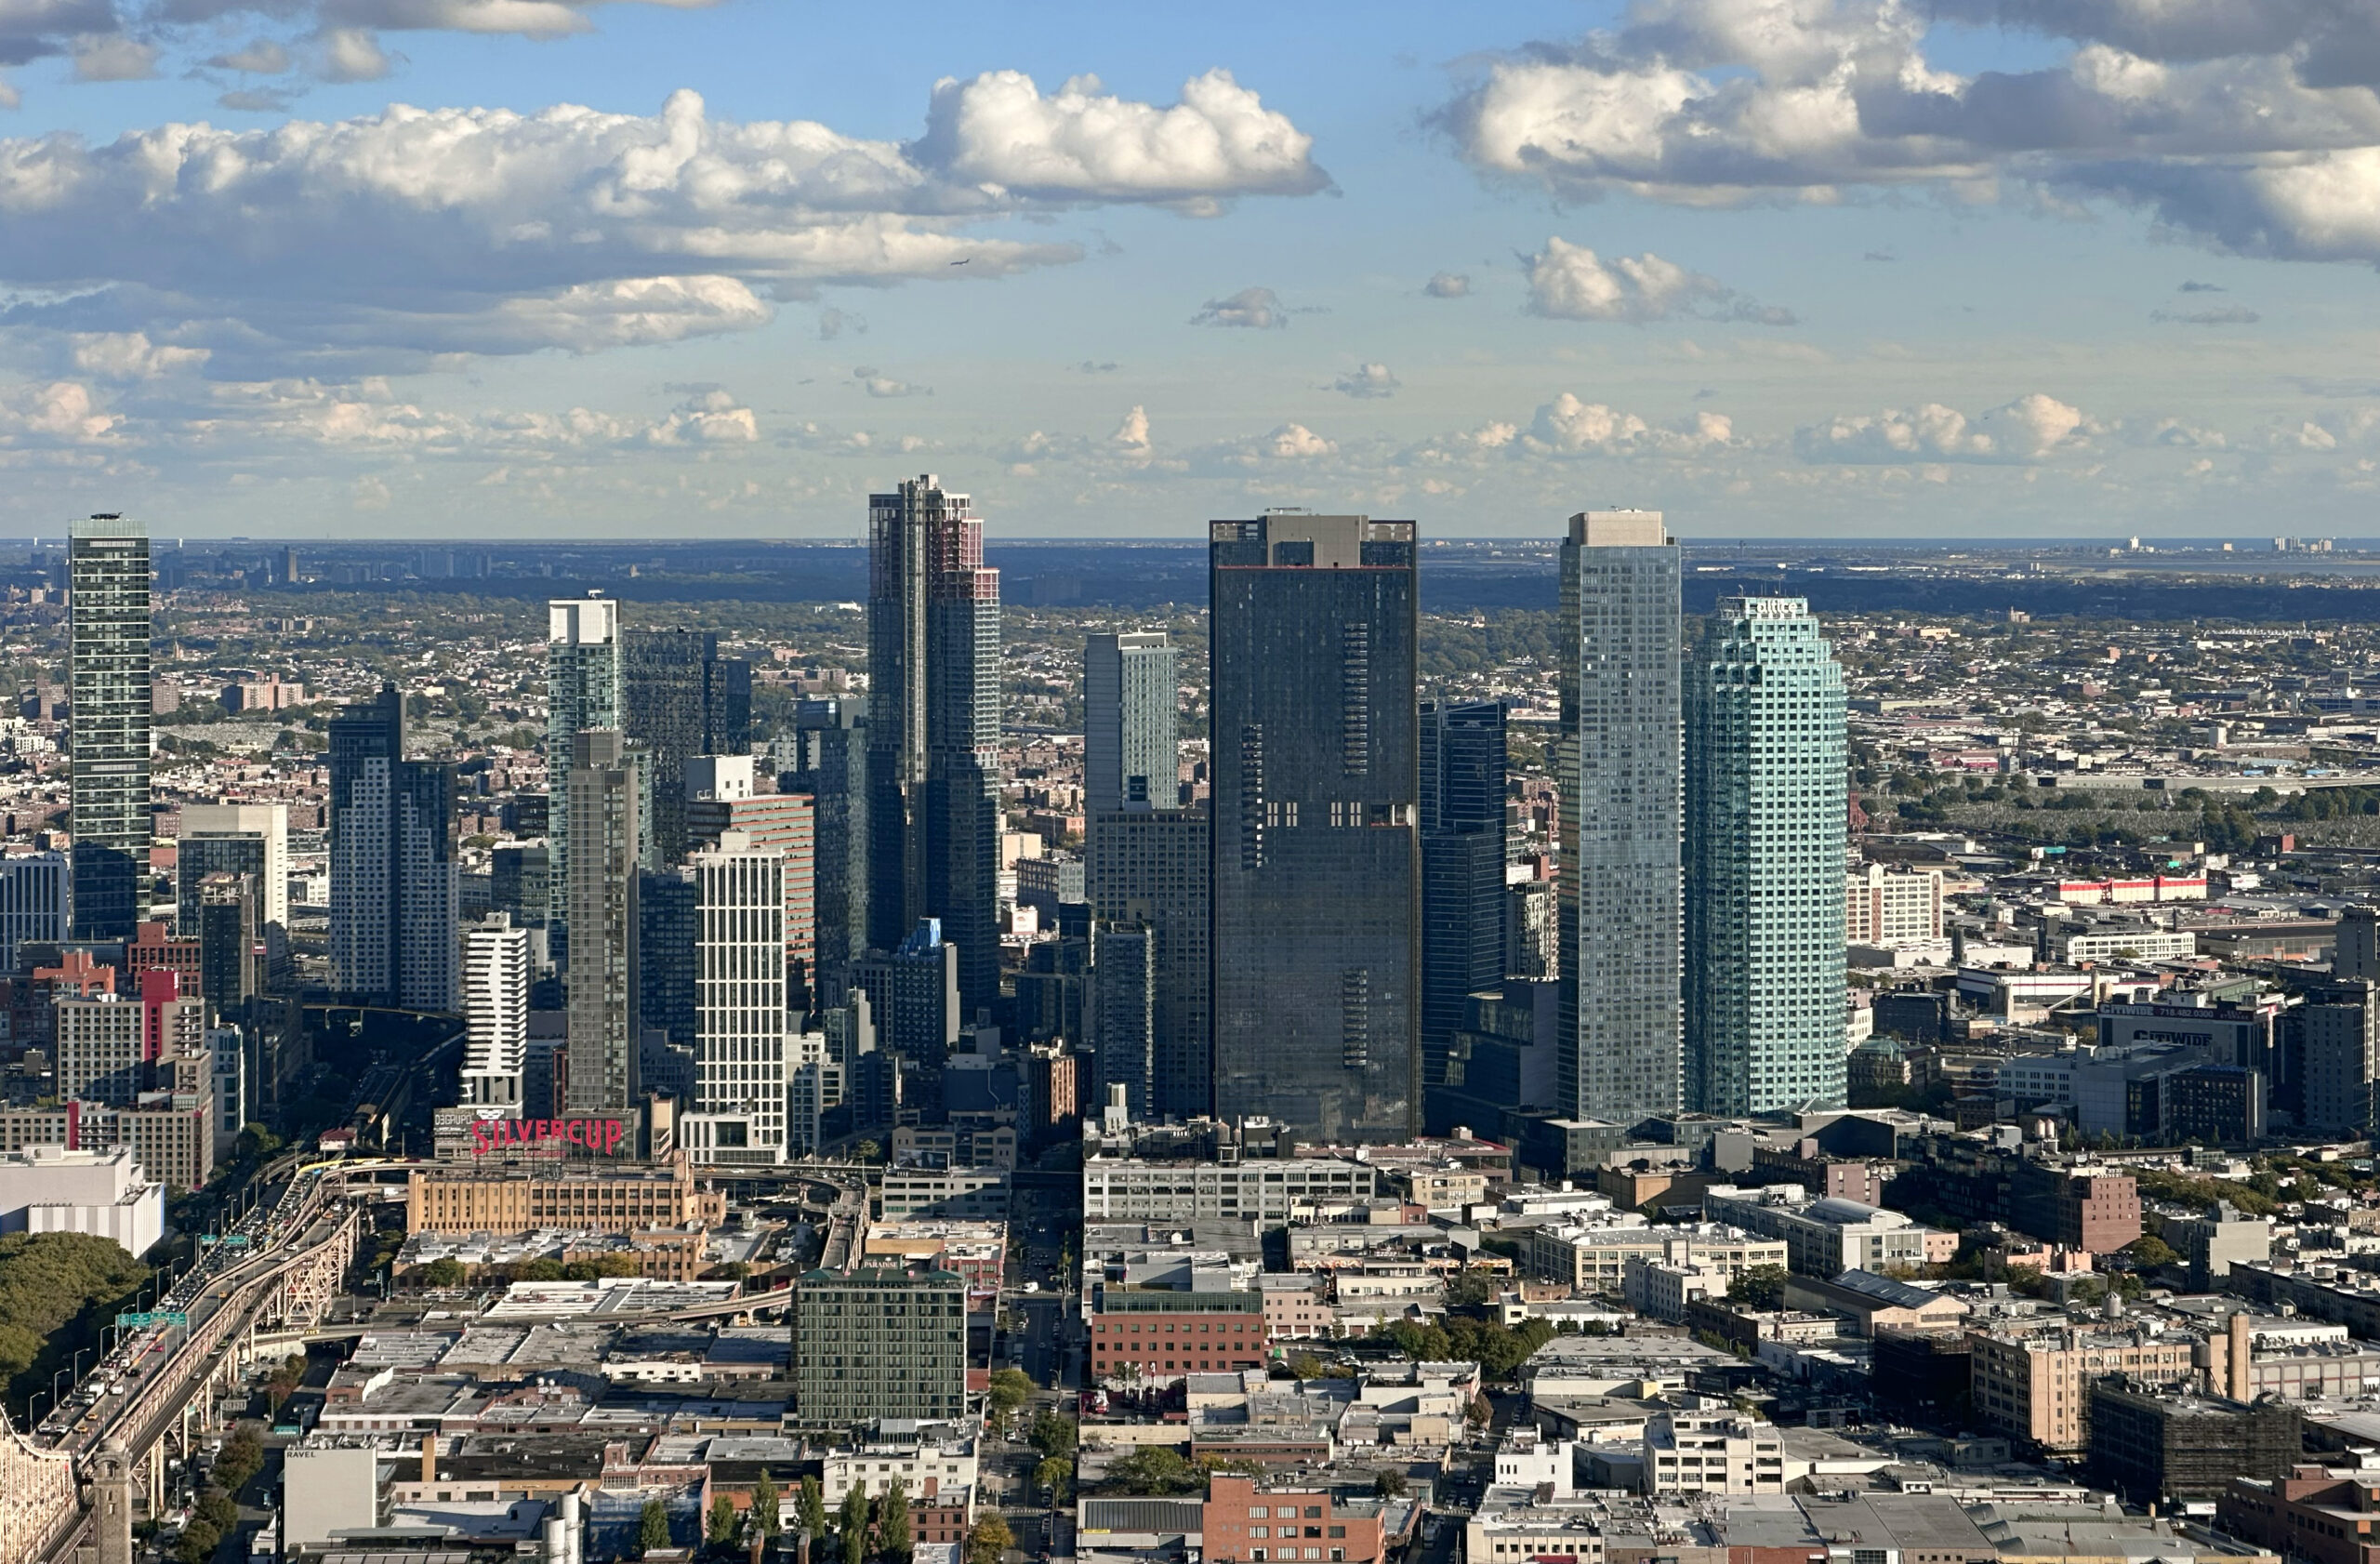
Photo by Michael Young
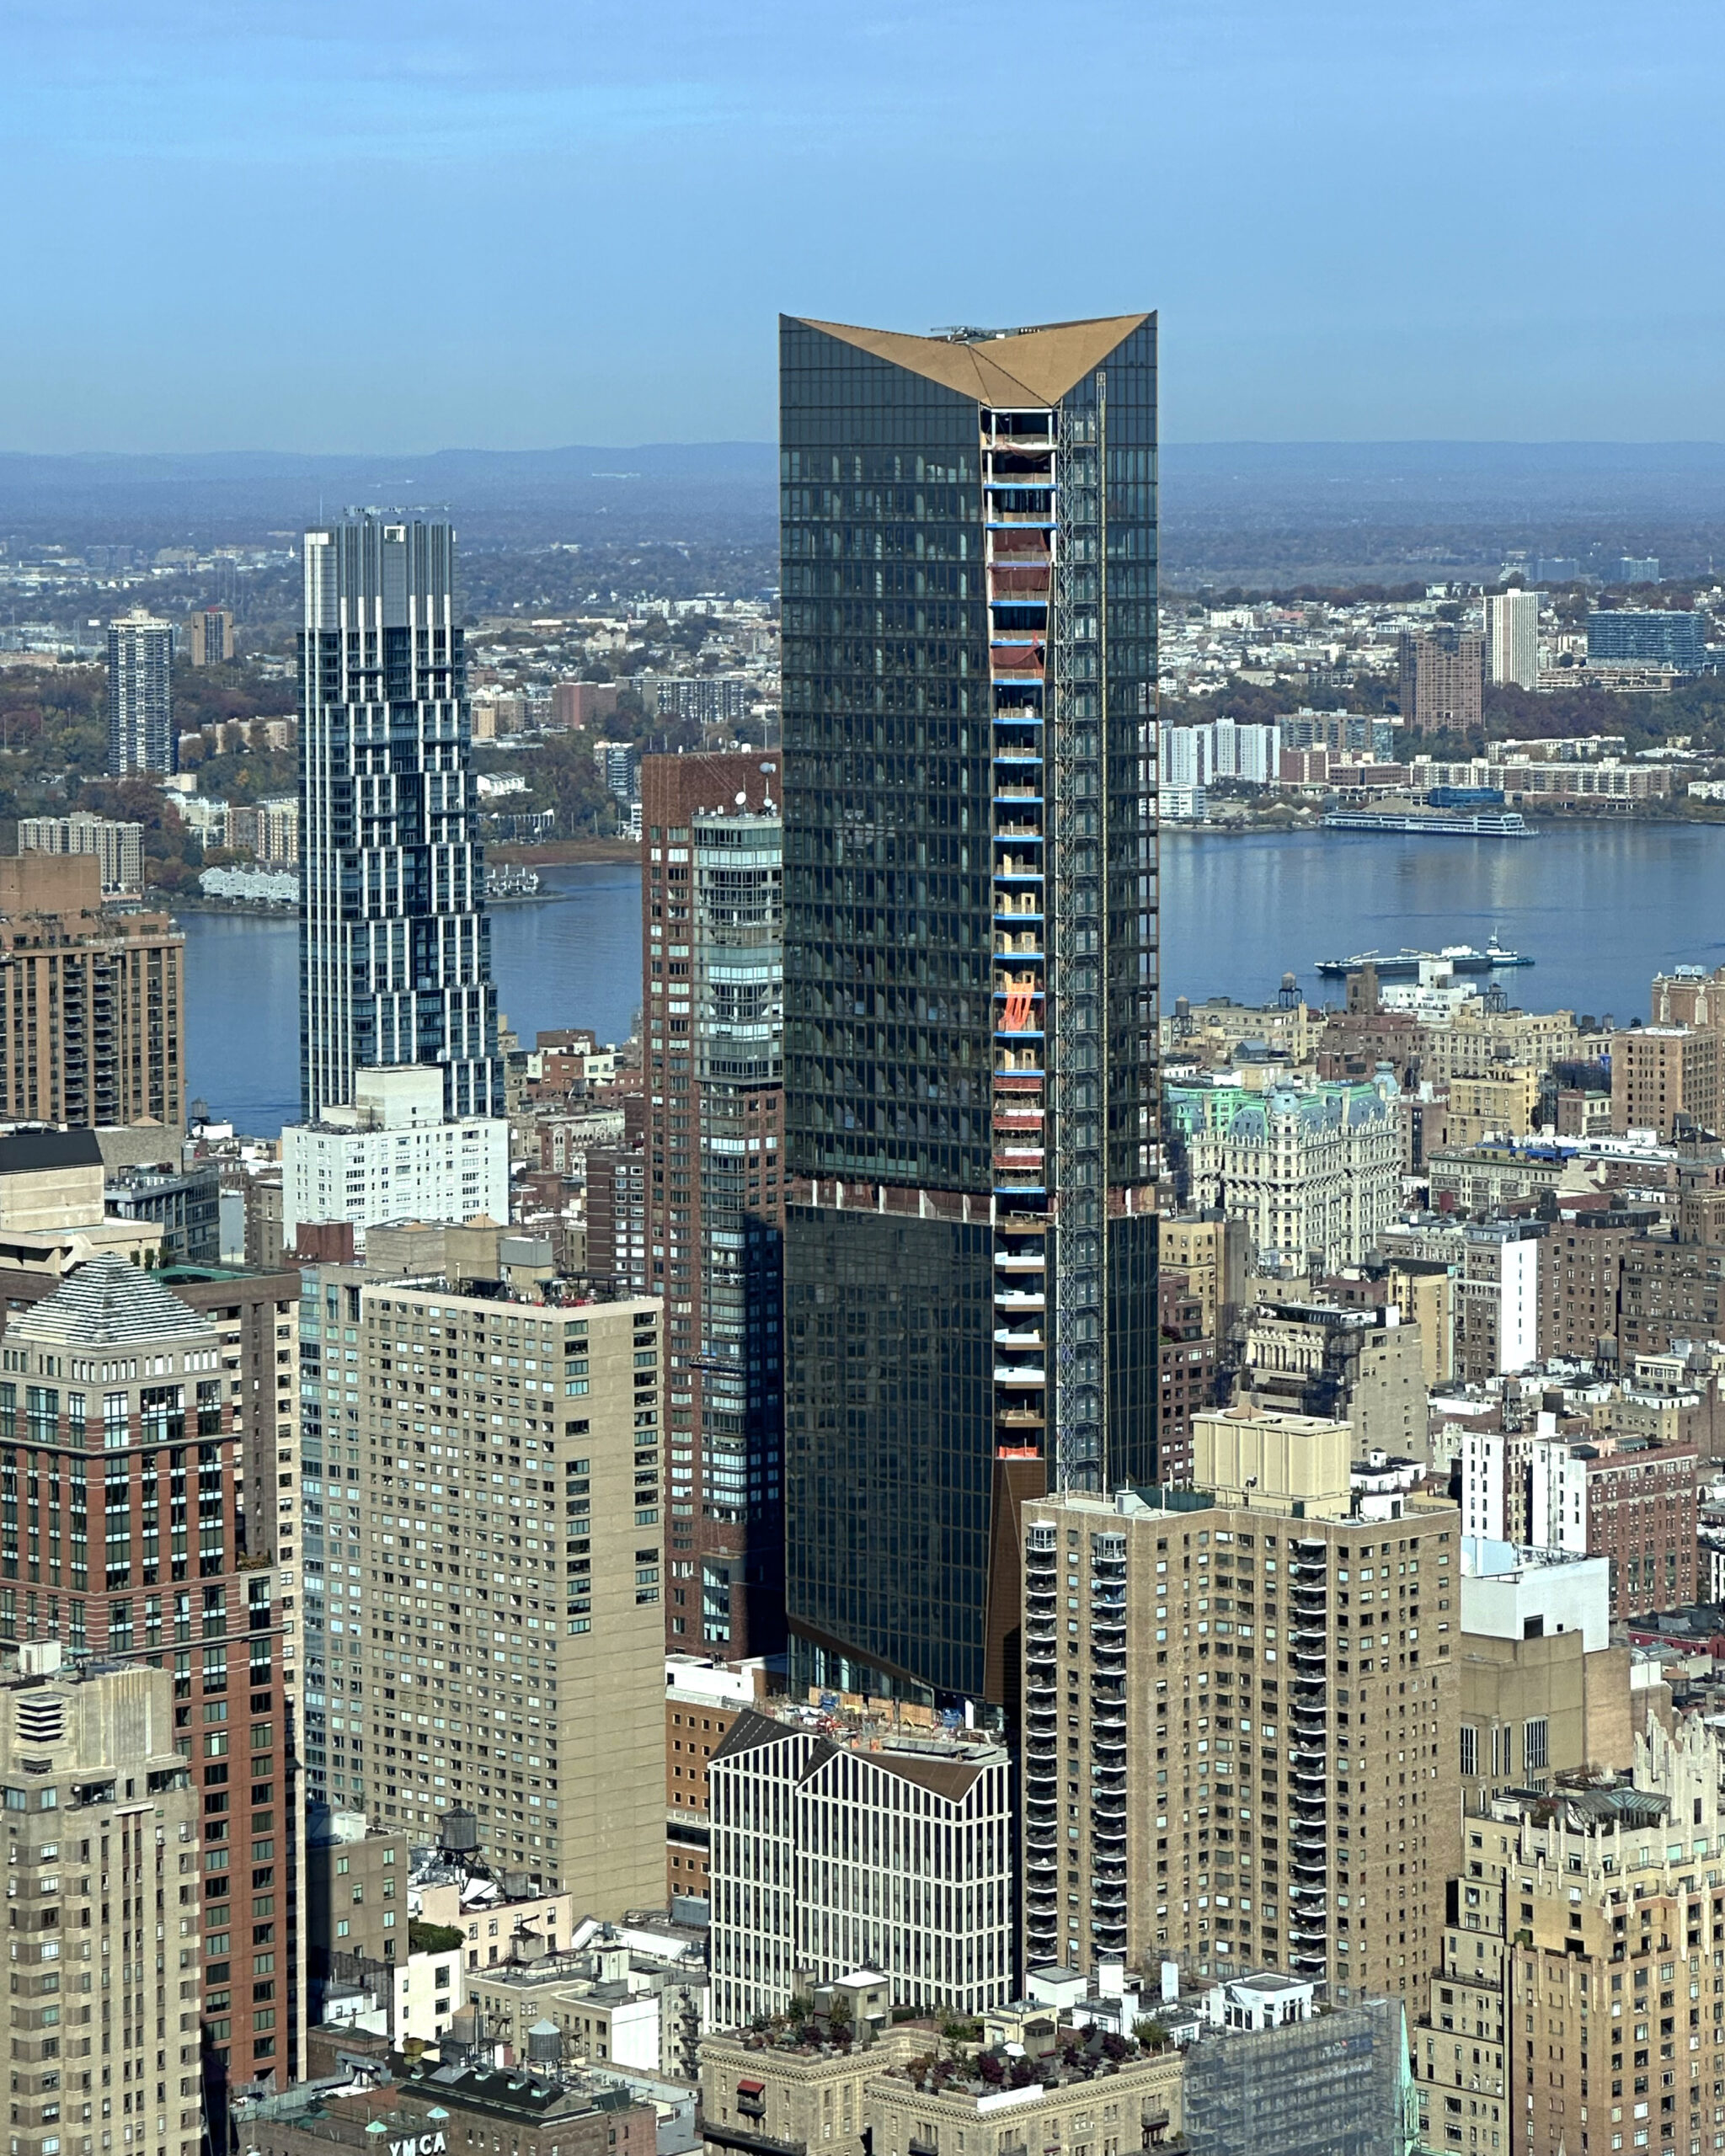
Photo by Michael Young
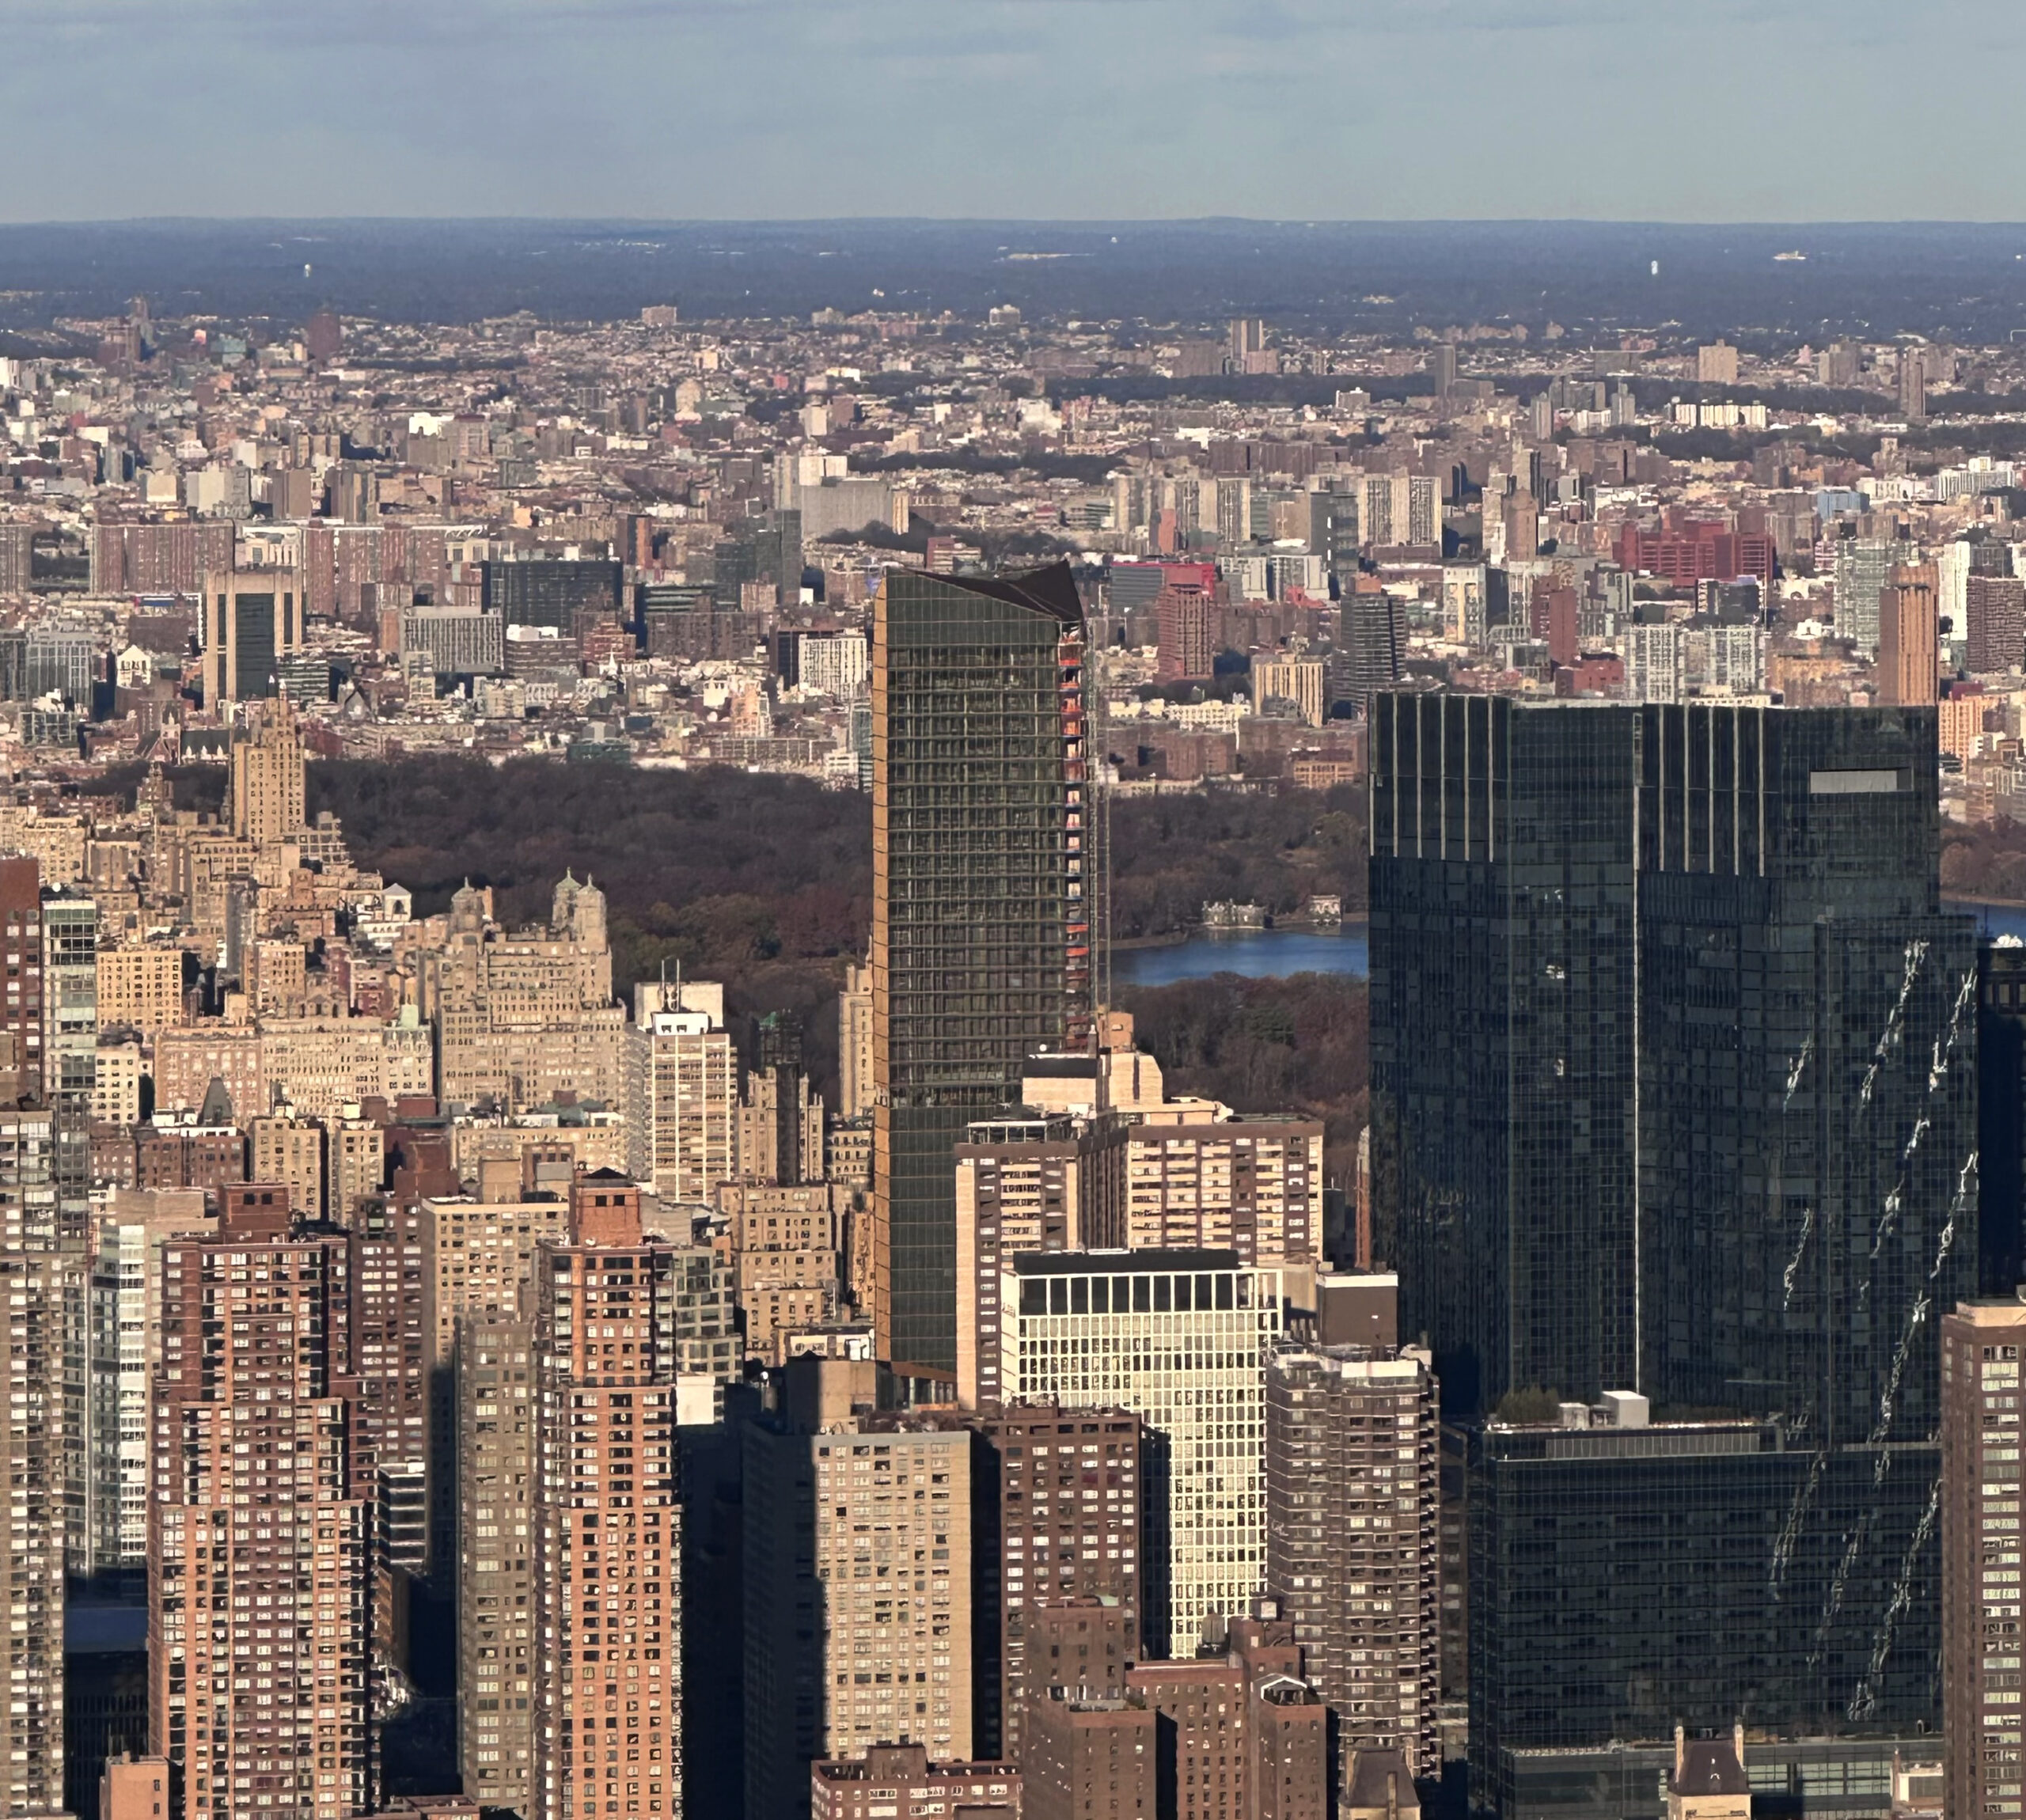
Photo by Michael Young
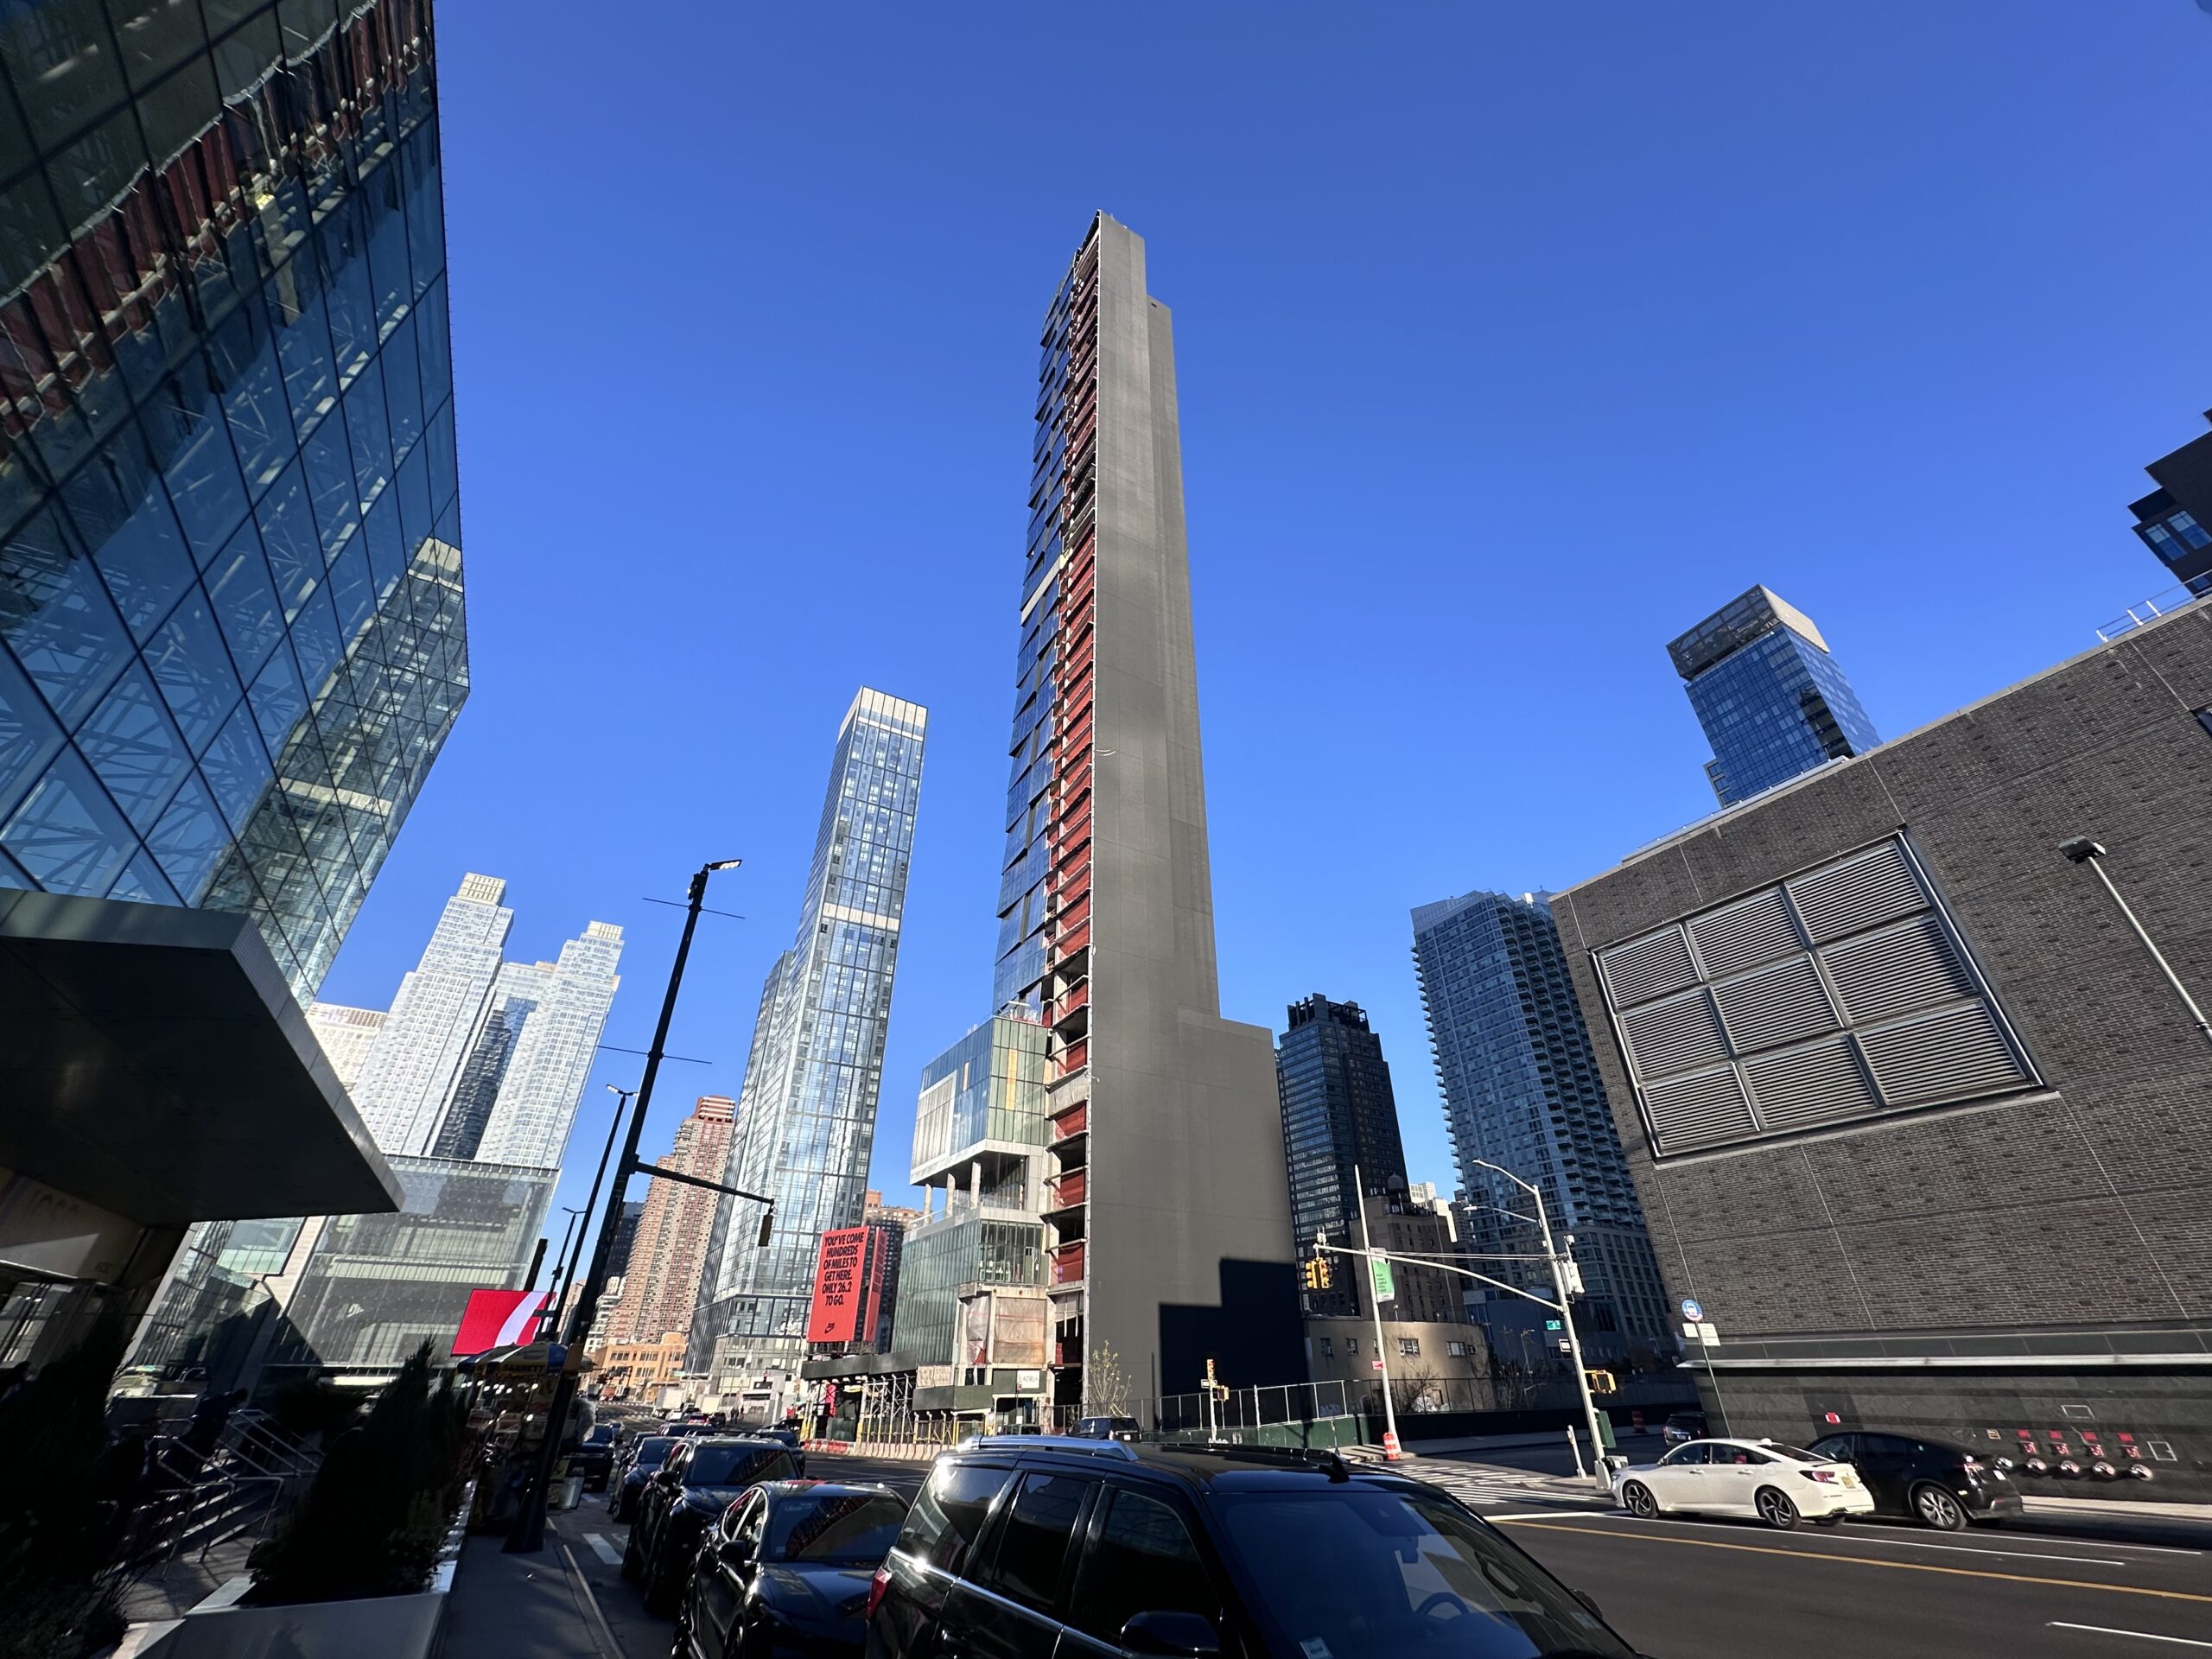
Photo by Michael Young
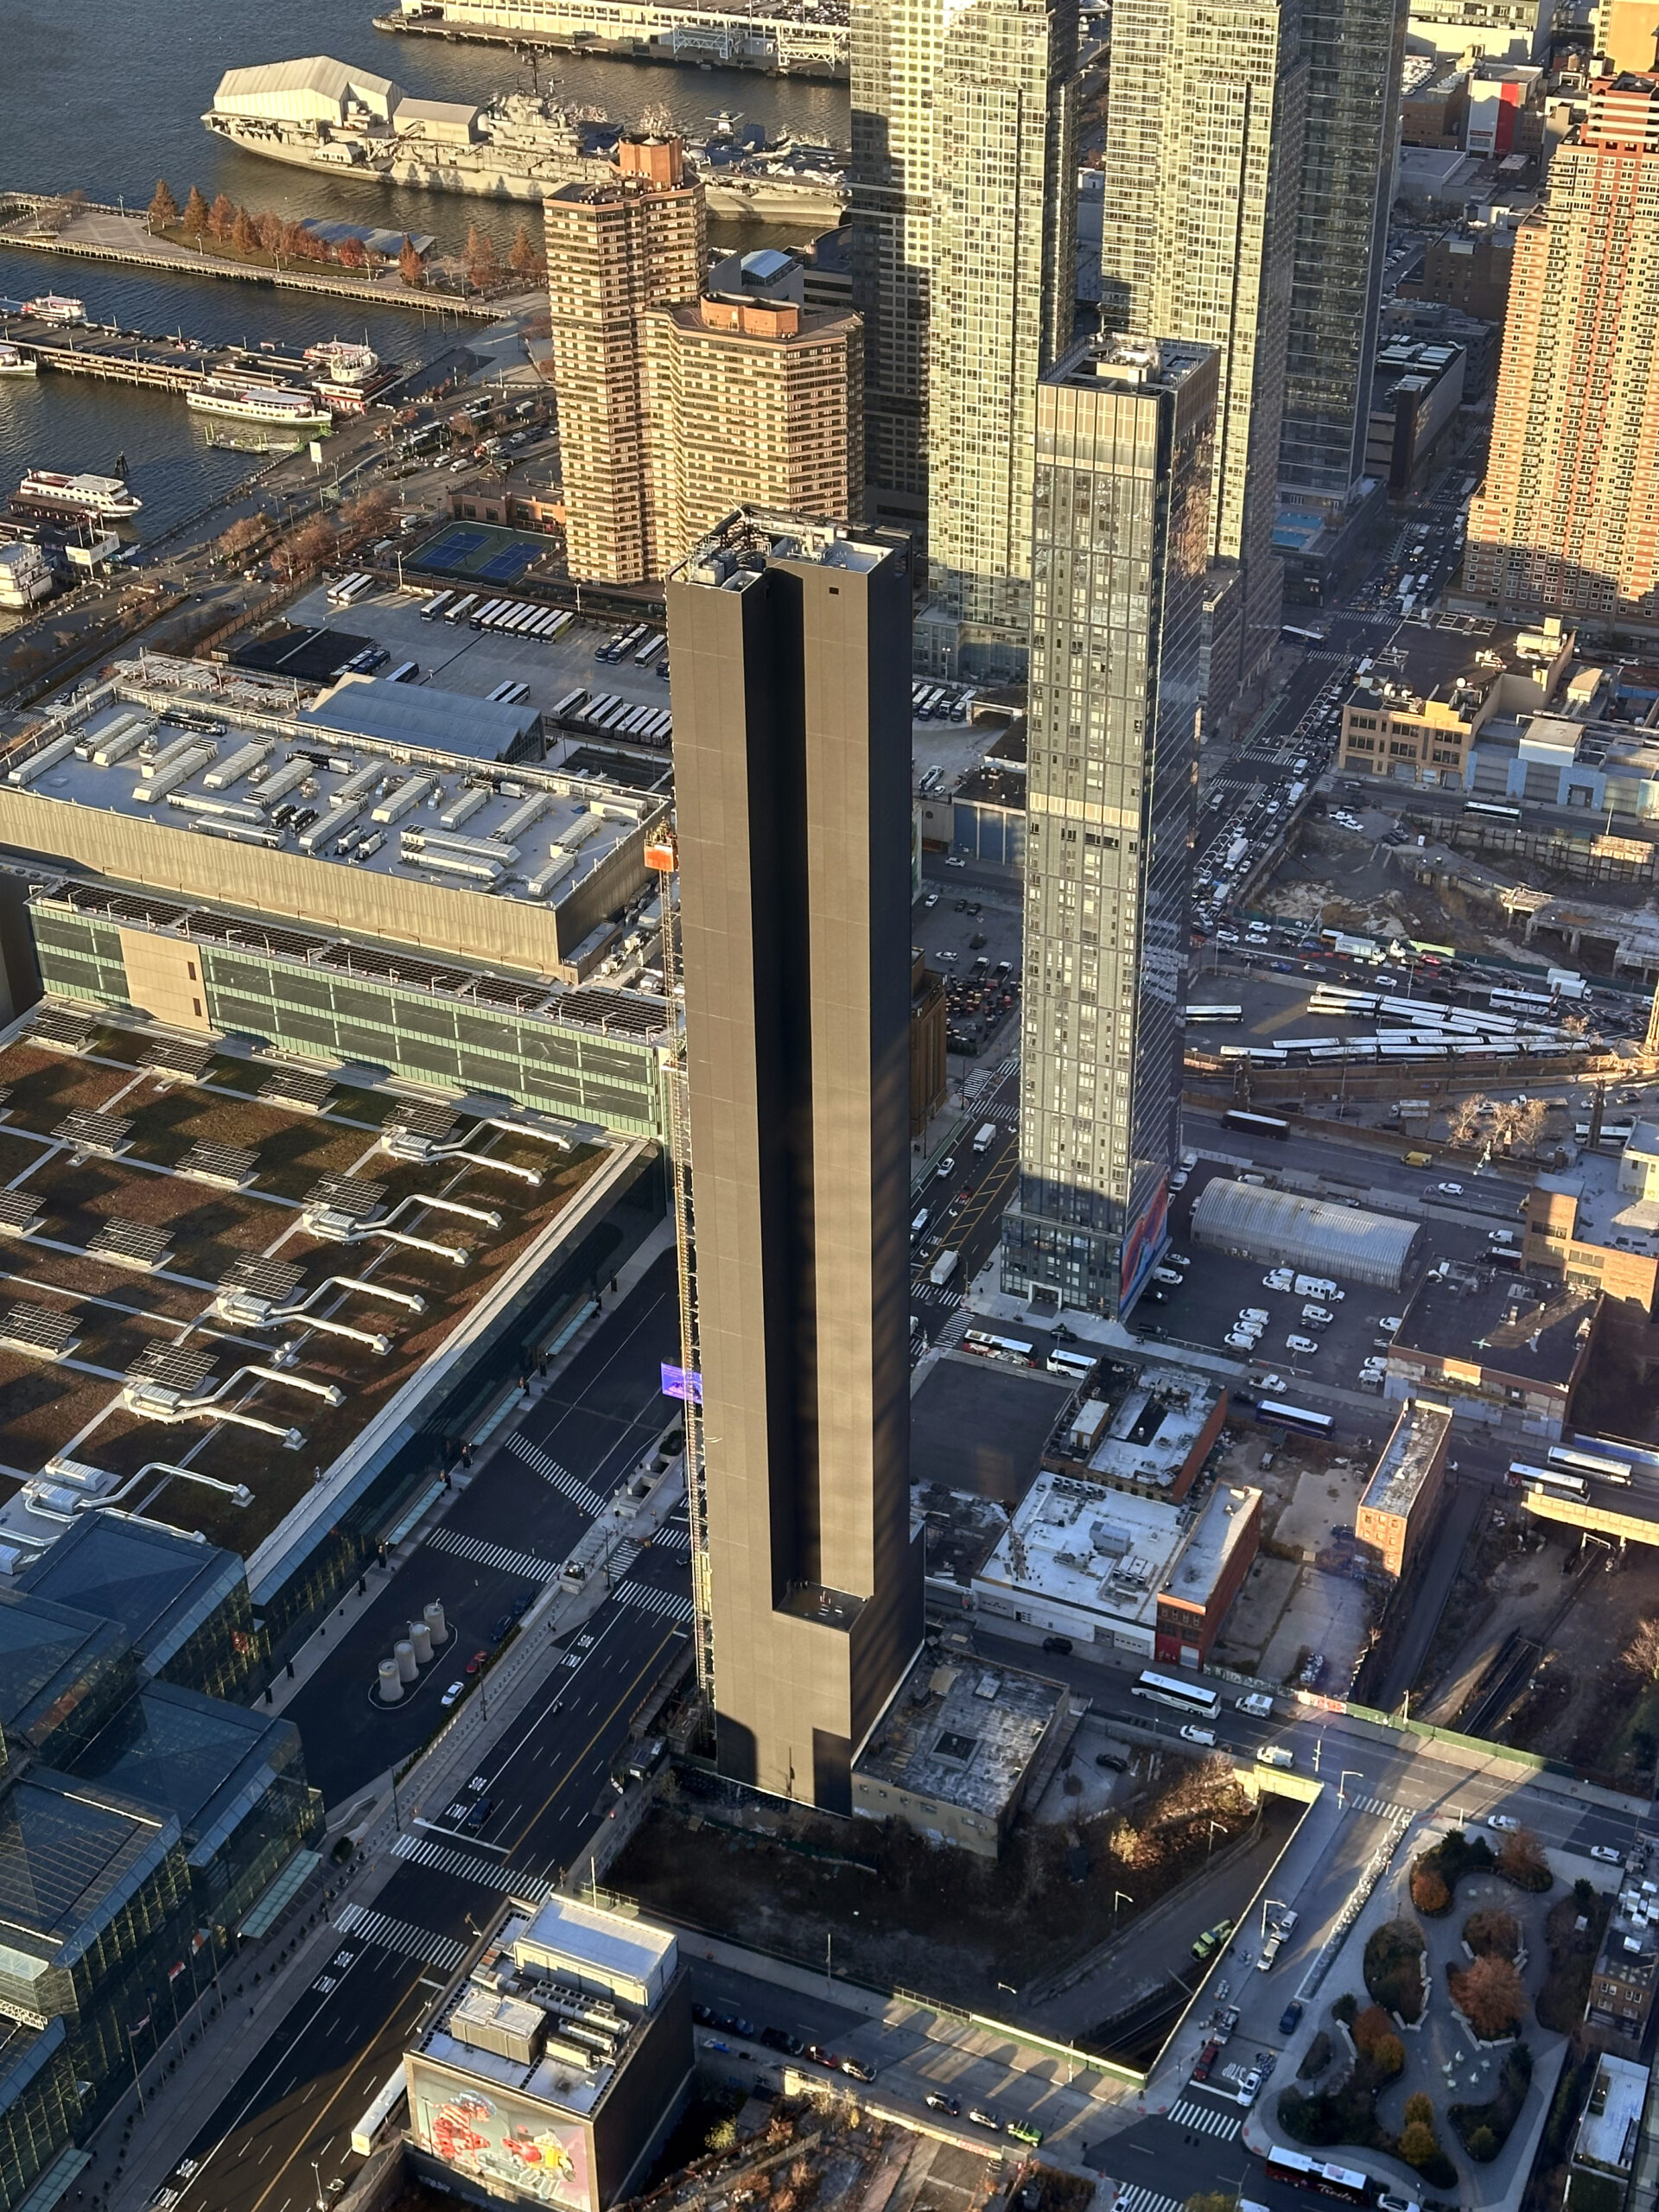
Photo by Michael Young
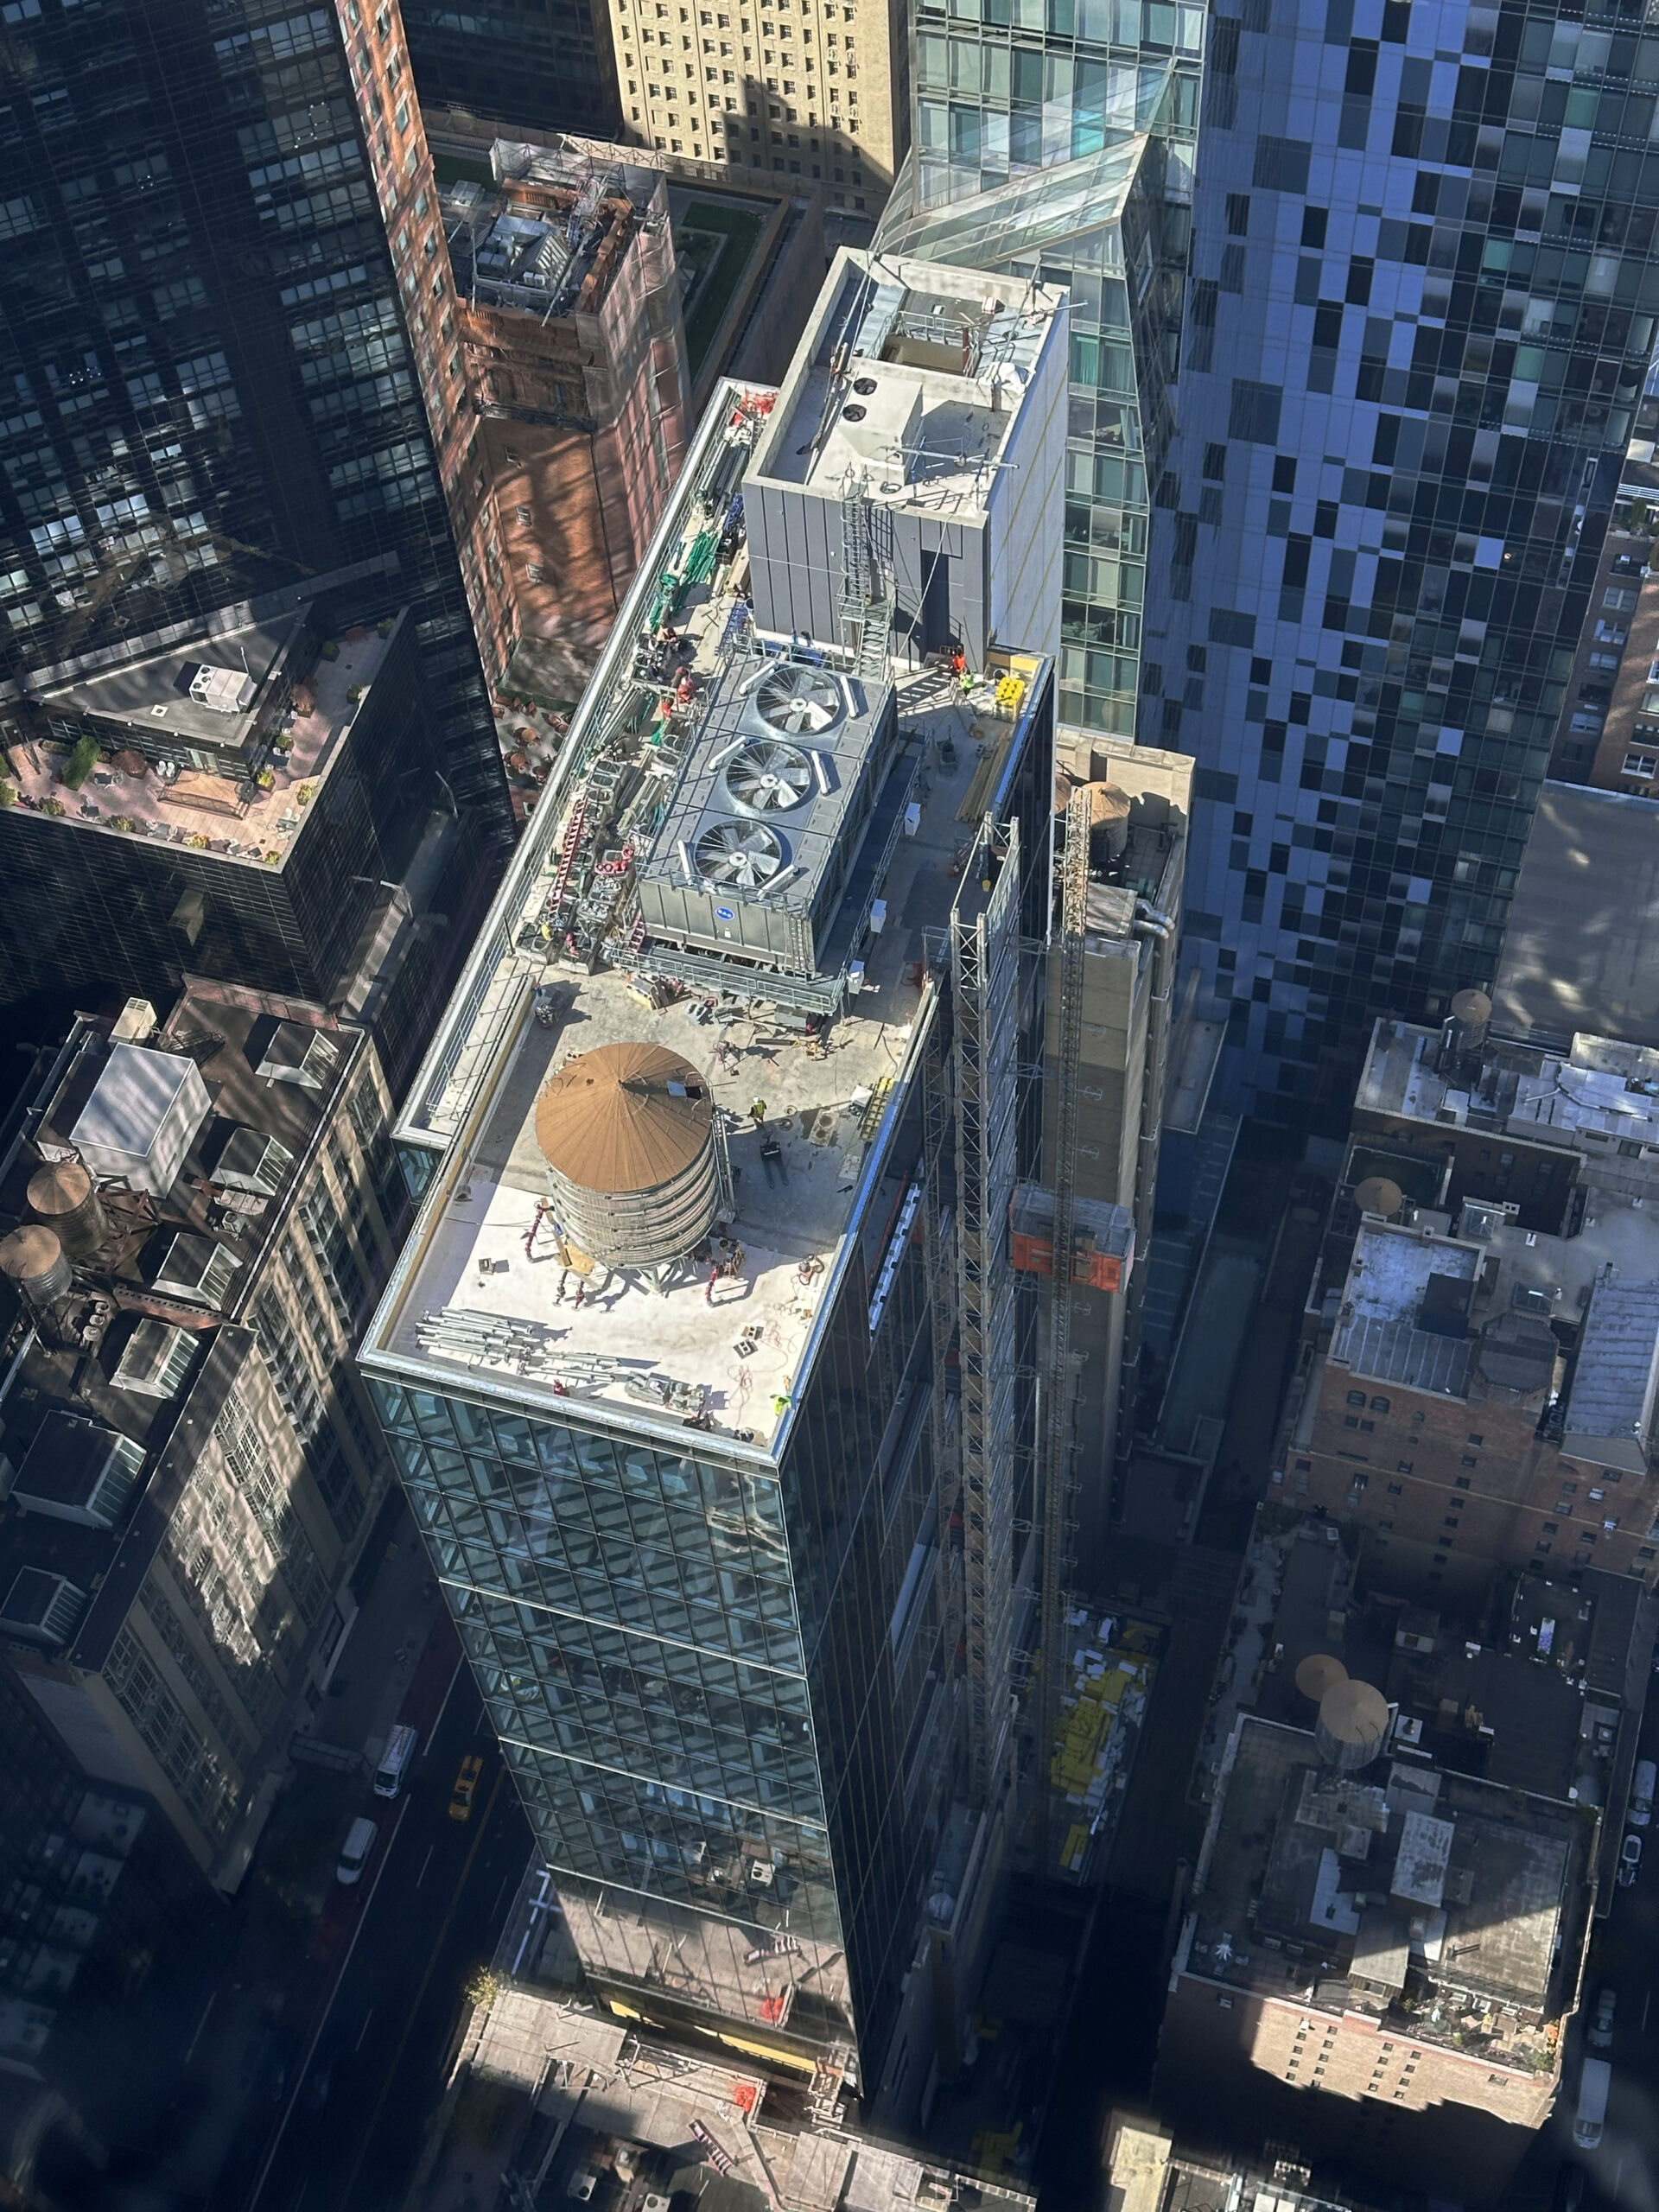
Photo by Michael Young

Photograph from report released last week, via nyc.gov
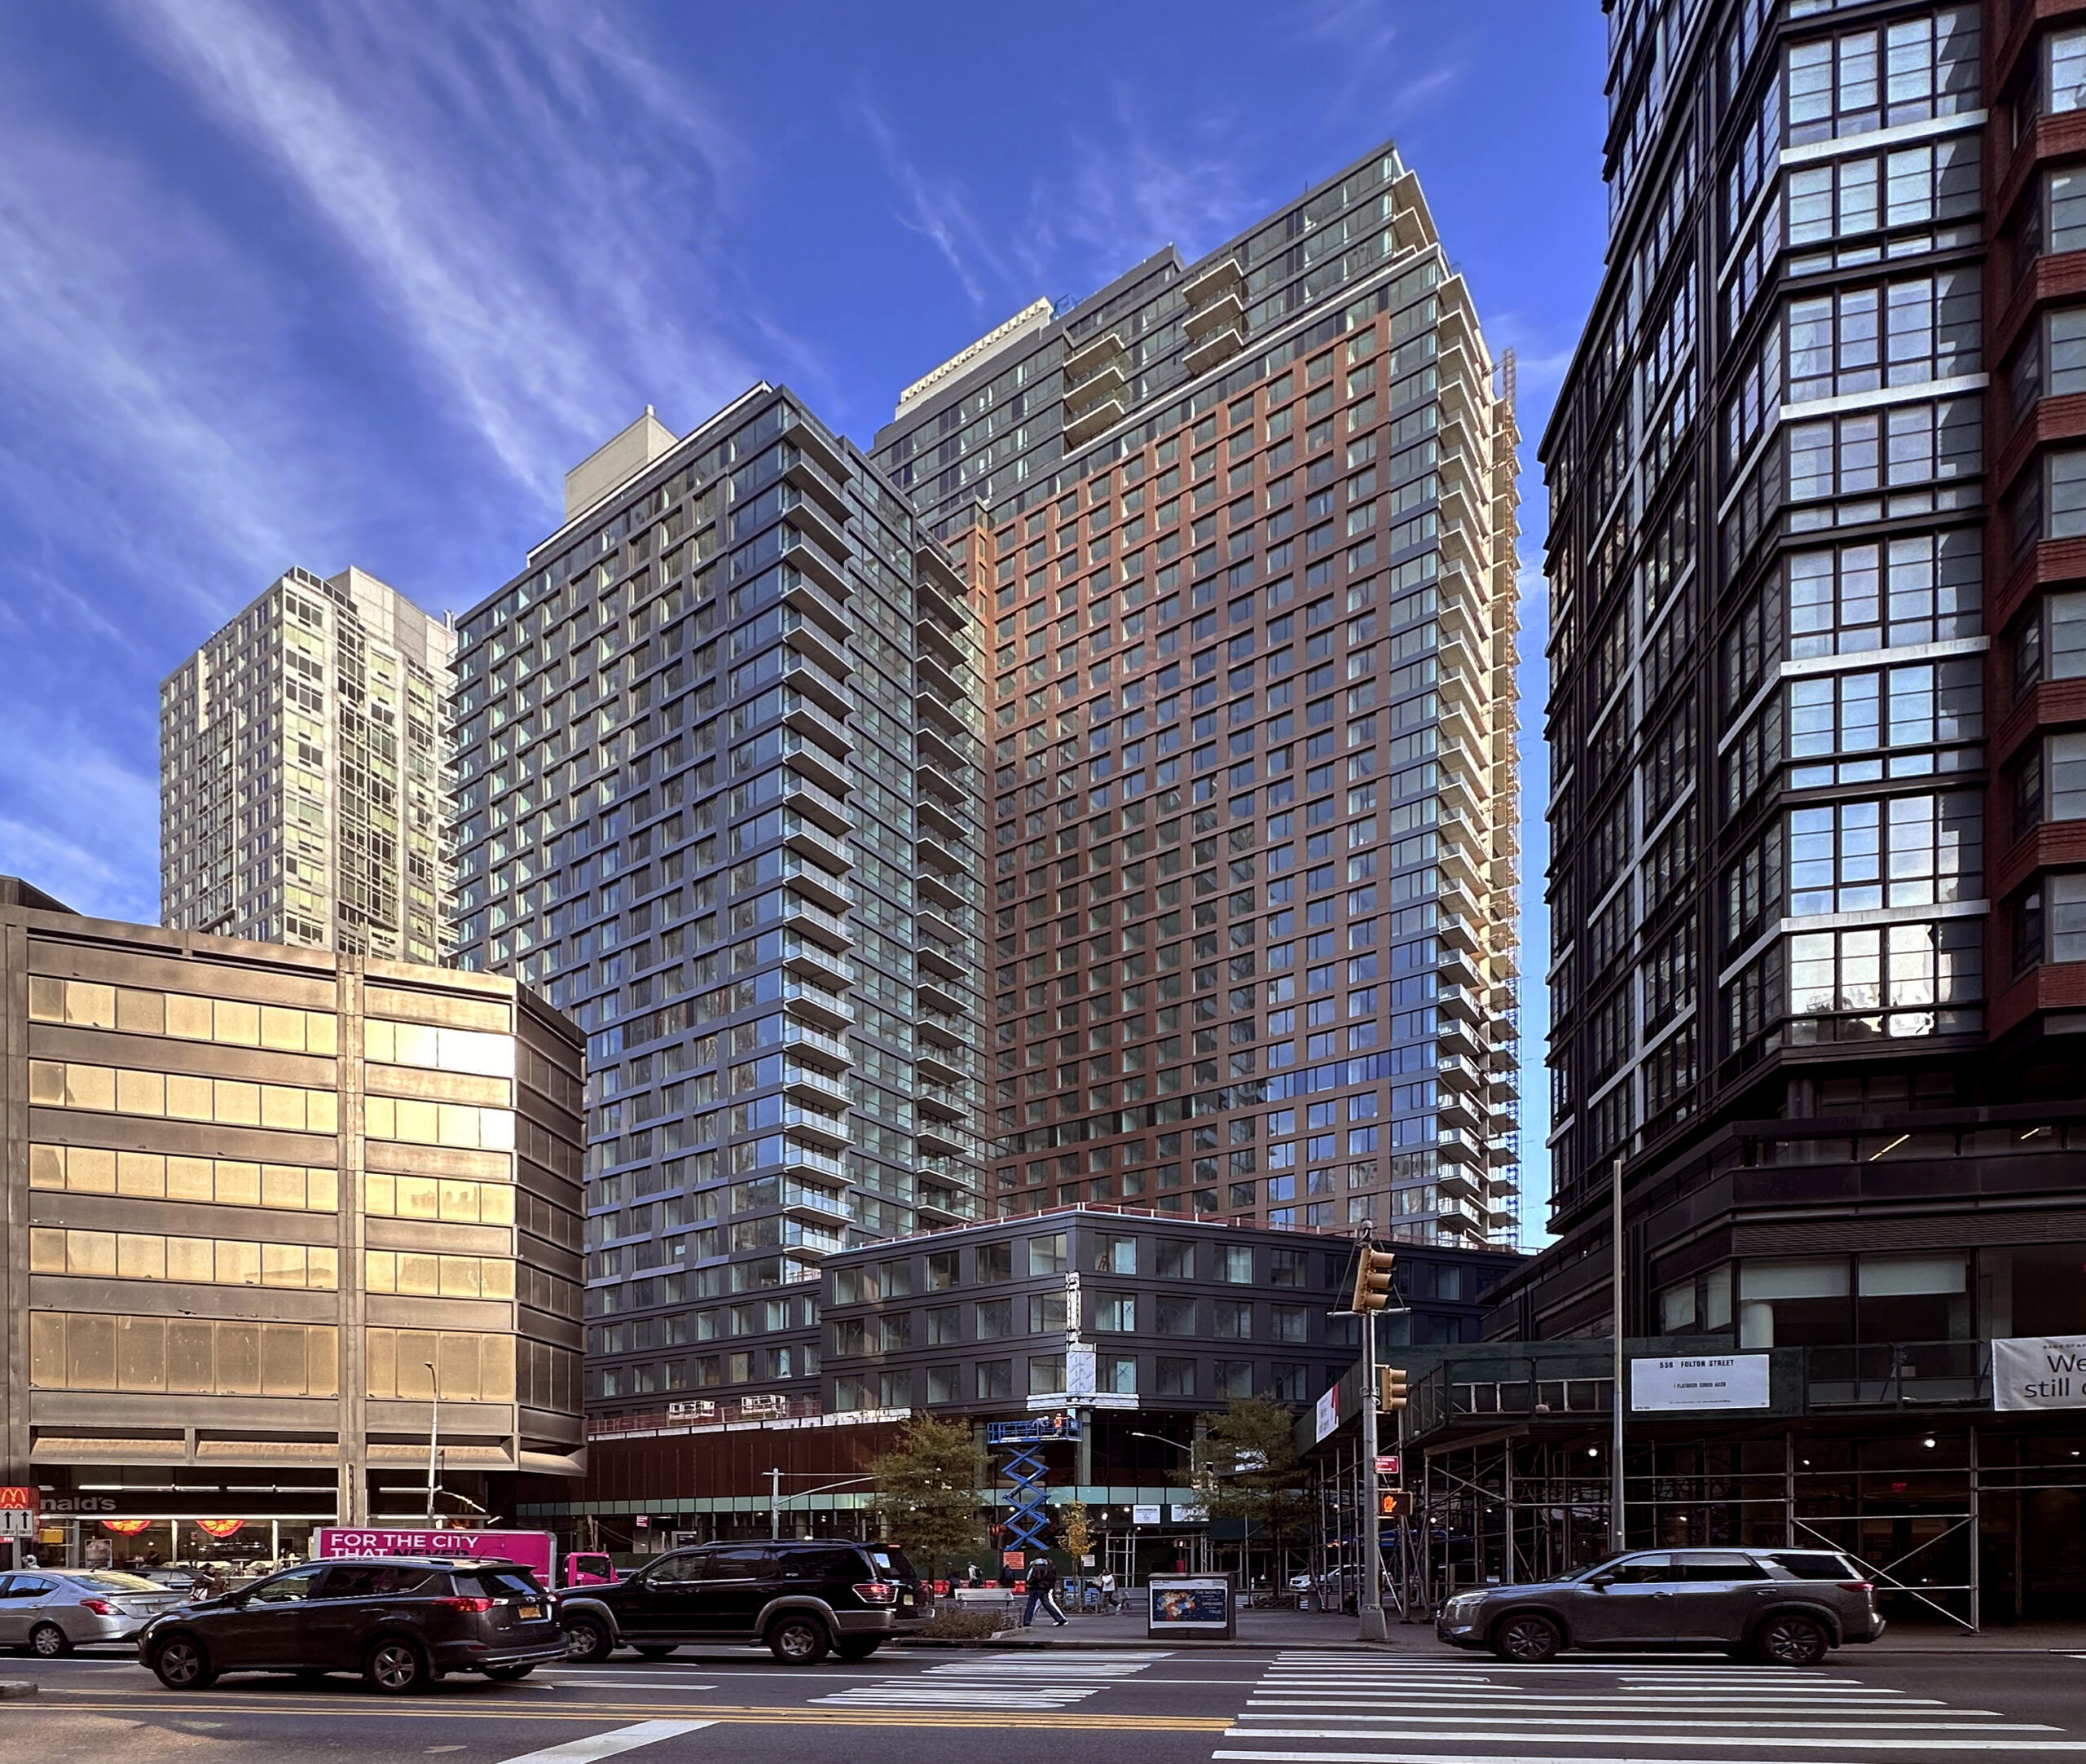
Photo by Michael Young
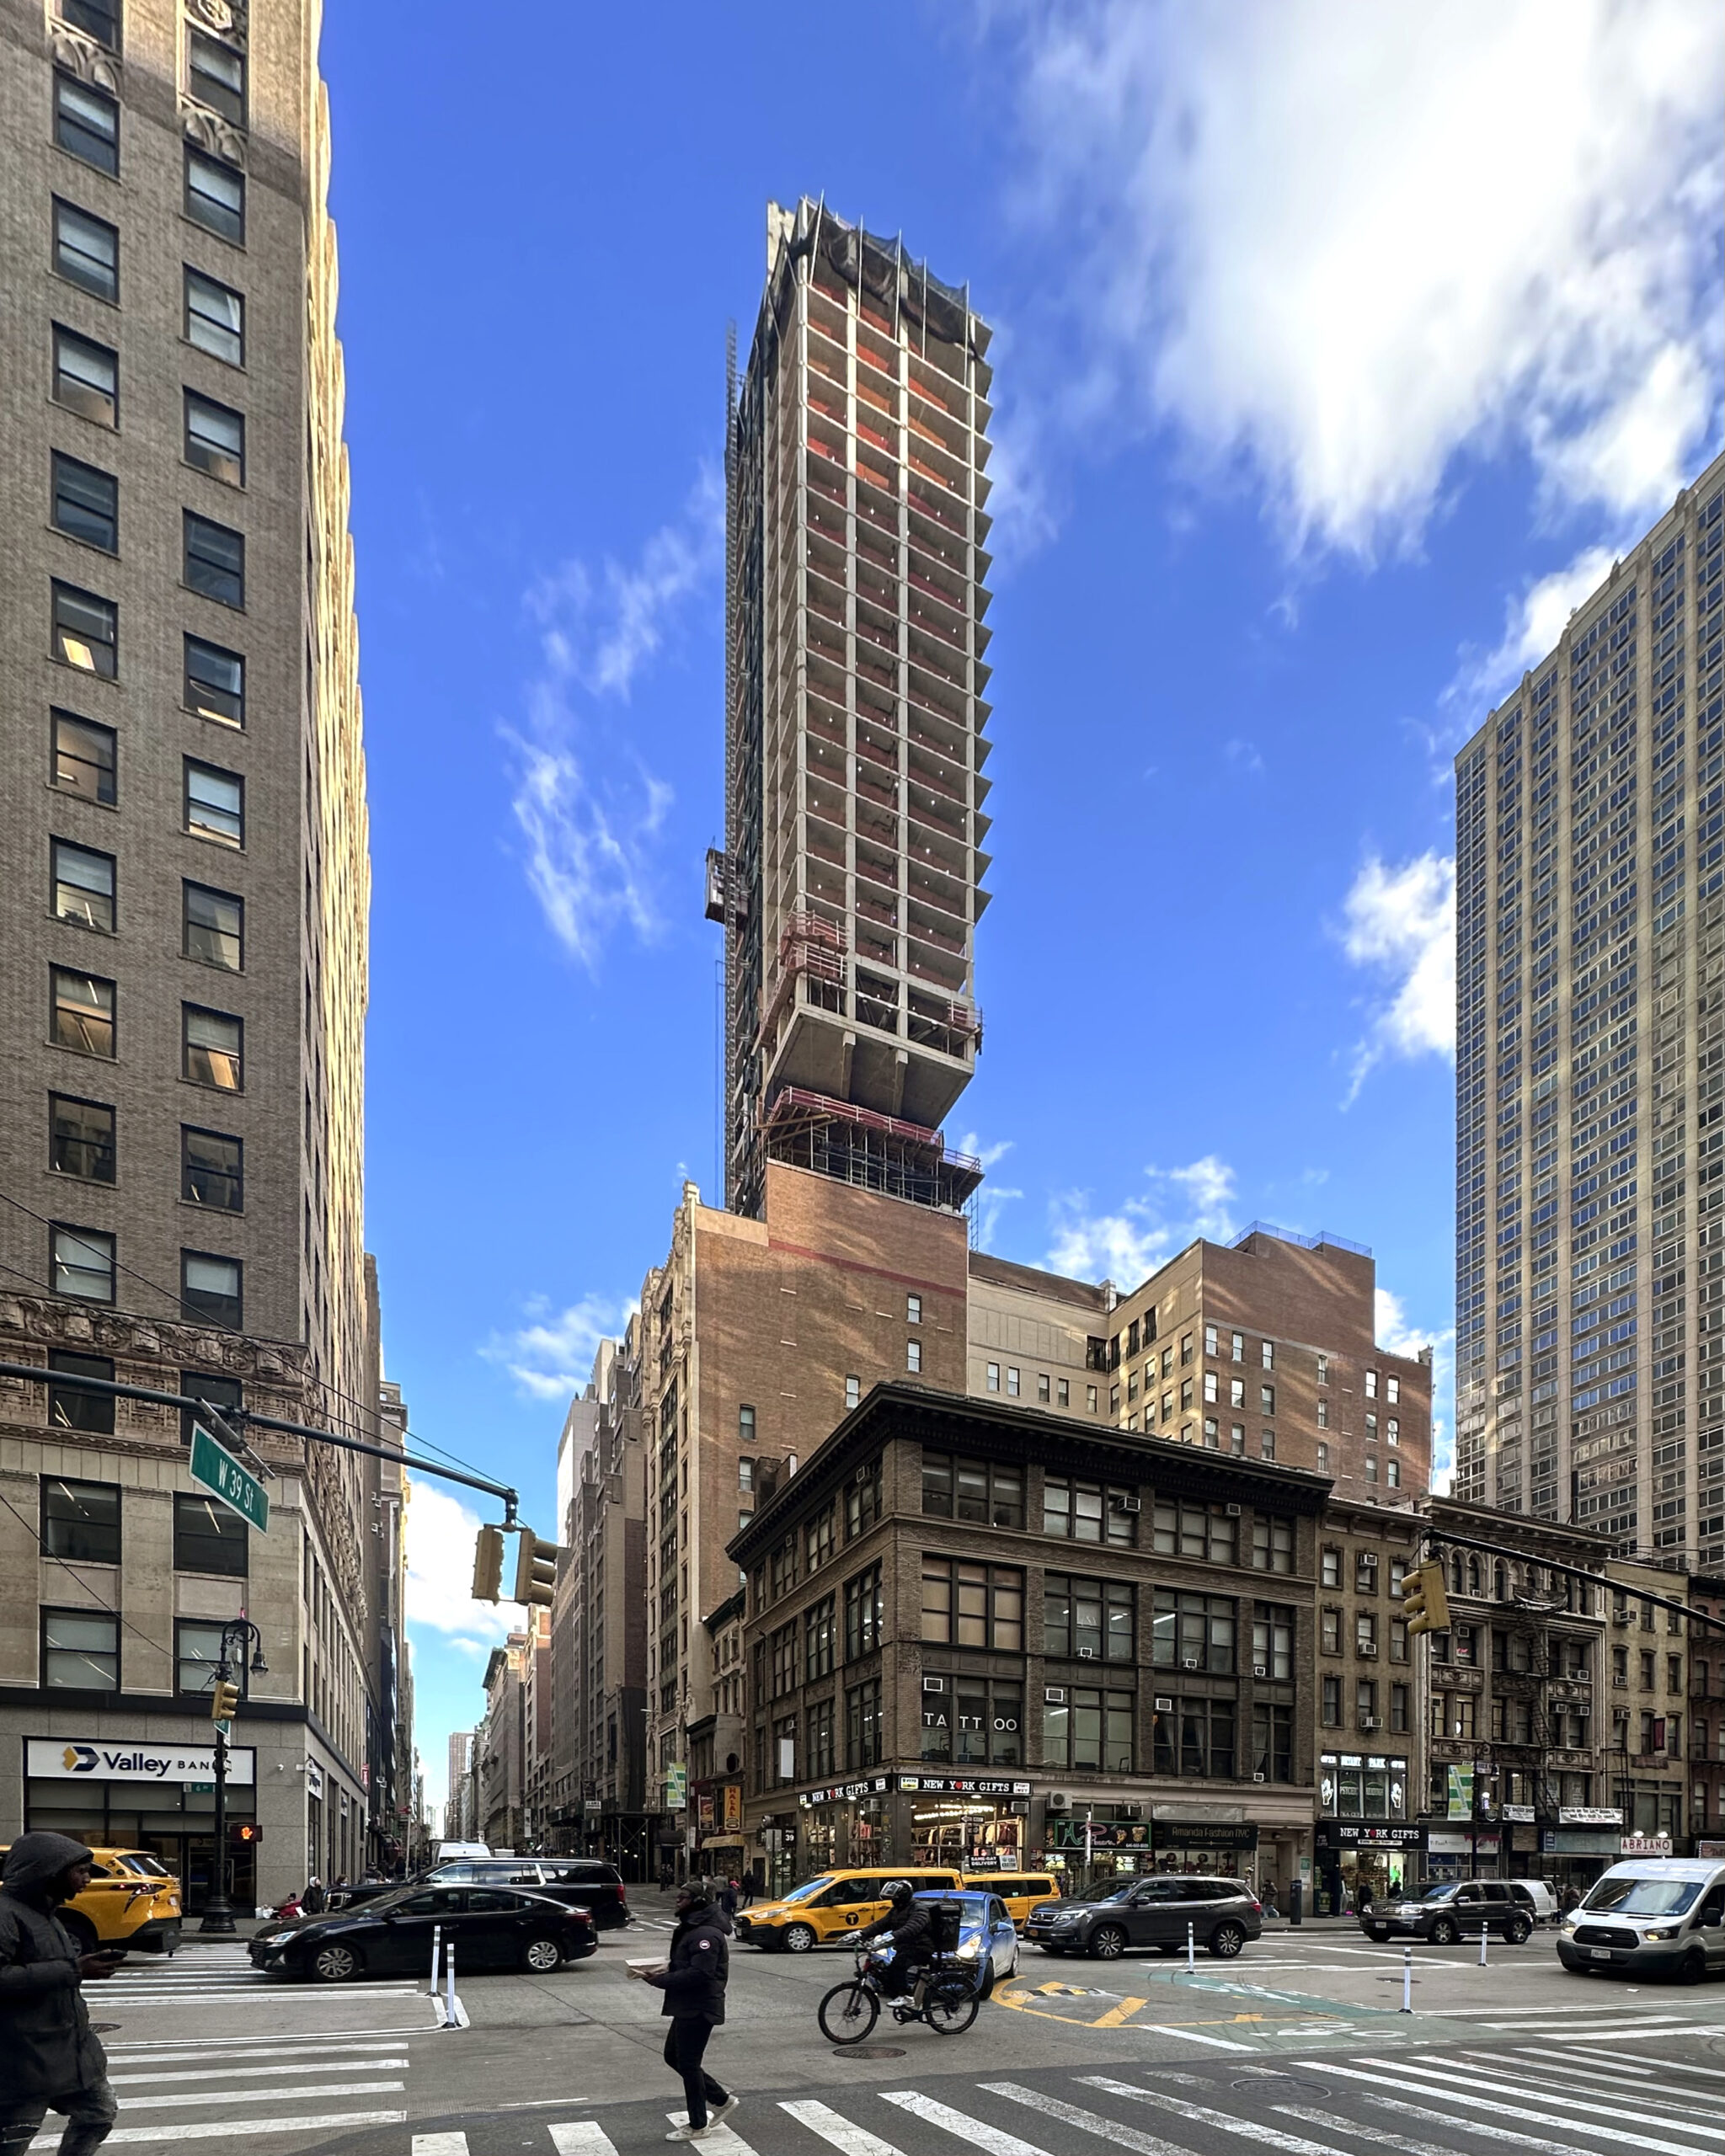
Photo by Michael Young
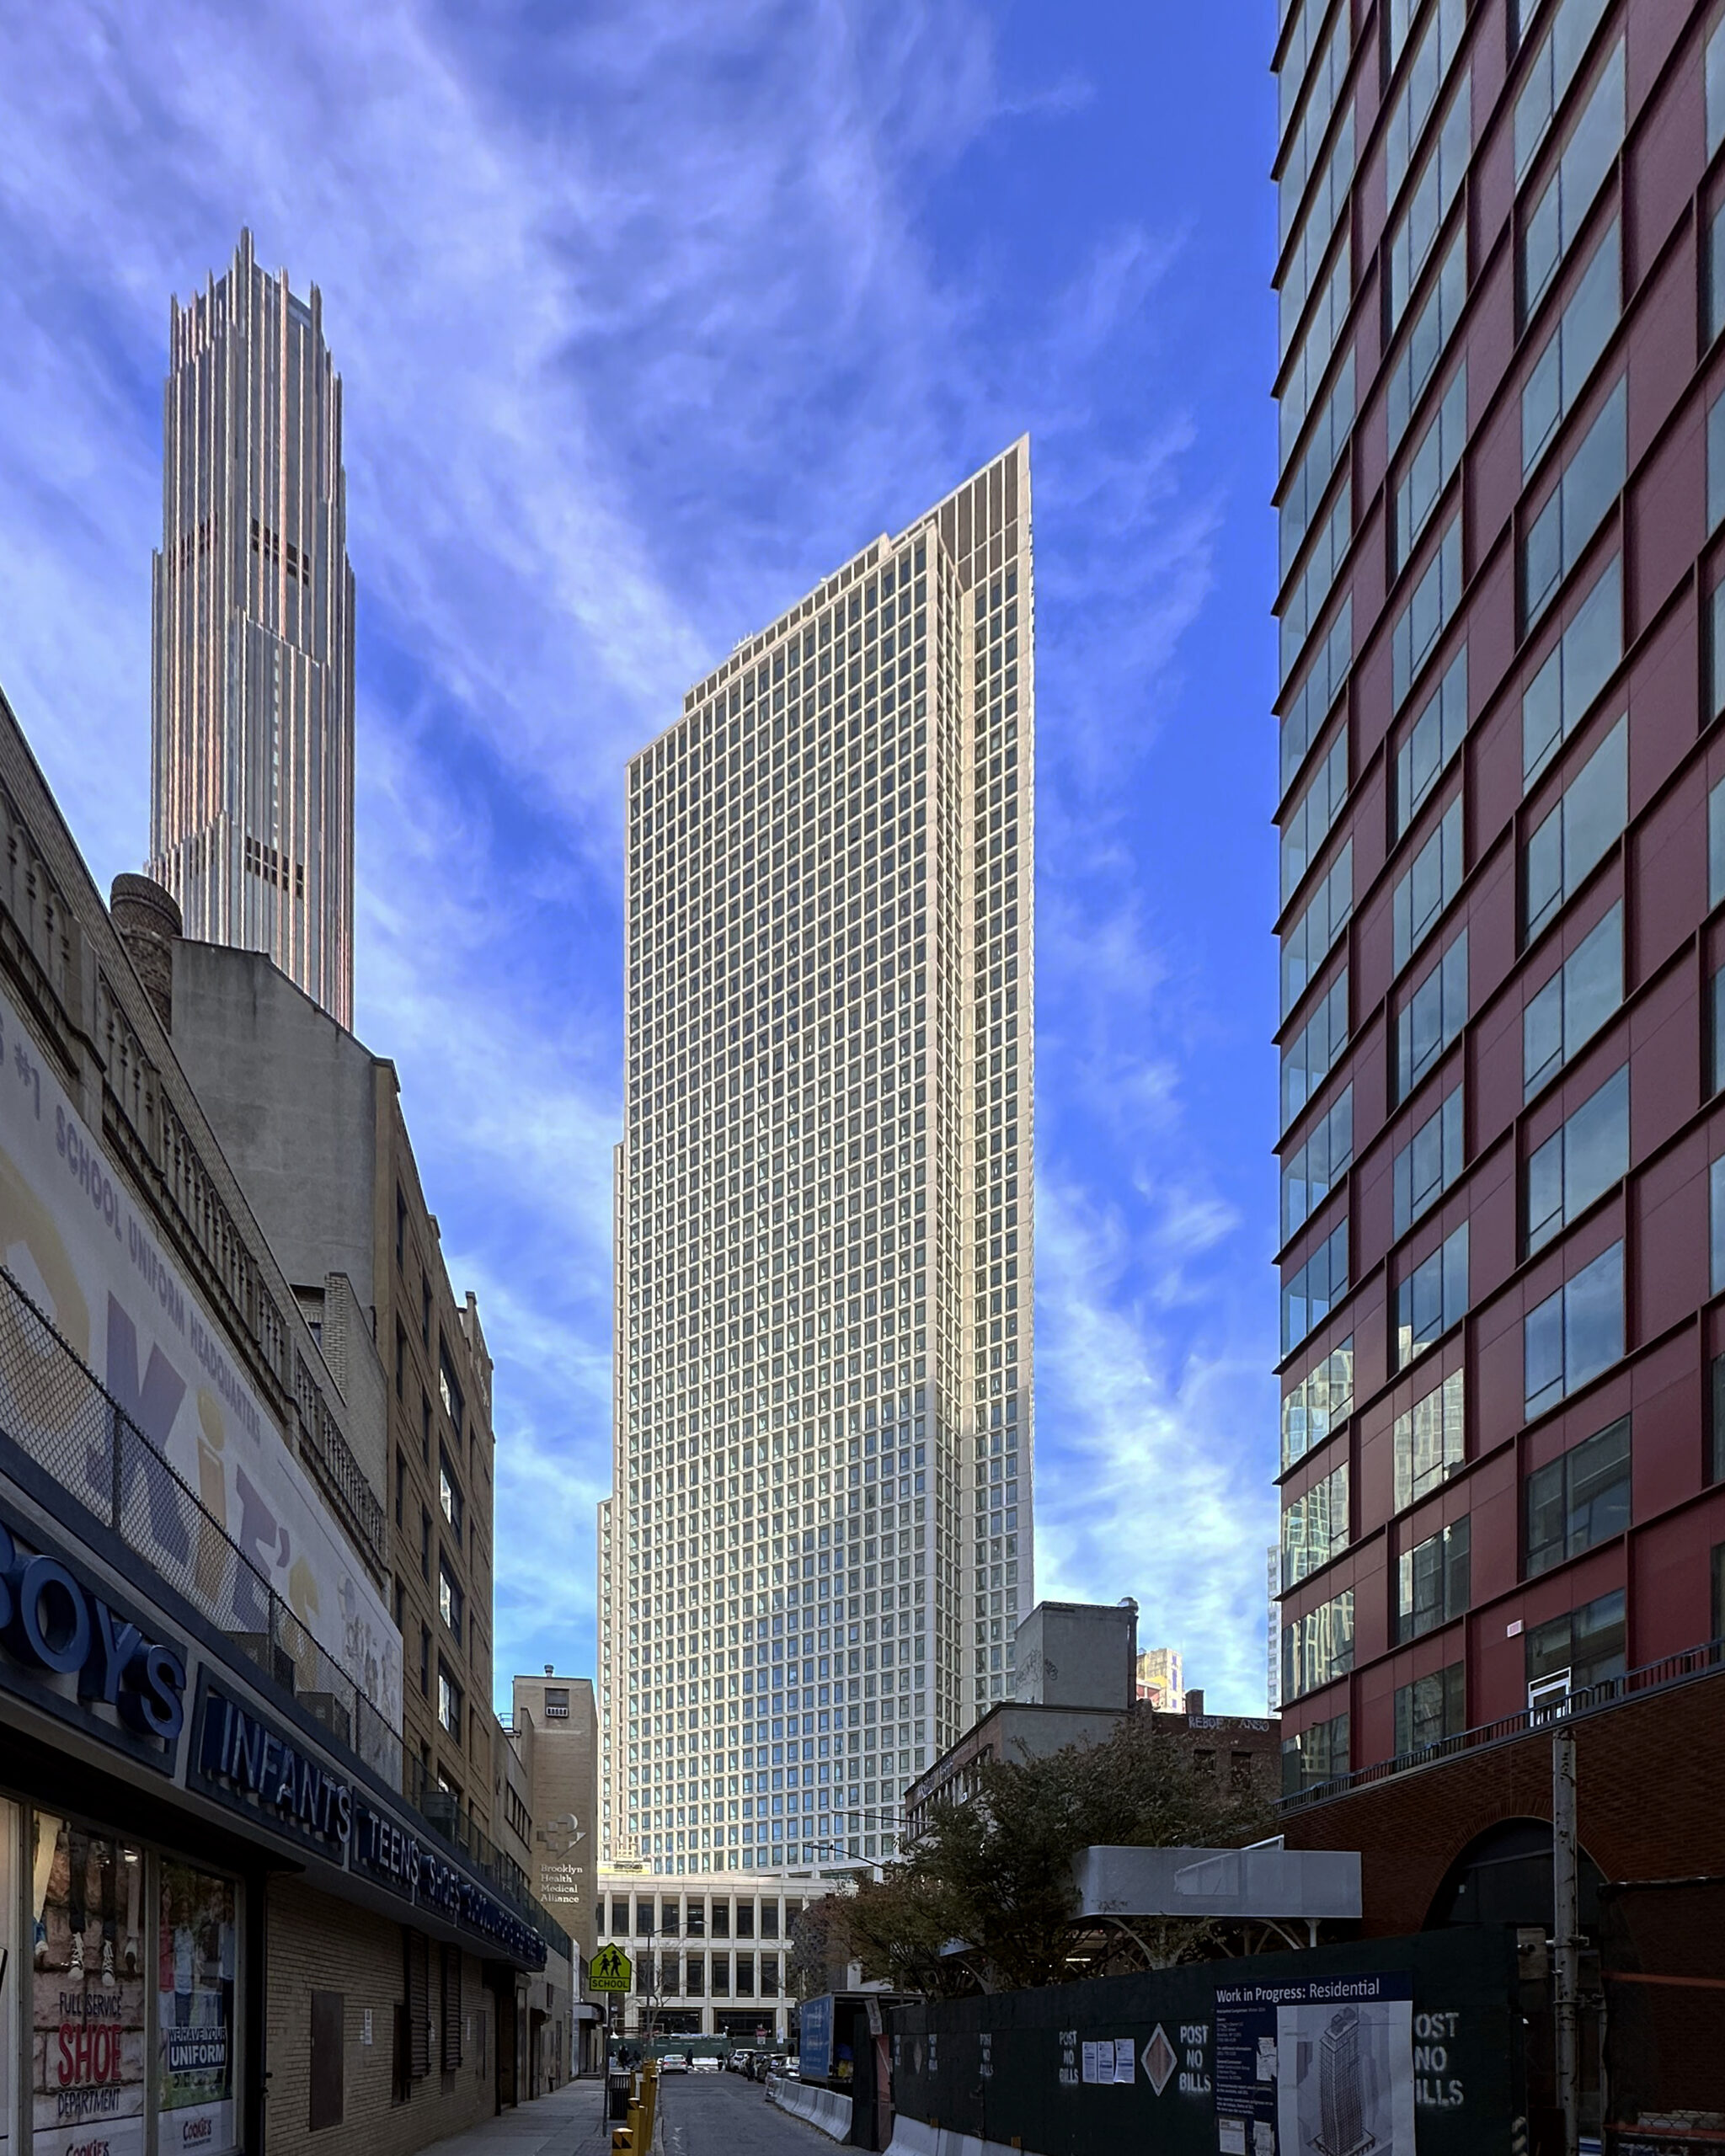
Photo by Michael Young
Photo by Michael Young
Photo by Michael Young
Photo by Michael Young

Photo by Michael Young
Photo by Michael Young

Photo by Michael Young
Subscribe to YIMBY’s daily e-mail
![]()
Follow YIMBYgram for real-time photo updates
Like YIMBY on Facebook
Follow YIMBY’s Twitter for the latest in YIMBYnews
What a great group of images. Thanks!
I totally agree that Michael Young’s images are great! However, since it’s five years of this survey, can we now start to include descriptions of the buildings that are pictured?
Hear, hear! I can’t remember all of these addresses! Please, Michael Young, et al—captions!
Wow, great information.
Excellent report, but why have two photos in here of that supposed hotel project at 450 11th Avenue? It’s going on 5 years of construction with no end in sight, in fact there is less glass on it than a few months ago, why? Where is the journalism YIMBY?
YOU ARE A LIAR Stanley. There is MORE glass on 450 11th Avenue right now than there was five months ago, and over a year ago. How does installing glass equate to LESS glass?!?! Have you been keeping track of Yimby’s updates or not??
I live at the Lyra rental tower to the north of the building site, and see workers installing glass where the hoist was attached. That image you’re talking about is from Yimby’s construction countdown in December. I’m sure they’re planning to do an update again soon because there IS more glass now.
But seriously stop with the false propaganda and slander against the building and Yimby.
By the way did you learn how to read street addresses in Long Island City yet???
Yes, and I can’t believe I’m saying this, but I kind of like the covering treatment for the blank eastern and southern walls of the hotel, it works as an interesting contrast to the hyperactive glass facade.
I like the blank sides now that it’s black and not just bare concrete. Makes it look like that monolith from 2001: A Space Odyssey right now haha
He’s right Stanley, there’s been a new section of glass where the hoist was and it’s the last major part of the facade to be filled in right now.
Where are you getting the idea that they’re removing panels of glass?
Again, excellent photos. I can’t wait to see the latest in construction in the Big Apple. You always come through. Thank you! I sure do enjoy your posts!
I love Michael’s photos too!
Just here for the photography and it is epic!
Same! It’s like a nice refresher of the past several months and looking back at some of Michael’s best work.
So this is ok for construction and employment in construction.
But the missing pieces are crucial:
1. How many of these units are housing, vs hotel? and even more importantly?
2. How many older units of housing are being lost to tear downs to make room for the new units?
Isn’t the net new housing unit count from all this activity the important issue here?
Thorough report, good job!..wanna see the rendering for 613 Madison Ave, when possible.
Are you sure you don’t mean 625 Madison Avenue?
613 Madison, at 68 floors is the quoted address here for the tallest building that filed for a permit in 2024..
THANK YOU…I have the same question / thoughts and think it extremely deceptive that hotel rooms (keys) are counted in the residential count yet are not legally able to be permanent housing or have anyone stay for more than 30 days and taxed commercially. Over-all less housing started than 2023 is not good at all for affordability in the next few years
Excellent, but why are there severally shots or the new JP Morgan Tower in a report on residential and hotel construction. And why weren’t hotel stats broken out?
The city has to stop making it so difficult, expensive, and time consuming to build in Manhattan.
Let’s see how things will look with the recent Midtown South rezoning and future uptick in new construction in that area. So excited to see that area revitalized!
I wish the city stats would not lump hotel rooms in with apartments—they are really two separate things.
True. Like are they quantifying the two equally based on where people can physically sleep/inhabit? Speaking of hotel, that pic of 450 11th Ave is so dope and can’t wait to see that one finished 👌🏾
“The total of 52,585 new residential and hotel units (primarily residential) recorded”
So the number of residential units is known, or it’s square footage based? This is an inexplicable age old puzzle.
Would be super helpful if the photographs were labeled as to what building is featured; especially for those of us in CRE outside of New York. Thank you!
I love that city, and its magnificent worldwide vibration…