As temperatures begin to drop, New York City’s construction market shows no signs of cooling down. New York YIMBY’s construction report for the third quarter of 2024, based on permit filings submitted to the Department of Buildings during the three-month period from July through September, shows strong filing activity that indicates momentum is continuing from the preceding quarterly tallies. In the third quarter, New York’s developers filed permits for a total of 1,071 new buildings, measuring a combined 26.8 million square feet with 18,935 residential and hotel units. Below, we break the data down in a series of detailed analyses. A complete data sheet, with detailed information on each proposed development, is available with a subscription to YIMBY’s Building Wire.
Number of permit filings per month
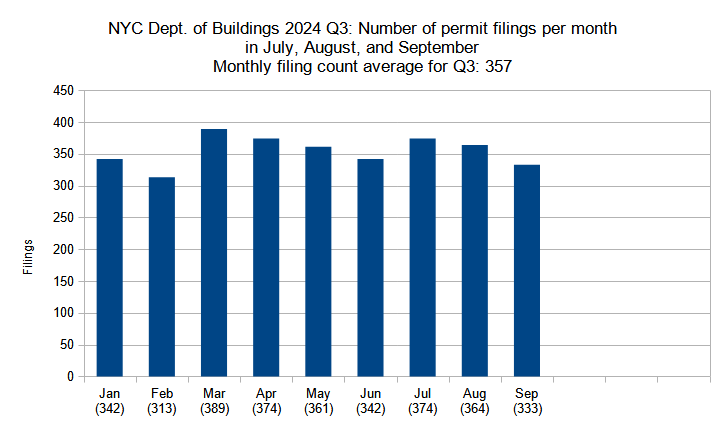
Number of new construction permits filed per month in New York City in Q1 through Q3 (January through September) 2024. Data source: the Department of Buildings. Data aggregation and graphics credit: Vitali Ogorodnikov
The third quarter of 2024 saw sustained strength in permit filing activity, with an average of 357 new building permits filed per month from July through September. The tally essentially matches that of the second quarter, dropping by just two permits from the Q2 average of 359. As such, Q3 2024 features the third-highest average since YIMBY began keeping count at the start of the decade, with the four past consecutive averages all comprising the top four places.
Number of permit filings by borough
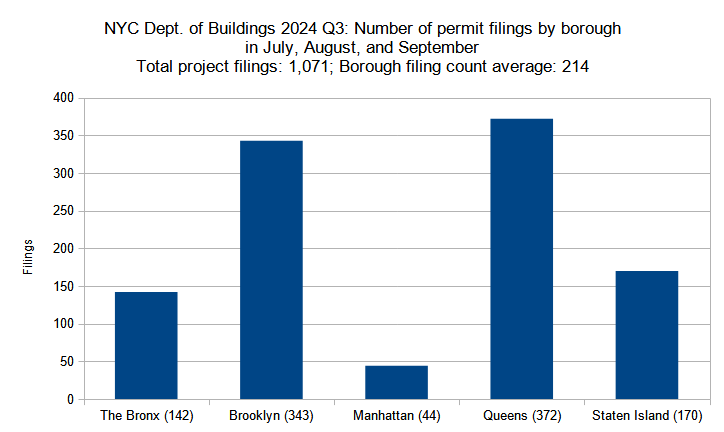
Number of new construction permits filed per borough in New York City in Q3 (July through September) 2024. Data source: the Department of Buildings. Data aggregation and graphics credit: Vitali Ogorodnikov
Below is the breakdown of borough statistic changes between the year’s second and third quarters:
- The Bronx: 28-percent increase (111 to 142 permits)
- Brooklyn: 3-percent decrease (355 to 343)
- Manhattan: 26-percent increase (35 to 44)
- Queens: 9-percent decrease (407 to 372)
- Staten Island: 1-percent increase (169 to 170)
In the third quarter, the greatest gains were observed in The Bronx and Manhattan, with 28- and 26-percent increases in total filing numbers, respectively. The tally for Staten Island remained virtually the same as in the preceding quarter. And while Queens and Brooklyn both registered single-digit percentage drops in filing counts (9 and 3 percent, respectively), the two boroughs still maintain a significant lead, with each accounting for around as many filings as The Bronx, Manhattan, and Staten Island combined.
Permits listed by unit count per filing
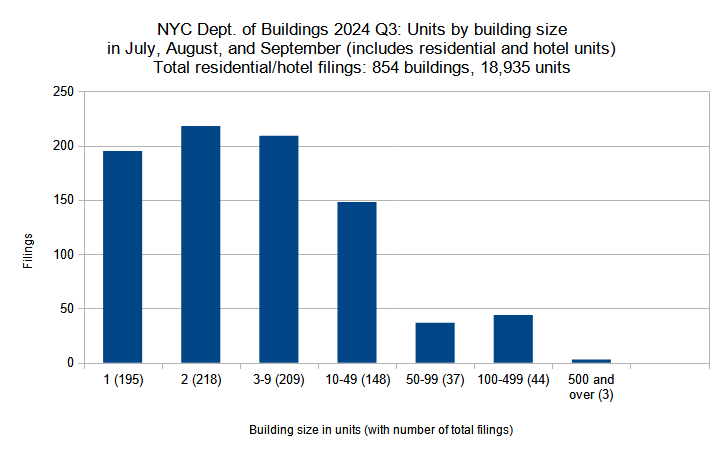
New residential and hotel construction permits filed in New York City in Q3 (July through September) 2024 grouped by unit count per filling. Data source: the Department of Buildings. Data aggregation and graphics credit: Vitali Ogorodnikov
Below, the filing size categories are compared between the two quarters individually:
- Single-family: 14-percent decrease (227 to 195 filings)
- Two-family: 17-percent decrease (263 to 218)
- Three to nine units: 14-percent increase (184 to 209)
- Ten to 49 units: 18-percent increase (125 to 148)
- 50 to 99 units: 37 units in both Q2 and Q3 each
- 100 to 499 units: 10-percent increase (40 to 44)
- 500 and over: none in Q2 to 3 in Q3
A total of 18,935 residential and hotel units were filed for in New York City in the third quarter of 2024, a dramatic 28-percent increase from the 14,795 units filed for in Q2. The increase is attributed to a growth in filings for larger multi-unit dwellings: while the single- and two-family categories saw double-digit percentage drops between the two quarters, every category with three or more residences per filing registered double-digit percentage increases. Notably, while no building with over 500 units was filed for in Q2, filings for three such developments are on the record books for Q3.
Residential and hotel units filed per borough
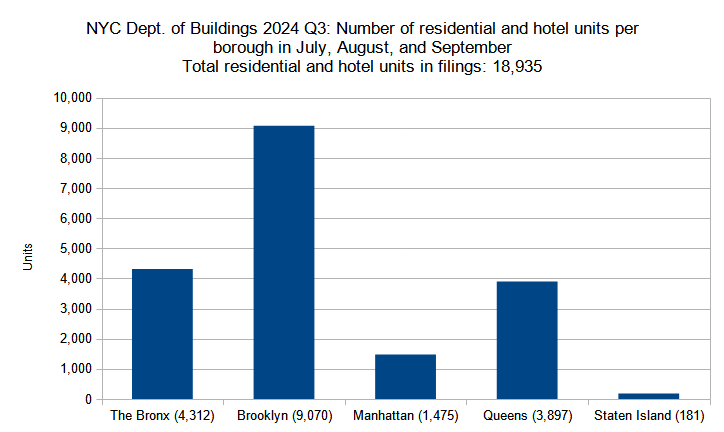
Number of residential and hotel units in new construction permits filed per borough in New York City in Q3 (July through September) 2024. Data source: the Department of Buildings. Data aggregation and graphics credit: Vitali Ogorodnikov
Below is a by-borough comparison between the two quarters:
- The Bronx: 38-percent increase (3,116 to 4,312 residential and hotel units)
- Brooklyn: 45-percent increase (6,247 to 9,070)
- Manhattan: 34-percent decrease (2,221 to 1,475)
- Queens: 32-percent increase (2,950 to 3,897)
- Staten Island: 47-percent increase (123 to 181)
Four of the five boroughs saw substantial double-digit percentage increases of residential and hotel unit filings during the third quarter of 2024. With over 9,000 unit filings, Brooklyn remains the undisputed leader. Though Staten Island’s 181 new filed-for units is low overall figure for a borough with half a million residents, it shows the greatest quarterly improvement with 47-percent growth. Manhattan makes for a notable exception to the trend, dropping by 746 units, or 34 percent, between the two quarters.
Permits listed by average unit count per filing
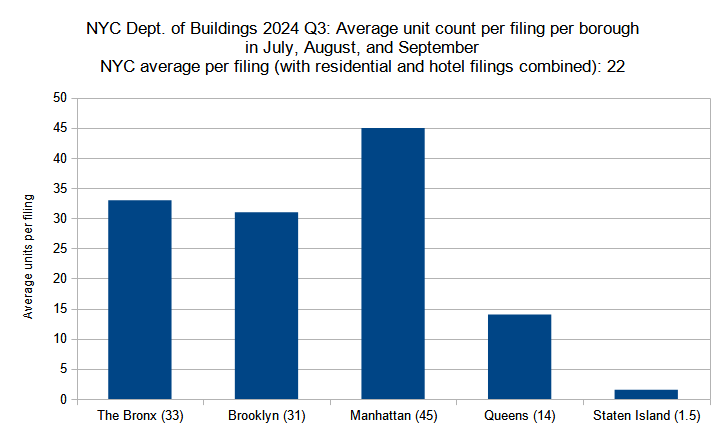
Average unit count (residential and hotel) per new construction permit per borough filed in New York City in Q3 (July through September) 2024. Data source: the Department of Buildings. Data aggregation and graphics credit: Vitali Ogorodnikov
Below is a by-borough comparison between the two quarters:
- The Bronx: 6-percent increase (31 to 33 residential and hotel units)
- Brooklyn: 55-percent increase (20 to 31)
- Manhattan: 45-percent decrease (82 to 45)
- Queens: 56-percent increase (9 to 14)
- Staten Island: 29-percent decrease (2.1 to 1.5)
In the third quarter of 2024, residential and hotel unit count averages per filing per borough generally echo the trends in overall unit count growth per borough. The average unit count per filing grew significantly in The Bronx, Brooklyn, and Queens. The count dropped by more than a quarter in Staten Island, slipping from 2.1 to 1.5 average units, though the borough’s construction market remains well within the single- to two-family residential category. And while Manhattan maintains the overall lead, the borough’s average unit count per filing decreased by nearly half.
Permit filings by floor count category
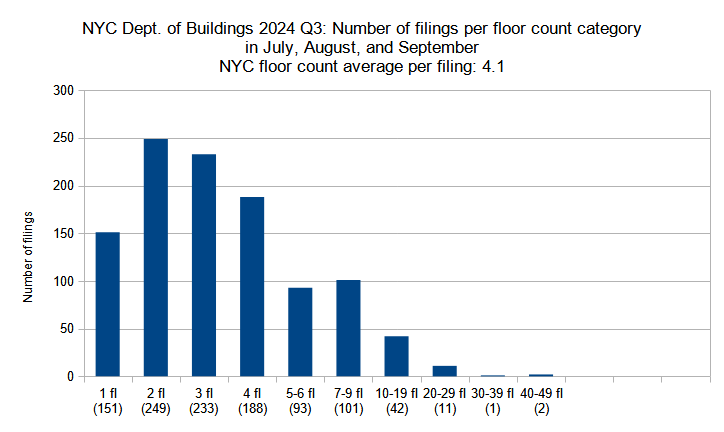
New construction permits filed in New York City in Q3 (July through September) 2024 grouped by floor count. Data source: the Department of Buildings. Data aggregation and graphics credit: Vitali Ogorodnikov
Below is a comparison per floor-count category between the two quarters:
- Single-story: 6-percent increase (142 to 151 permits)
- Two-story: 10-percent decrease (278 to 249)
- Three-story: 8-percent decrease (253 to 233)
- Four-story: 6-percent increase (178 to 188)
- Five to six floors: 93 in both Q2 and Q3 each
- Seven to nine floors: 3-percent decrease (104 to 101)
- Ten to 19 floors: 100-percent increase (21 to 42)
- 20 to 29 floors: 120-percent increase (5 to 11)
- 30 to 39 floors: 67-percent decrease (3 to 1)
- 40 to 49 floors: none in Q2, two in Q3
In the third quarter of 2024, the average filing saw a notable increase in floor count, growing from 3.7 in Q2 to 4.1 in Q3. Two of the three categories of filings with three stories and below saw drops in filing totals; on the other hand, four out of seven of the categories with four and more stories saw filing number increases, with the ten-19- and 20-29-story groups doubling their totals. While no filing in Q2 reached the 40-story mark, three filings matched or surpassed the figure in Q3.
Below are the top five permit filings with the highest floor counts in Q3 2024, in order:
- 51 Willoughby Street in Brooklyn (43 floors)
- 42-19 24th Street in Queens (40 floors)
- 188 Duffield Street in Brooklyn (30 floors)
- 574 5th Avenue in Manhattan (29 floors)
- 219 East 42nd Street in Manhattan (29 floors)
Average number of floors per filing per borough
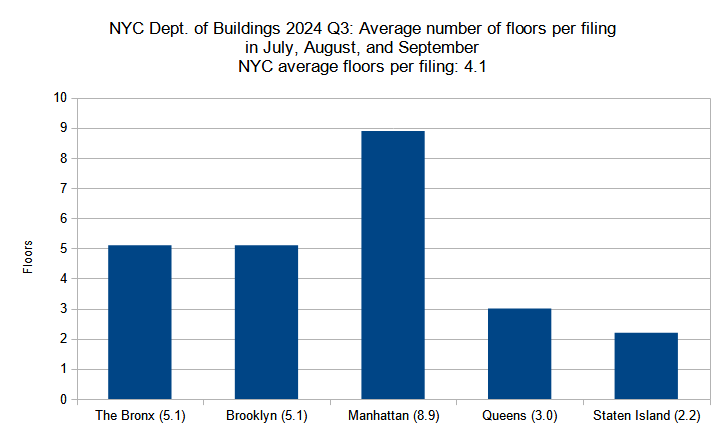
Average number of floors per new construction permit per borough filed in New York City in Q3 (July through September) 2024. Data source: the Department of Buildings. Data aggregation and graphics credit: Vitali Ogorodnikov
Below is the by-borough comparison between the two quarters:
- The Bronx: 5.1 floors in both Q2 and Q3 each
- Brooklyn: 13-percent increase (4.5 to 5.1 floors)
- Manhattan: 9-percent decrease (9.8 to 8.9)
- Queens: 11-percent increase (2.7 to 3)
- Staten Island: 4-percent decrease (2.3 to 2.2)
While the average floor count per filing increased, the overall trend line has remained stable. Manhattan, known for its vertiginous skyline, maintains a solid lead among the boroughs, although its floor count average per filing dipped from 9.8 to 8.9. Brooklyn caught up to The Bronx, matching its 5.1-story average. Queens and Staten Island trail with averages of three and 2.2 stories per filing, respectively.
Permits listed by floor area per filing
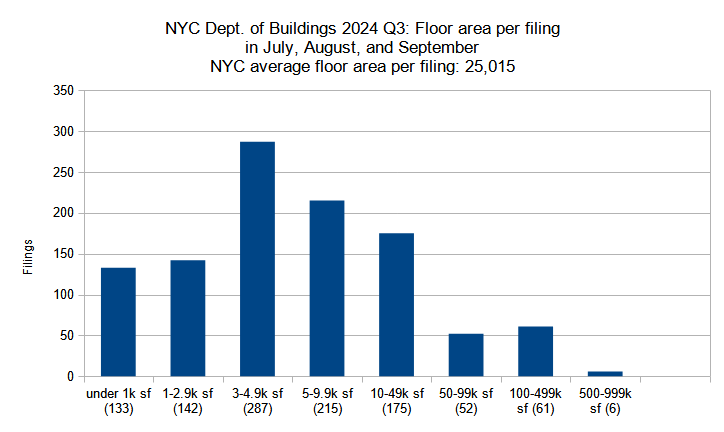
New construction permits filed in New York City in Q3 (July through September) 2024 grouped by total floor area. Data source: the Department of Buildings. Data aggregation and graphics credit: Vitali Ogorodnikov
Below is a breakdown by floor area category:
- Under 1,000 square feet: 7-percent increase (124 to 133 permits)
- 1,000 to 2,999 SF: 19-percent decrease (175 to 142)
- 3,000 to 4,999 SF: 3-percent decrease (297 to 287)
- 5,000 to 9,999 SF: under 1-percent decrease (216 to 215)
- 10,000 to 49,999 SF: 9-percent increase (160 to 175)
- 50,000 to 99,999 SF: 5-percent decrease (55 to 52)
- 100,000 to 499,999 SF: 27-percent increase (48 to 61)
- 500,000 to 999,999 SF: 500-percent increase (1 to 6)
The third quarter saw a dramatic 25-percent growth in the overall filed-for floor area, surging from 21.5 million square feet in Q2 to 26.8 MSF in Q3. The growth may be largely attributed to increases among the larger building categories, particularly for proposed structures with 10,000 or more square feet (roughly equivalent to a ten- or 15-unit apartment building). Notably, while the second quarter registered just one filing in the half-million-square-foot-plus category, the third quarter saw six such filings.
Total floor area filed by borough
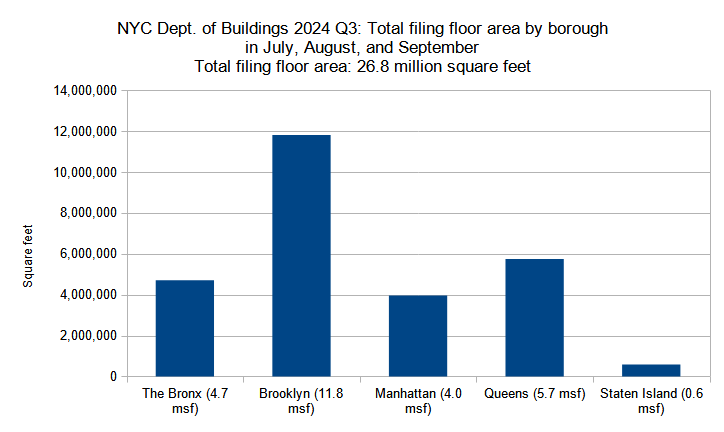
Combined floor area of new construction permits filed per borough in New York City in Q3 (July through September) 2024. Data source: the Department of Buildings. Data aggregation and graphics credit: Vitali Ogorodnikov
Below are the square footage totals per borough compared between the two quarters:
- The Bronx: 56-percent increase (3 to 4.7 million square feet)
- Brooklyn: 18-percent increase (10 to 11.8 MSF)
- Manhattan: 46-percent increase (2.7 to 4 MSF)
- Queens: 12-percent increase (5.1 to 5.7 MSF)
- Staten Island: 10-percent decrease (0.64 to 0.58 MSF)
The third quarter of 2024 registered an increase in filed-for floor area from 21.5 million square feet in Q2 to 26.8 MSF in Q3. This growth is rather relatively evenly distributed across the city, with almost every borough registering double-digit percentage growth. Even Staten Island, the only part of the city to show a percentage decrease, remains at an overall stable total of approximately half a million square feet of new floor space filed for both in Q2 and Q3.
Average floor area per permit filing by borough
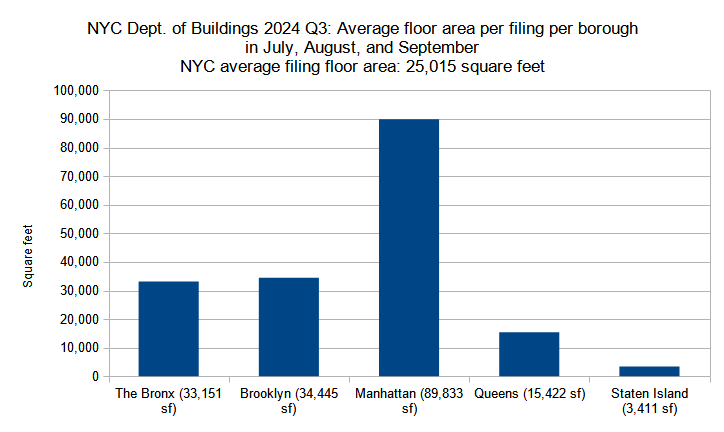
Average floor area per new construction permit per borough filed in New York City in Q3 (July through September) 2024. Data source: the Department of Buildings. Data aggregation and graphics credit: Vitali Ogorodnikov
Below is the quarterly comparison for the boroughs:
- The Bronx: 22-percent increase (27,248 to 33,151 square feet)
- Brooklyn: 22-percent increase (28,178 to 34,445 SF)
- Manhattan: 16-percent increase (77,130 to 89,833 SF)
- Queens: 23-percent increase (12,543 to 15,422 SF)
- Staten Island: 10-percent decrease (3,797 to 3,411 SF)
The floor area of the average permit filing increased significantly between the second and third quarters of 2024, growing from 19,938 to 25,015 square feet. Just as four out of five boroughs saw major increases in total filed-for floor space, they also observed concurrent double-digit percentage increases in average floor area per filing. Though Staten Island, still predominantly comprised of single- and two-family houses, saw a 10-percent drop in its filing size average, the overall decrease amounts to just 386 square feet per average filing, dropping from 3,797 in Q2 to 3,411 in Q3.
Photo by Michael Young
Subscribe to YIMBY’s daily e-mail
Follow YIMBYgram for real-time photo updates
Like YIMBY on Facebook
Follow YIMBY’s Twitter for the latest in YIMBYnews








It’s good that developers continue to break ground and build but unless we know how many units of housing these buildings replace we can’t see the most important indicator of growth- whether significant numbers of housing units are being added to the market.
In Manhattan we often see cases where the new buildings have fewer units than the ones they replace. So yes, this is an issue.
In theory, this is a valid question to ask. However, I compiled the data in the article, and I can say that this is not the case. After having gone through the 1,000+ individual permit filing entries, I’m hard-pressed to think of any new project on the list that demolishes/removes more units than it offers in their place, nor do I recall any project there that replaces any existing property with any significant number of residences. While I’m sure there may be a few existing unit removals here and there that I can’t remember right now (again, I’m just addressing thee Q3 filings here), this is definitely not an issue. The overwhelming majority of new residential developments is either built on vacant/underused land, parking lots, aging low-slung commercial structures, office-to-residential conversions, etc. There may be a few (again, to emphasize, only a few) instances where mixed-use rowhouses or tenements with ground-level retail and a few apartments above may be replaced, but such development generally takes place in Manhattan, so the new structures built in their stead would typically offer many more units. So no, “cases where the new buildings have fewer units than the ones they replace” is not an issue (it is, however, an issue in Philadelphia, where the city’s prevailing 38-foot height limit often results in rowhouses being replaced by other rowhouses of similar size and with similar unit counts, negating net residential gains).
The real issue is that the city is still not building anywhere near enough housing to match the high demand. The problem is not as much with the developers – clearly, they want to build, and when they do build, they almost always max out to whatever limits the zoning allows them to build. The key problem is low-density zoning, particularly along transit corridors, and the NIMBYs that want to preserve this low zoning in order to keep others out of their neighborhoods for their own self-interest.
Sure, Staten Island is a traditionally low-density borough and is not even connected to the city’s subway system, but for a borough with a population greater than that of Miami proper (not counting the metropolitan area), a total of only 181 filed-for residences over a three-month period is ridiculous.
I very much appreciate your reply. However, where I am on the upper west side it’s common. The Henry, profiled here a few weeks ago, will replace three 5-6 story buildings that housed over 60 units with a large, 16 or so story building with 44 units and pickleball. It’s far from the only example.
And more importantly, the City Planning Commission gives drastically different numbers than your quarterly reports would suggest. For example, on April 25, 2024,
“ Department of City Planning (DCP) Director Dan Garodnick today announced the update of the DCP Housing Database through 2023, and the release of two interactive online tools that visualize where new housing is being built and permitted within New York City. 27,980 new homes were constructed in New York City in 2023, which was a slight uptick from 2022. However, only 16,359 new homes were permitted, the lowest figure since 2016, ”
That last number, 16,359 for the year, approximates your quarterly numbers. Does City Planning talk to DOB? Something is off and needs explanation if not reconciliation.
Buildings in midtown should be required to be a minimum of 50 stories.
You’re either an idiot or a genius pretending to be an idiot.
And you’re an idiot that doesn’t have to pretend to be an idiot Mayor Kenny. How do you expect people to have an engaging conversation with you when all you do is insult everyone? Misanthropic #attentionwhore
Mayor Kenny seriously what is your problem having so much beef with so many people on Yimby? It’s astonishingly awful and tiring how much you complain
Why do you feel so emboldened to talk so pretentiously and snobbish Mayor Kenny? Seriously, it’s getting old as you probably are.
it’s already the most dense metropolitan city in the US and it’s sinking. You can build somewhere else
Staten Island has some of the biggest NIMBY people and it starts with the borough president,there’s so much that should be built in St. George and along Bay st but nothing happens
Build talker. It is NYC! Build taller, otherwise these smaller buildings take up valuable space without providing needed hosing capacity. It is simple. Again, this is NYC. What is the big deal. Red tape?
Why can’t YIMBY do this report for Chicago YIMBY? I truly just don’t understand why the people in NYC that fun this entire media page and all their subsidiaries don’t have a quarterly report for Chicago.