

During the third quarter of 2020, spanning the period from July through September, developers expressed confidence in the city’s long-term economic future, as evidenced by the 446 building permits filed during the period, nearly matching the 476 filings in the second quarter. Between these applications, which cover all types of projects, the new residential buildings permitted totaled 5,638 units, a decrease from 9,309 the previous quarter, and a drop from 8,063 units submitted in Q3 of 2019. Despite the drop in residential units entering the pipeline for the Five Boroughs, overall permitting activity remains relatively vigorous, and all filings are available in Excel format at the following link.
Overall, the share of filings per occupancy type has changed little from the second quarter. Residential filings continue to dominate the roster with 70.6 percent of the overall share, down 0.8 percent from Q2. The rest of the major categories exhibit single-digit variances. In an exclusive series of charts, New York YIMBY tallies the data by individual criteria, painting a nuanced picture of the projects that arrived on the drawing boards in Q3 2020.
Number of filings per proposed occupancy
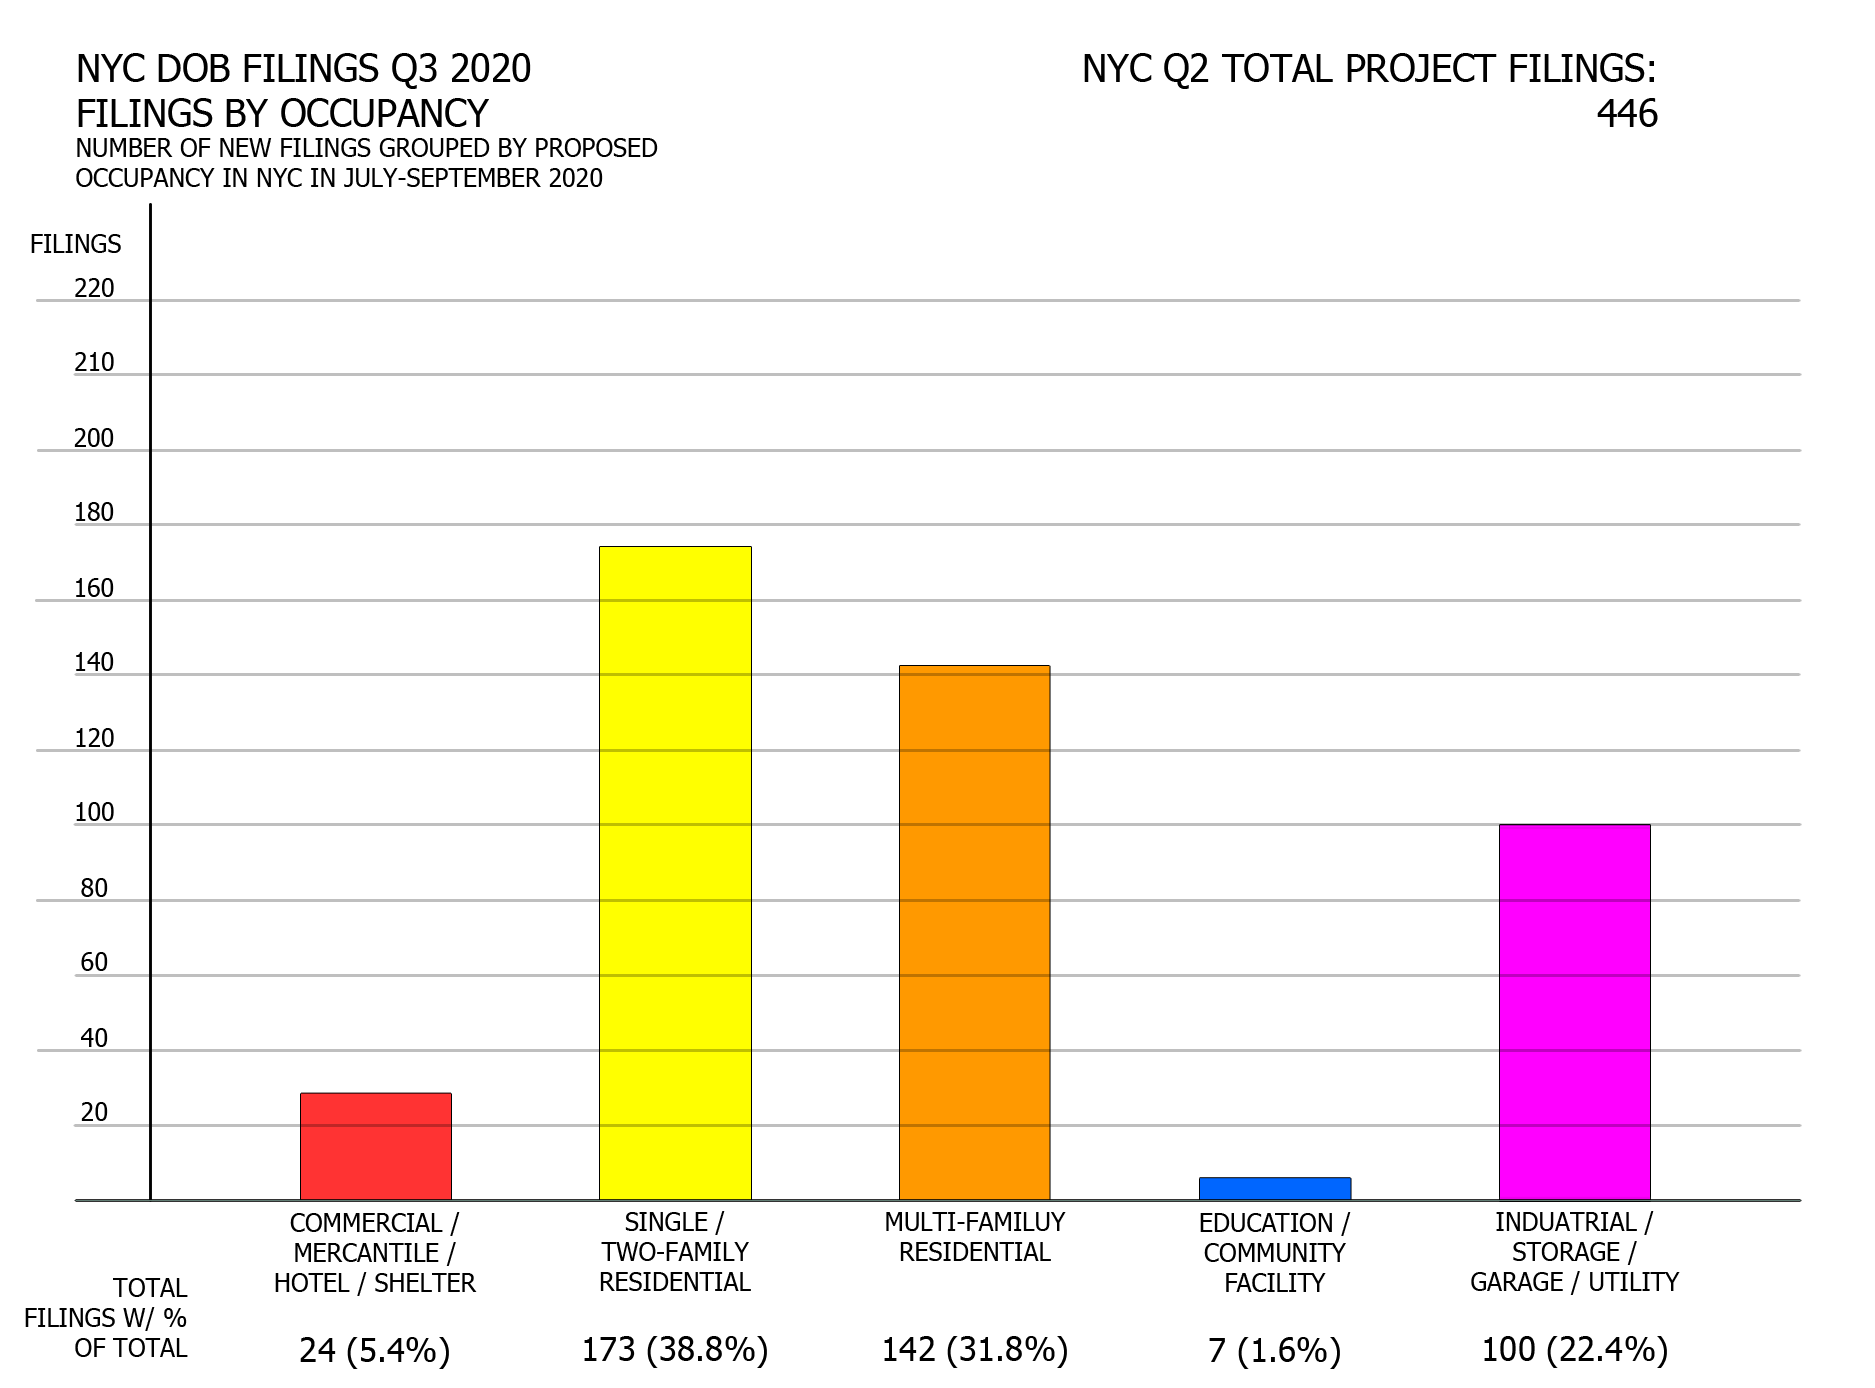
NYC DOB filings in Q3 2020 by occupancy type. Credit: Vitali Ogorodnikov
Residential filings continue to dominate as effectively as they did in the second quarter. However, this time single/two-family residential filings take precedence, edging out multi-family filings by seven percent of the total, while last year the former lagged behind the latter by 17 percent.
Commercial/mercantile/hotel/shelter filings dipped slightly by one-and-a-half percent of the total share from Q2. On one hand, the lack of commercial filings may be explained by a continued uncertainty in the office market, where work-from-home arrangement continues to predominate.
However, single-quarter filings paint an incomplete picture of the city’s future office market, with millions of commercial square feet under construction in skyscrapers such as 50 Hudson Yards, The Spiral, and Two Manhattan West, with many more megaprojects in planning across the boroughs, such as the Empire Station Complex, Anable Basin, and Innovation QNS, among many others. Permits for these developments are expected to be filed over the span of many months.
The count of hotel filings has tripled from the last quarter from two to six, indicating a resurgence in developer confidence in the hotel industry in one of the most tourist-visited cities in the world.
Floor area per proposed occupancy
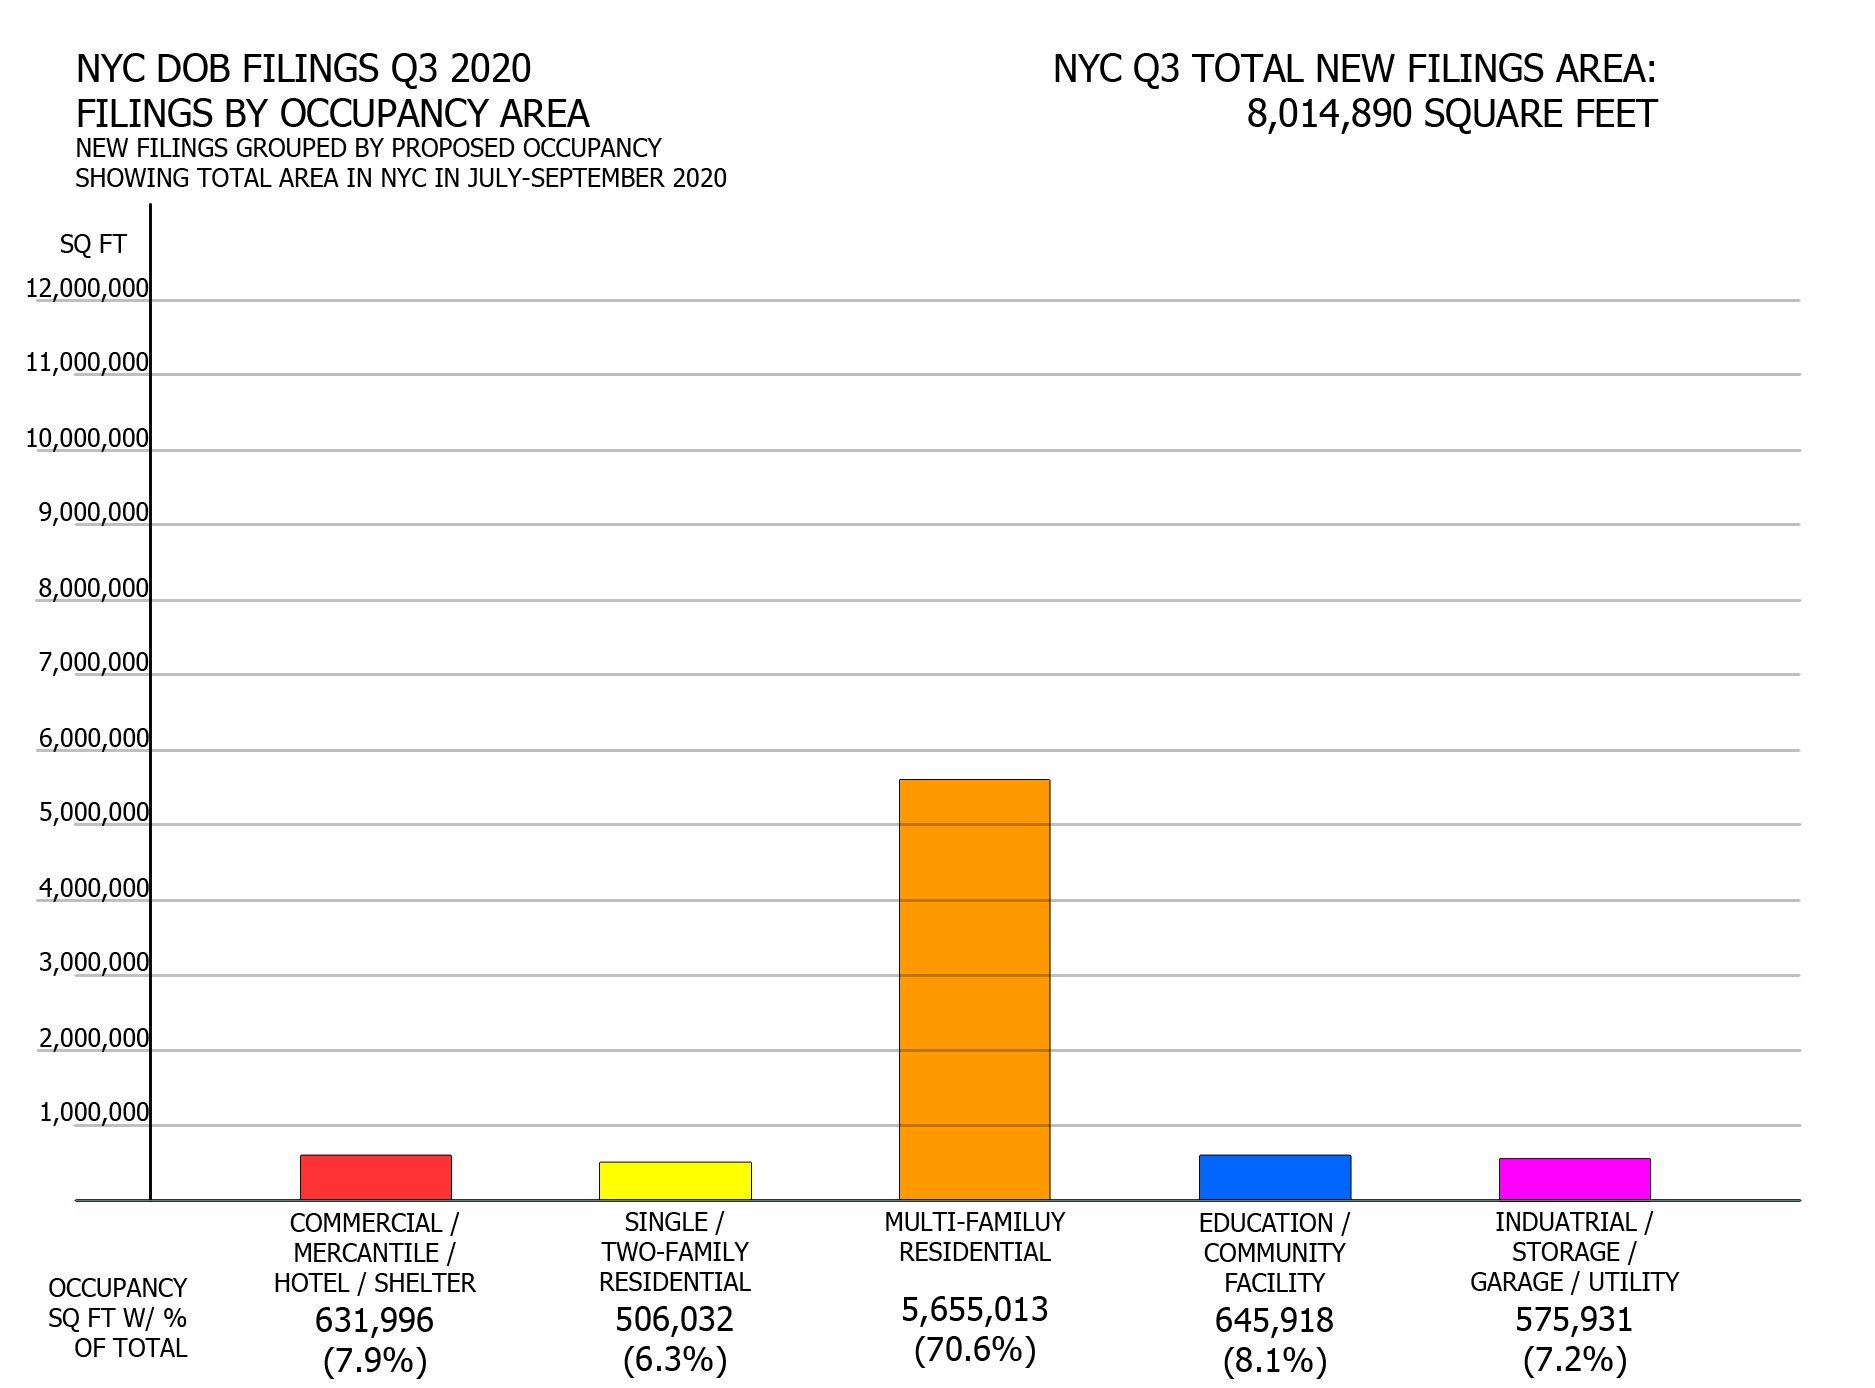
NYC DOB filings in Q3 2020 by occupancy area. Credit: Vitali Ogorodnikov
As expected, despite their lower total filing count, the total square footage of multi-family residential filings dominate single/two-family filings by more than a factor of ten, since multi-unit apartment buildings tend to span much greater floor areas than their single/two-family counterparts.
The steepest drop in the overall share of square footage is noted in the commercial/mercantile/hotel/shelter category, which fell from 39.8 to 7.9 percent over the third quarter. However, last quarter’ square footage count for the category was inflated by three massive Amazon distribution centers, which added to a combined 10,442,179 square feet, the lion’s share of the quarter’s total of the 11,923,746 square feet for the category. Without these outliers, the remaining number is more consistent between Q2 and Q3.
Filings grouped by floor count
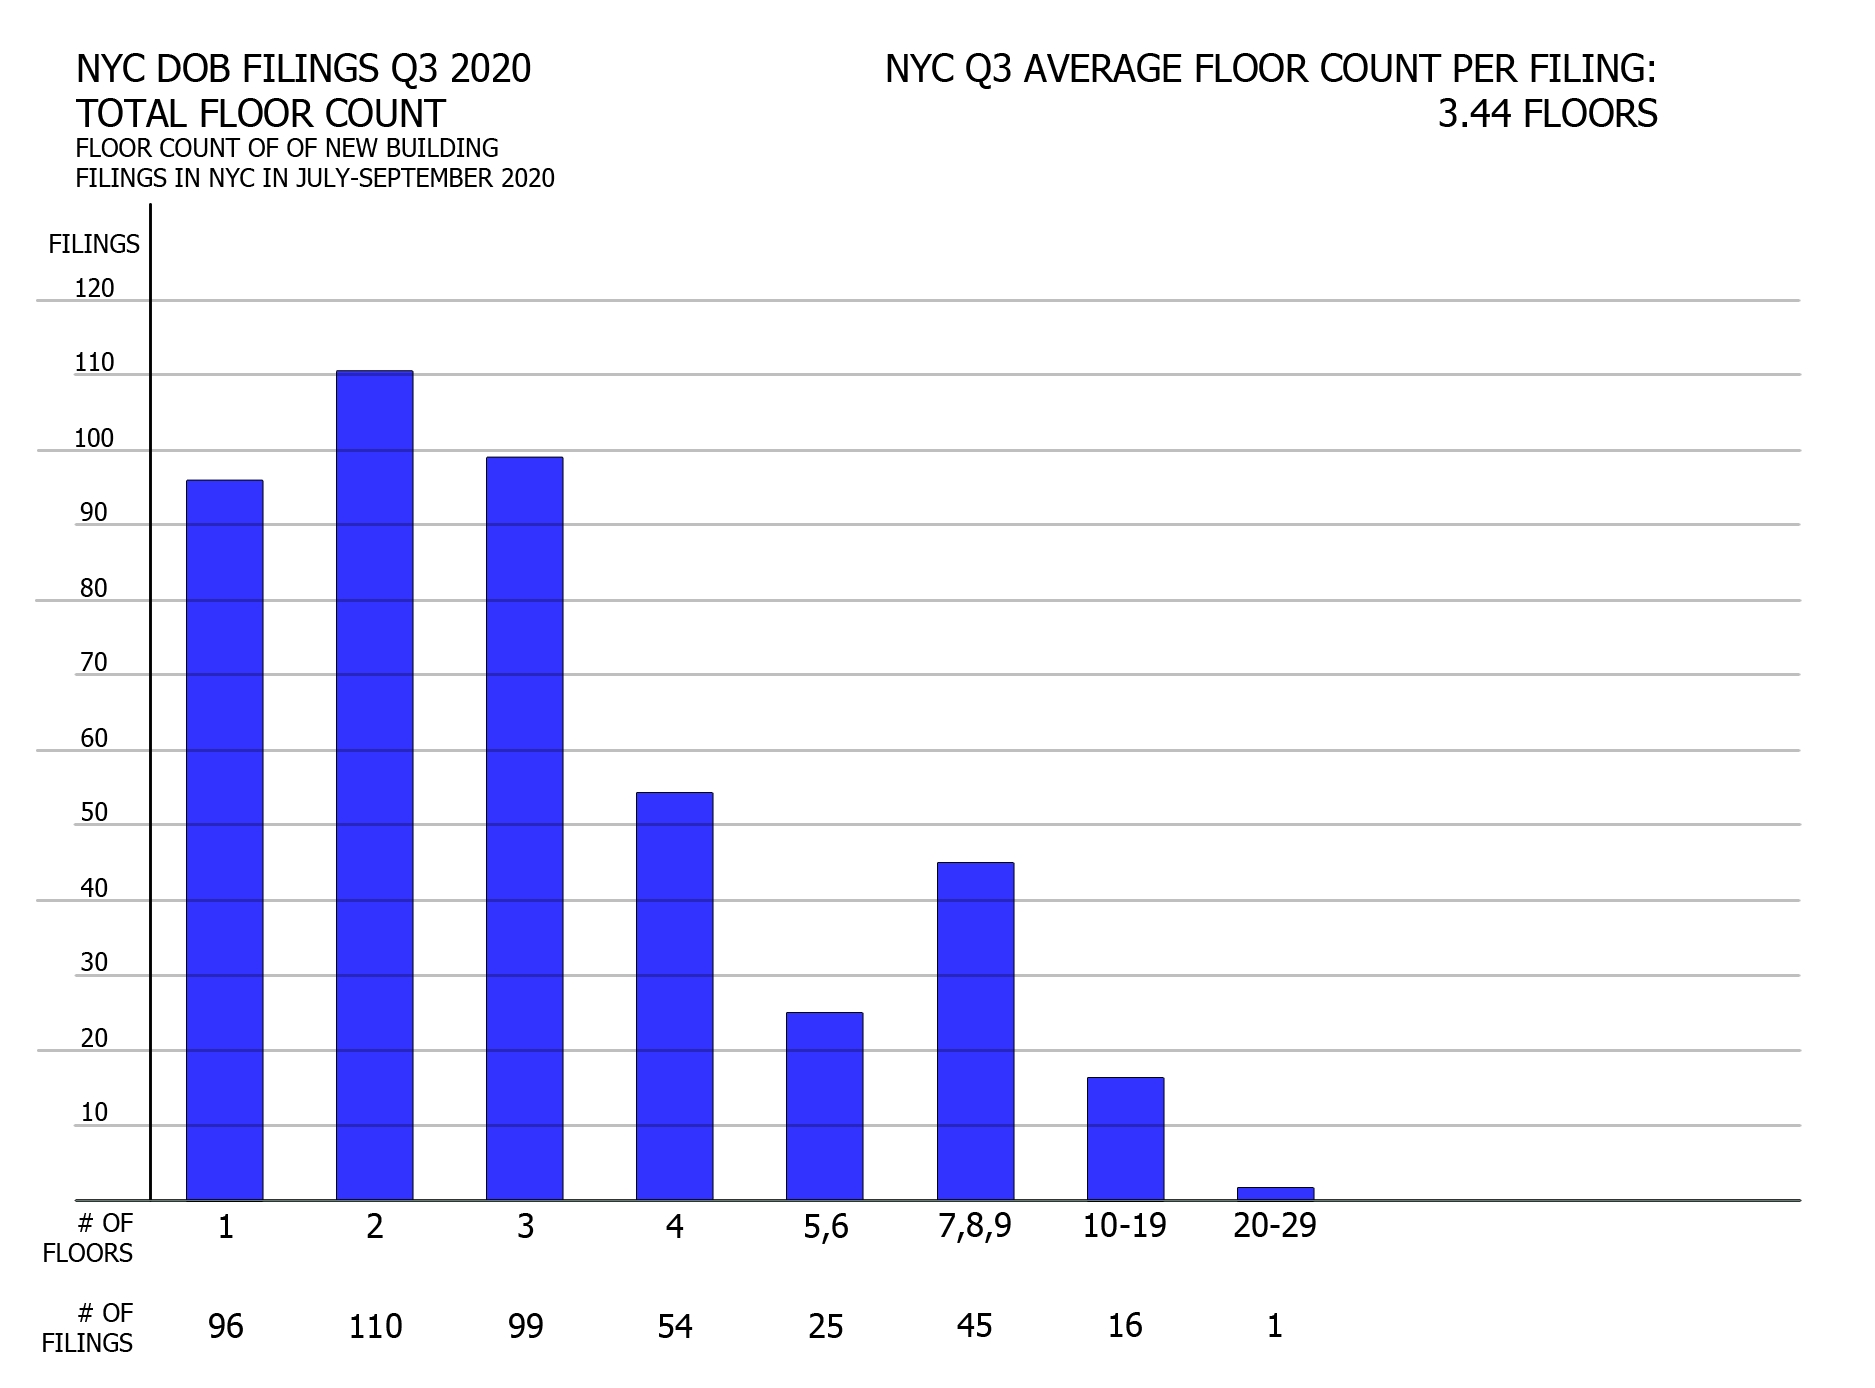
NYC DOB filings in Q3 2020 by floor count. Credit: Vitali Ogorodnikov
The skyline is the city’s boldest manifestation of its creative prowess, yet low-rise buildings have always predominated on New York’s cityscape. The third quarter saw a dramatic increase in filings for one- to three-story structures over the second quarter, boosting the share of low-rise (one- to four-story) filings from 70 to 80 percent of the total. Mid-rise buildings (five to nine stories) account for 16 percent of the total, slightly below last year’s 22 percent. High-rise buildings (ten stories and higher) comprise the remaining three percent, five percent points down from the Q2 figure.
In the second quarter, three of the tallest proposed buildings were all residential towers in Brooklyn. This quarter, Manhattan retakes the title of the city’s tallest proposal with 777 8th Avenue, a 23-story, 169-room hotel proposed in Hell’s Kitchen. The runner-up is an 18-story, 165-unit apartment building proposed at 26-25 4th Street on the Hallets Point peninsula in Astoria, Queens. Breaking conventional expectations, and possibly for the first time in the city’s quarterly filing history, the third-tallest (by floor count) filing is a self-storage facility that would rise 17 stories at 155 West 29th Street.
Filings grouped by floor area
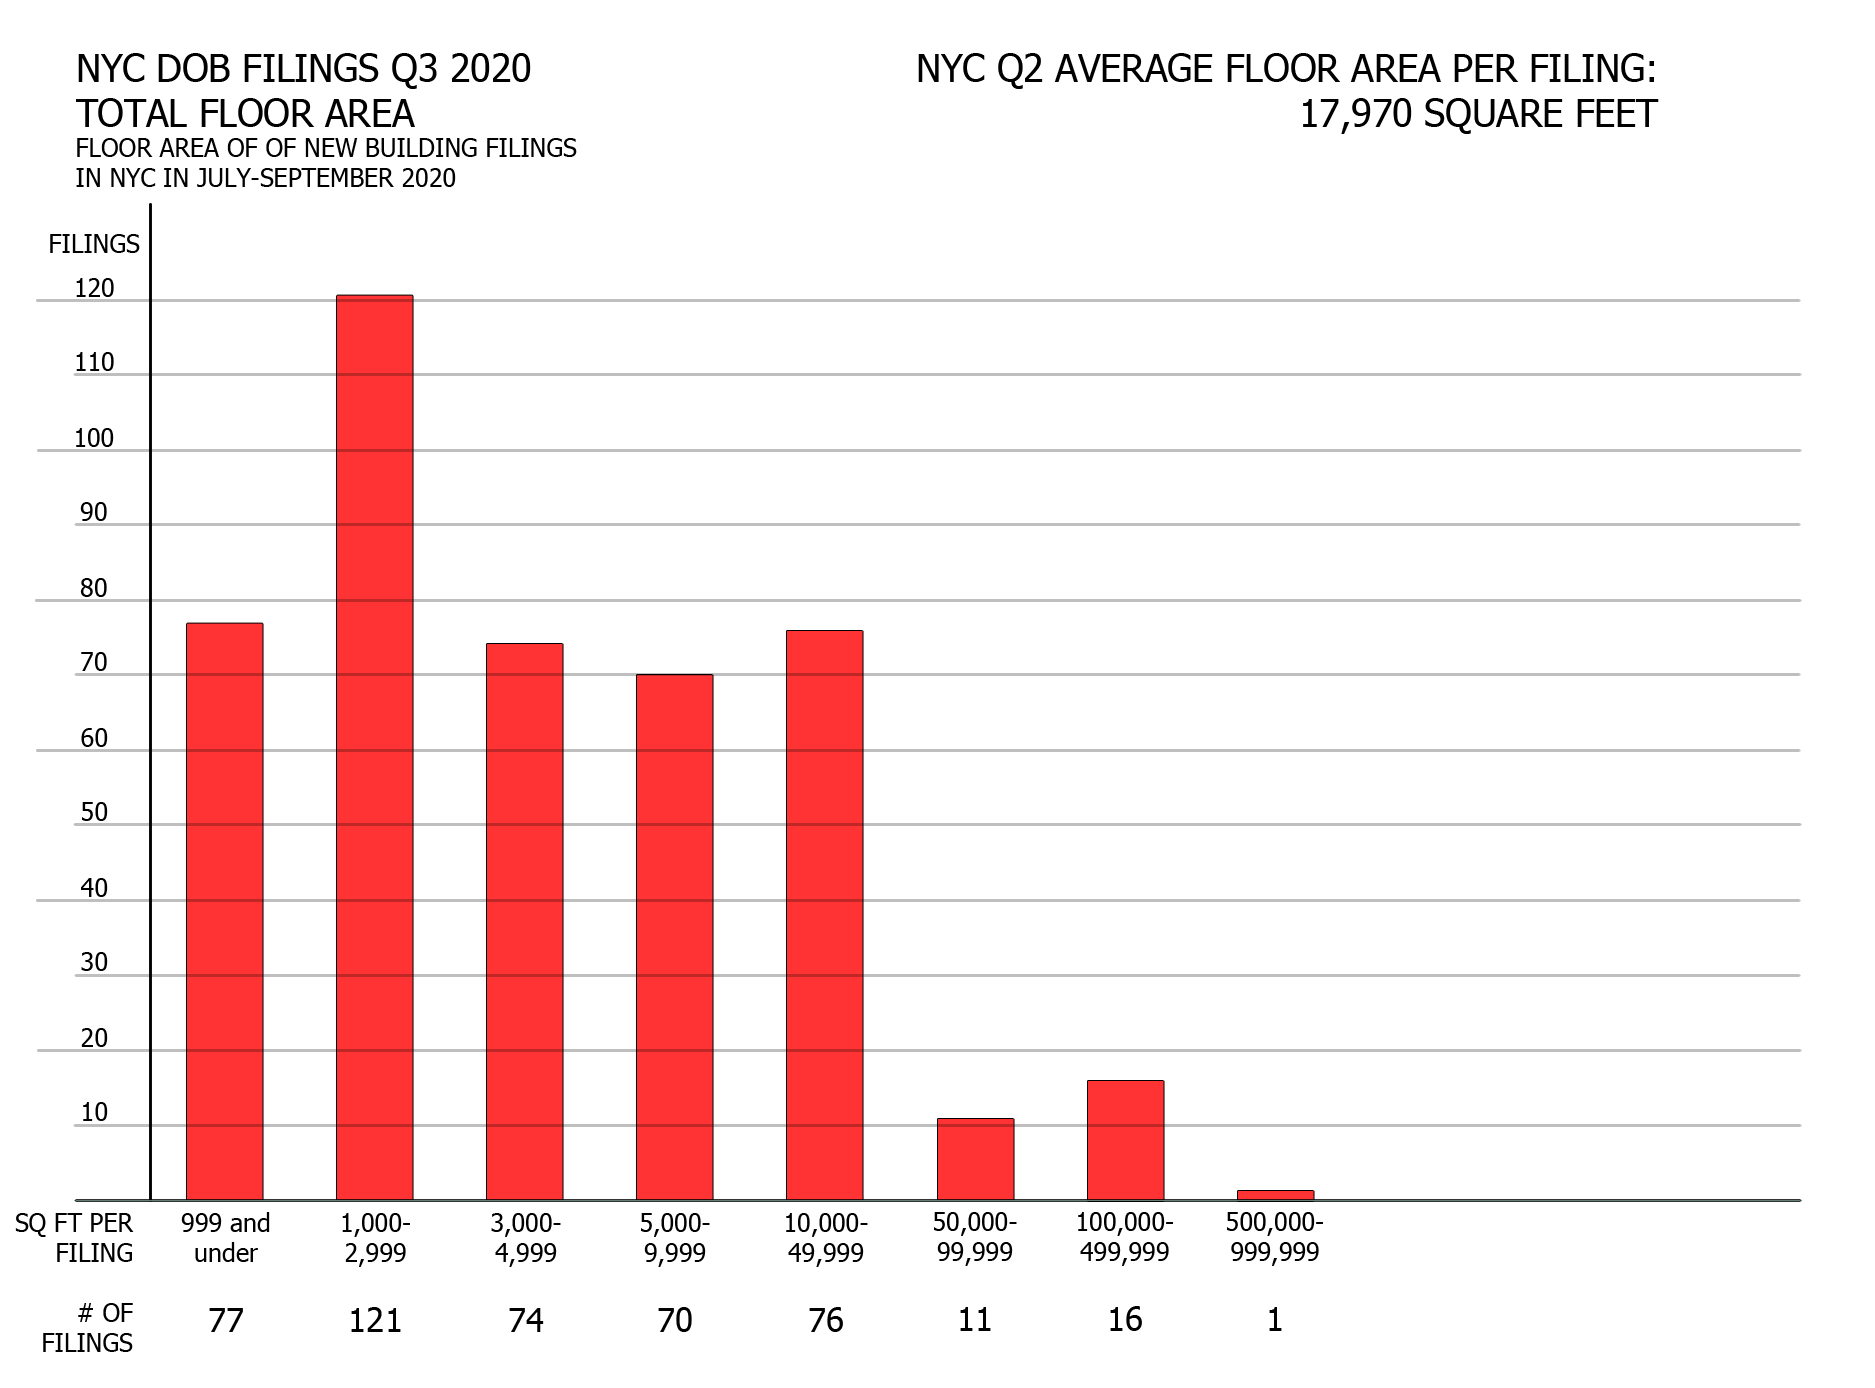
NYC DOB filings in Q3 2020 by floor area. Credit: Vitali Ogorodnikov
The Q3 filing count grouped by floor area follows a pattern very similar to that of Q2, with a predominance of filings spanning under 50,000 square feet. In the third quarter, such filings accounted for 94 percent of the total, slightly surpassing the prior quarter’s 86 percent tally. As before, the most prolific category spans the 1,000-2,999 square-foot range, which generally includes single- and two-family filings.
Number of filings per borough
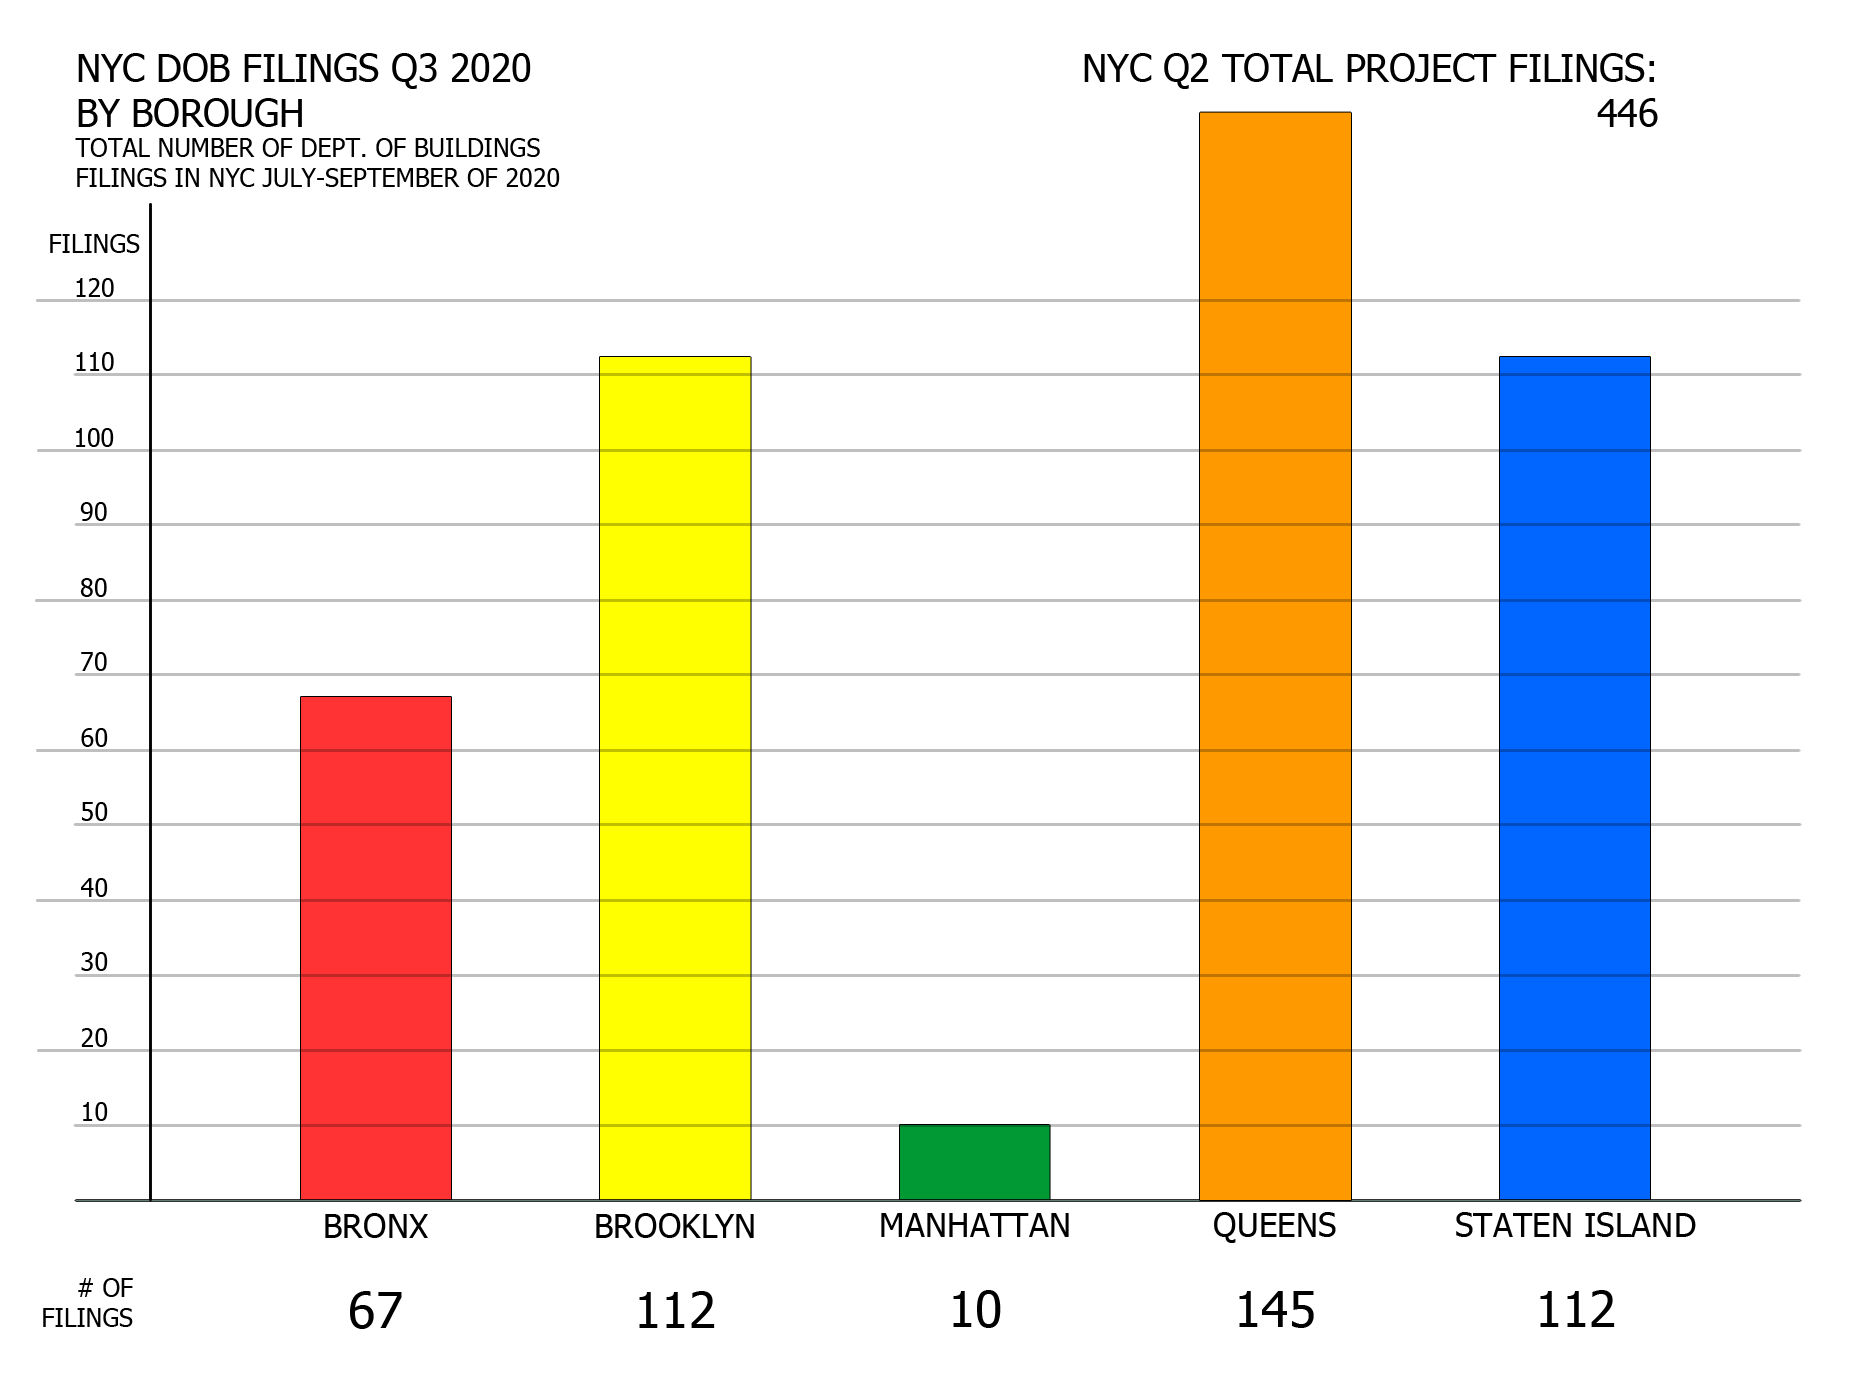
NYC DOB filings in Q3 2020 by borough. Credit: Vitali Ogorodnikov
In terms of the overall number of filings per borough, the general trend remains similar between Q2 and Q3, though three boroughs increased their counts and two saw their numbers drop. The Bronx increased its filing count by five to a total of 67. Brooklyn’s count dropped by a whopping 38 filings, down to 112. Manhattan dropped slightly less precipitously, by 29 filings down to 10. Filing counts increased in both Queens and Staten Island, with the former gaining six and rising to 145, beating Brooklyn for the highest count of any of the boroughs. Staten Island made the greatest overall gain, with an increase of 26 filings to a total of 112, tying Brooklyn for second place.
Average floor count per borough
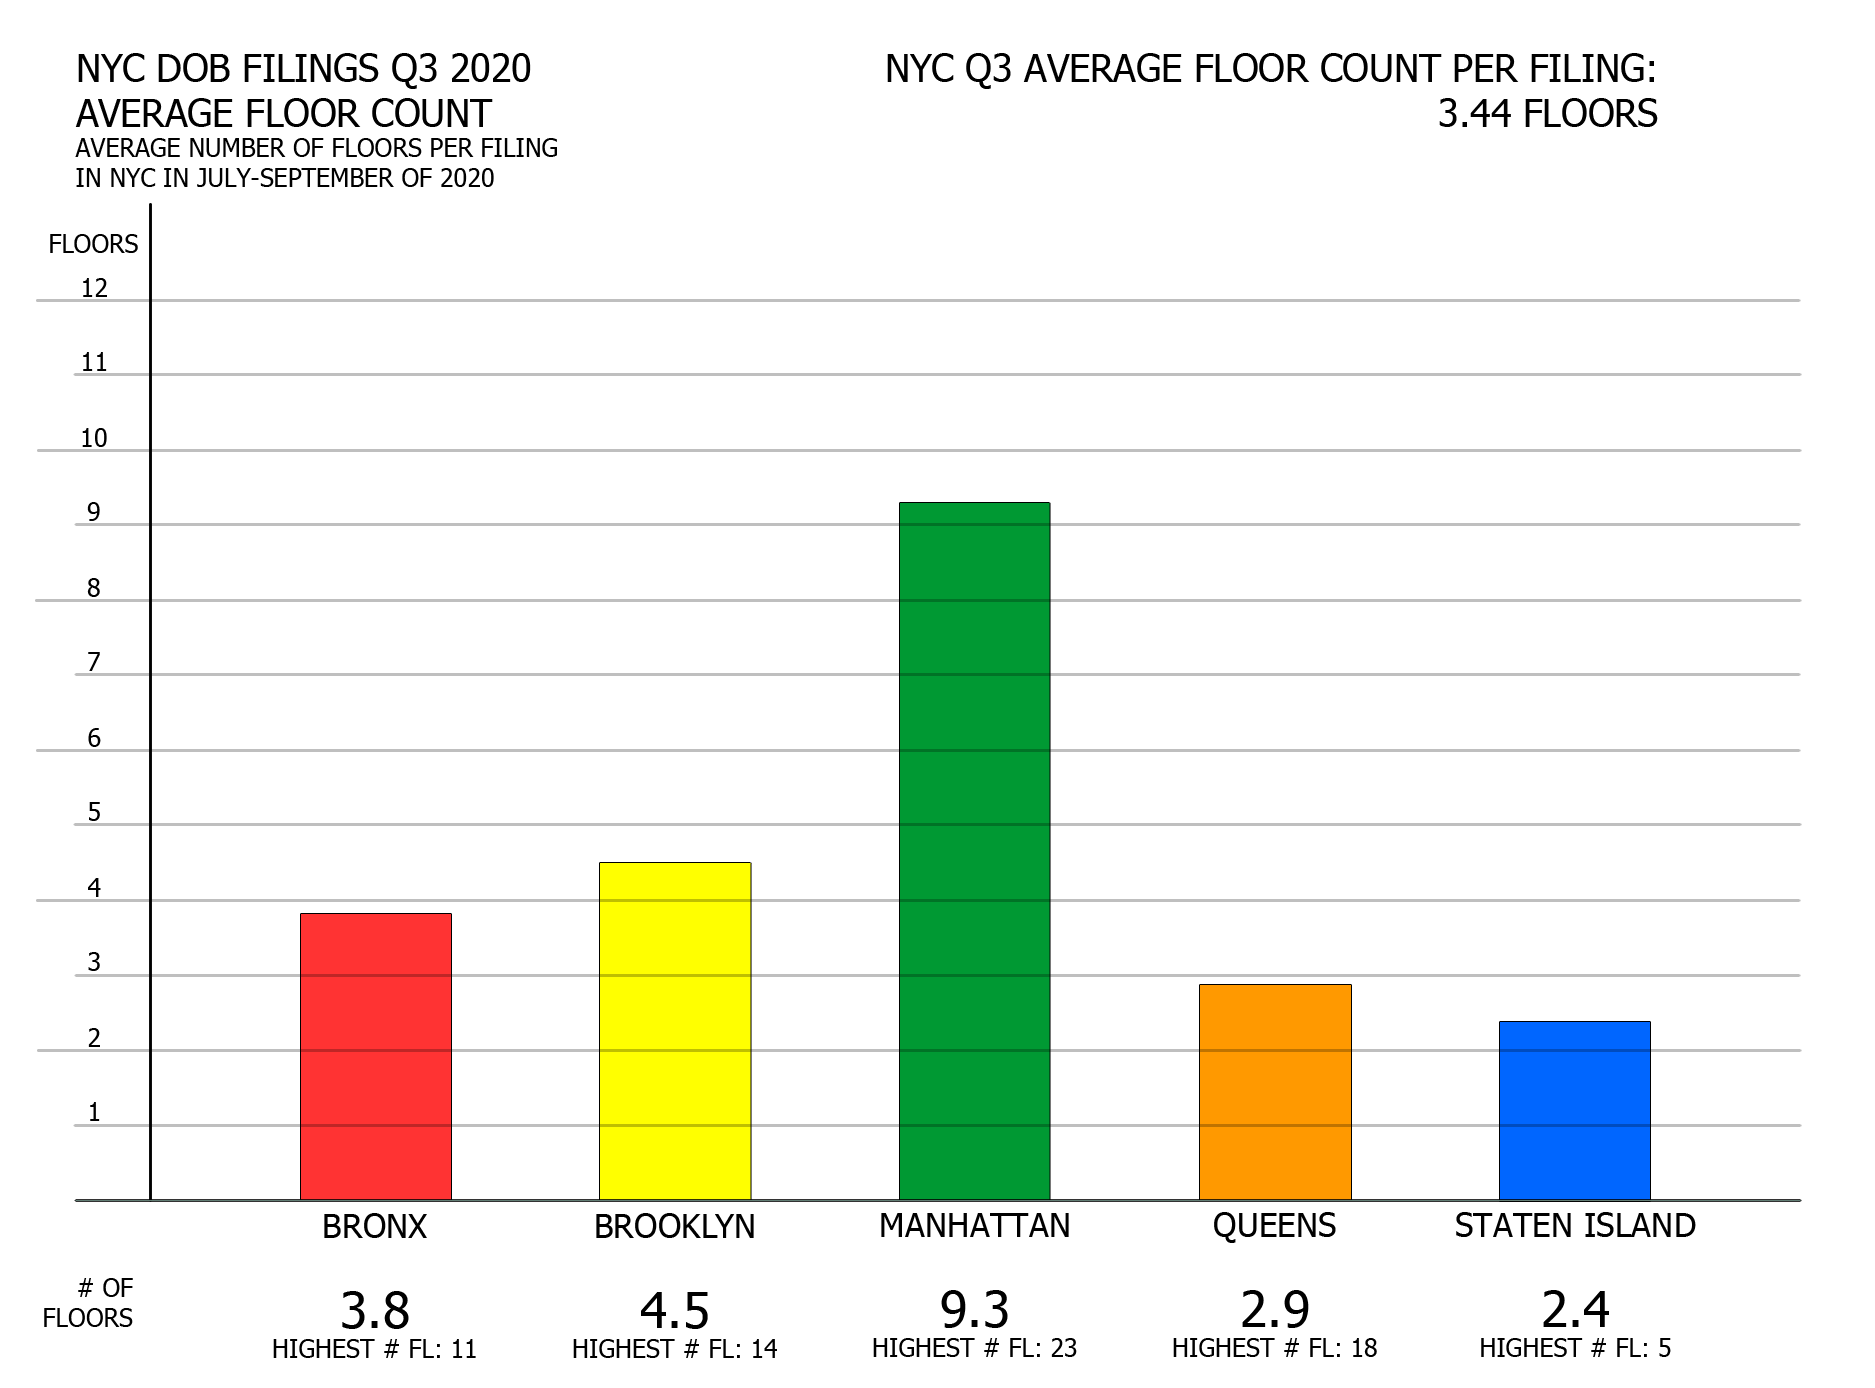
NYC DOB filings in Q3 2020 by average floor count per borough. Credit: Vitali Ogorodnikov
For the most part, average floor counts have remained stable for permit filings across the boroughs. Consistent with YIMBY’s earlier observation of an increase in low-rise filings in the third quarter, most boroughs have seen slight drops in the averages. The Bronx has seen the highest dip, lowering down by 1.7 floors to an average of 3.8 floors. Brooklyn, Manhattan, and Queens have counted more negligible drops, of 1, 0.6, and 0.2 floors respectively, down to the the averages of 4.5, 9.3, and 2.9 floors. Staten Island has remained the same at 2.4 average floors.
The building with the most floors proposed in in Manhattan and the city in general is 777 8th Avenue (23 floors, hotel). In Queens, the title goes to 26-25 4th Street (18 floors, residential). Brooklyn’s record-holder is located at 2700 Atlantic Avenue (14 floors residential), in Cypress Hills, far away from the still-growing skyline in Downtown Brooklyn. The building with the most floors in the Bronx is 2000 Valentine Avenue, with three filings at 11 floors each. Staten Island’s floor-count champion for Q3 is proposed at 372 St. Mark’s Place, centrally sited in St. George, with two filings each counting five floors.
Total proposed floor area per borough
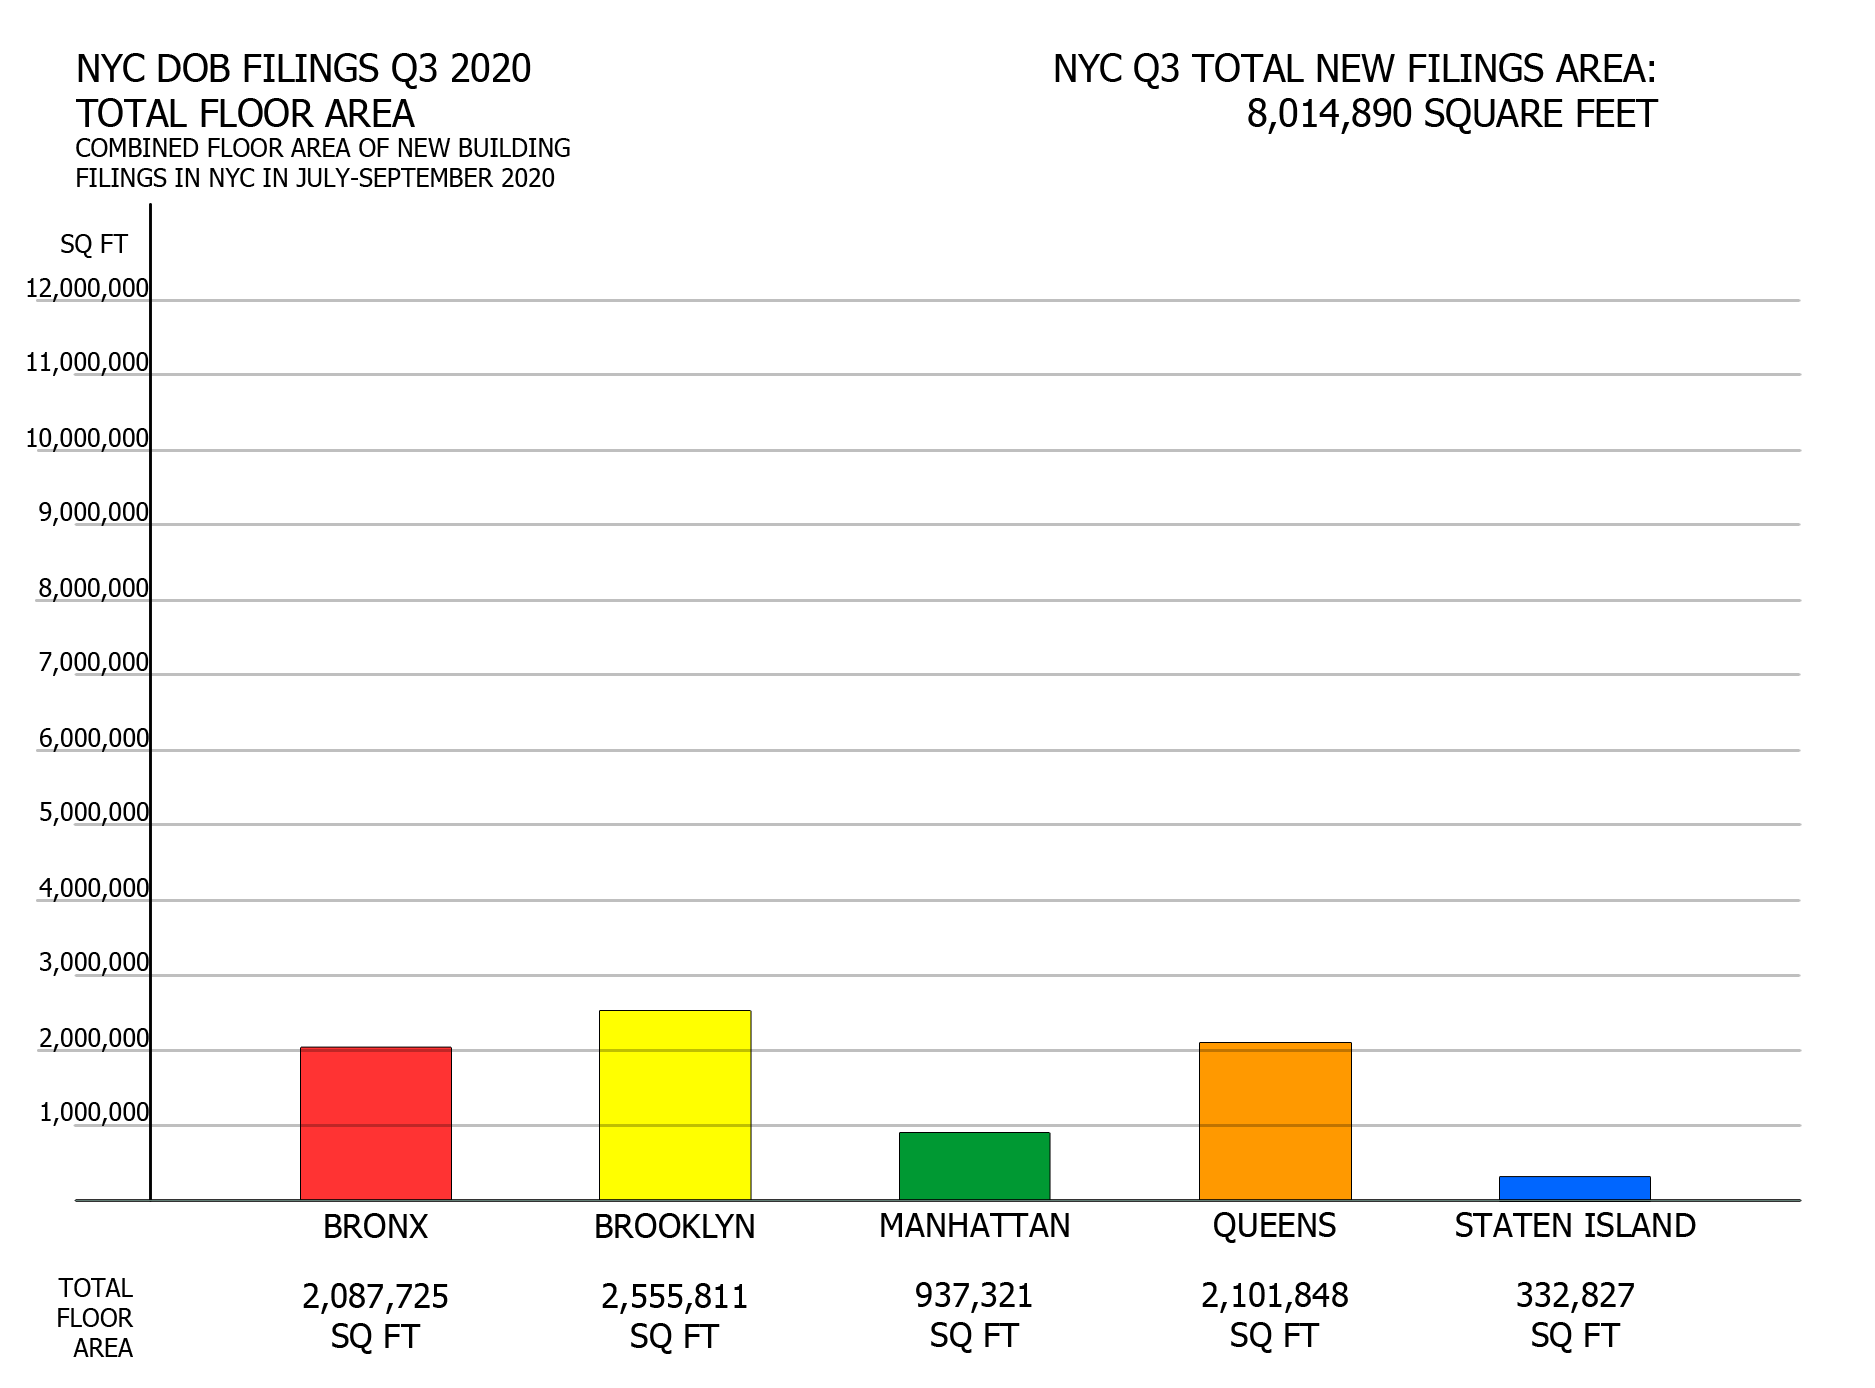
NYC DOB filings in Q3 2020 by total floor area. Credit: Vitali Ogorodnikov
In a way, the tally of total Q3 filings per borough somewhat mirrors the count of total filings per borough (two charts above). As seen in the aforementioned graph, Manhattan’s total square footage filed in July through August trail well behind that of the Bronx, Brooklyn, and Queens, though the count between the three is much closer this time, with Brooklyn barely edging out the Bronx and Queens.
In the last quarter, Staten Island was the surprise leader of the pack, with around twice as much total square footage than any other borough. This time, without the pair of Amazon distribution centers at 526 Gulf Avenue boosting its total by nearly 10,000,000 square feet, the island’s combined footage for the quarter is “normalized” to last place. Though SI is tied for second place with Brooklyn in terms of total permits, many of the filings represent single- and two-family houses and garages, the two typologies with the lowest average square footages.
Average floor area per borough
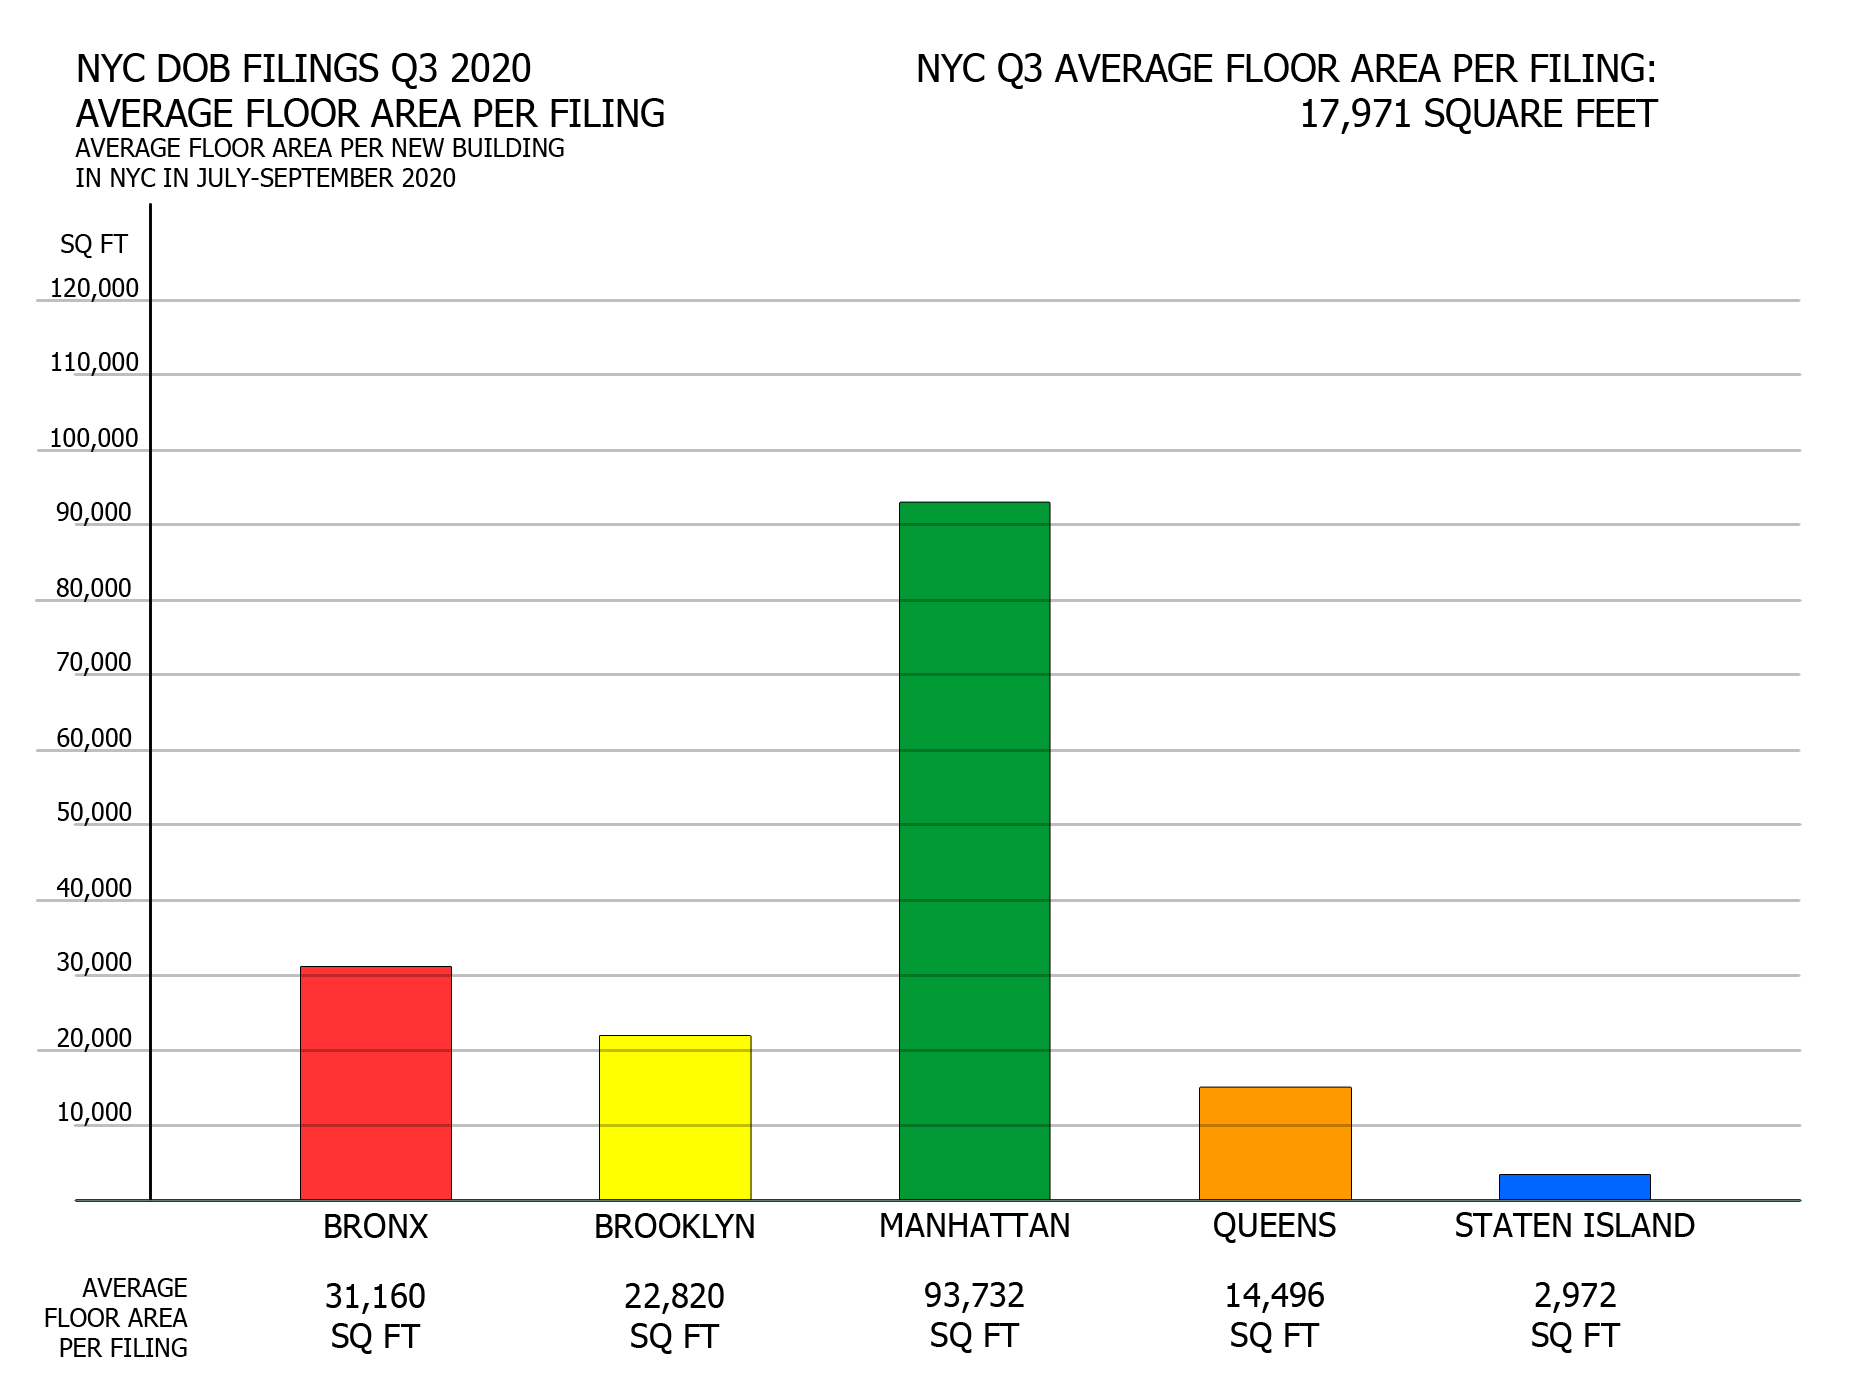
NYC DOB filings in Q3 2020 by average floor area. Credit: Vitali Ogorodnikov
As in prior charts, the increased prevalence of smaller-scale filings in Q3 explains much of the data. Large-scale proposals continue to predominate in Manhattan, where land is sparse and particularly expensive while the zoning is the most generous of all boroughs. The borough’s average filing size has actually increased in comparison to Q2, when it tallied an average of 80,470 square feet.
Average square footages per filing have dropped in the remaining four boroughs, most precipitously in Staten Island, where it fell nearly 50 times from 124,489 to 2,972 square feet. However, the borough’s median square footages remain relatively close to the previous count. Without several extraordinary outliers, such as two nearly 5,000,000-square-foot Amazon distribution centers at 526 Gulf Avenue and a 12-story, 274-unit residential building planned at 475 Bay Street, SI’s average square footage is more reflective of the single- and two-family flings that have dominated both quarters in total numbers.
Filings by borough and occupancy
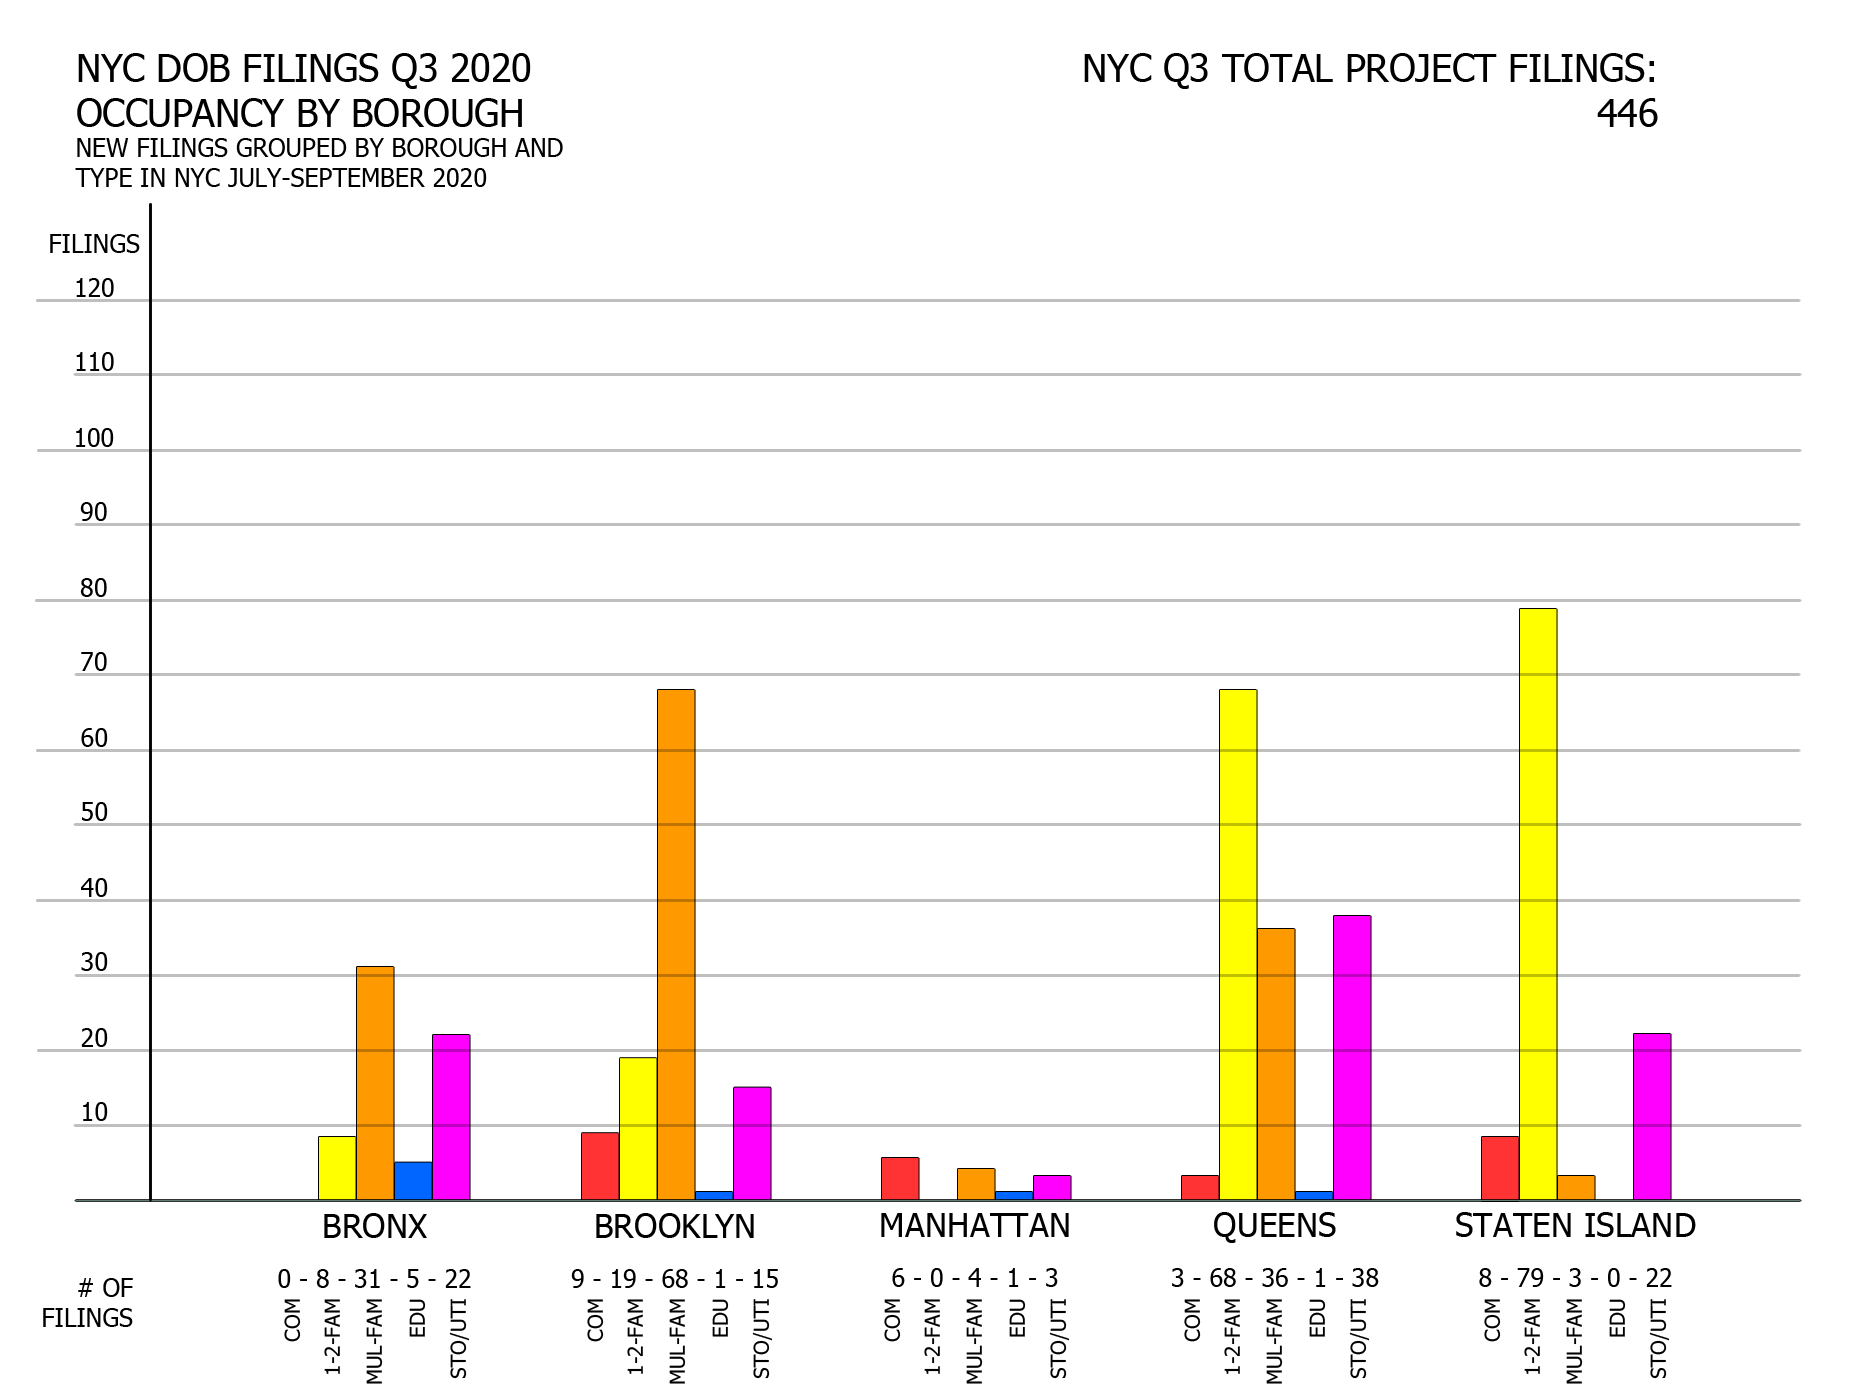
NYC DOB filings in Q3 2020 by borough and occupancy type. Credit: Vitali Ogorodnikov
With some exceptions, the general pattern of occupancy by borough in Q3 is consistent with that in Q2. As before, multi-family residential filings dominate in the Bronx and Brooklyn, two of the city’s three most densely populated boroughs. The number of multi-family filings has dropped off drastically in Manhattan, though the rest of the borough’s filing types remain almost entirely unchanged.
Once again, single- and two-family dwelling proposals predominate in Staten Island, actually increasing in Q3 from 58 to 79. The diverse borough of Queens contains large swathes that resemble anything from Brooklyn to Staten Island, and the borough features the most balanced count of single/two-family versus multi-family filings. In many instances, the storage/utility filings account for the garages, hence their predominance in the more car-oriented boroughs.
Total proposed units per borough
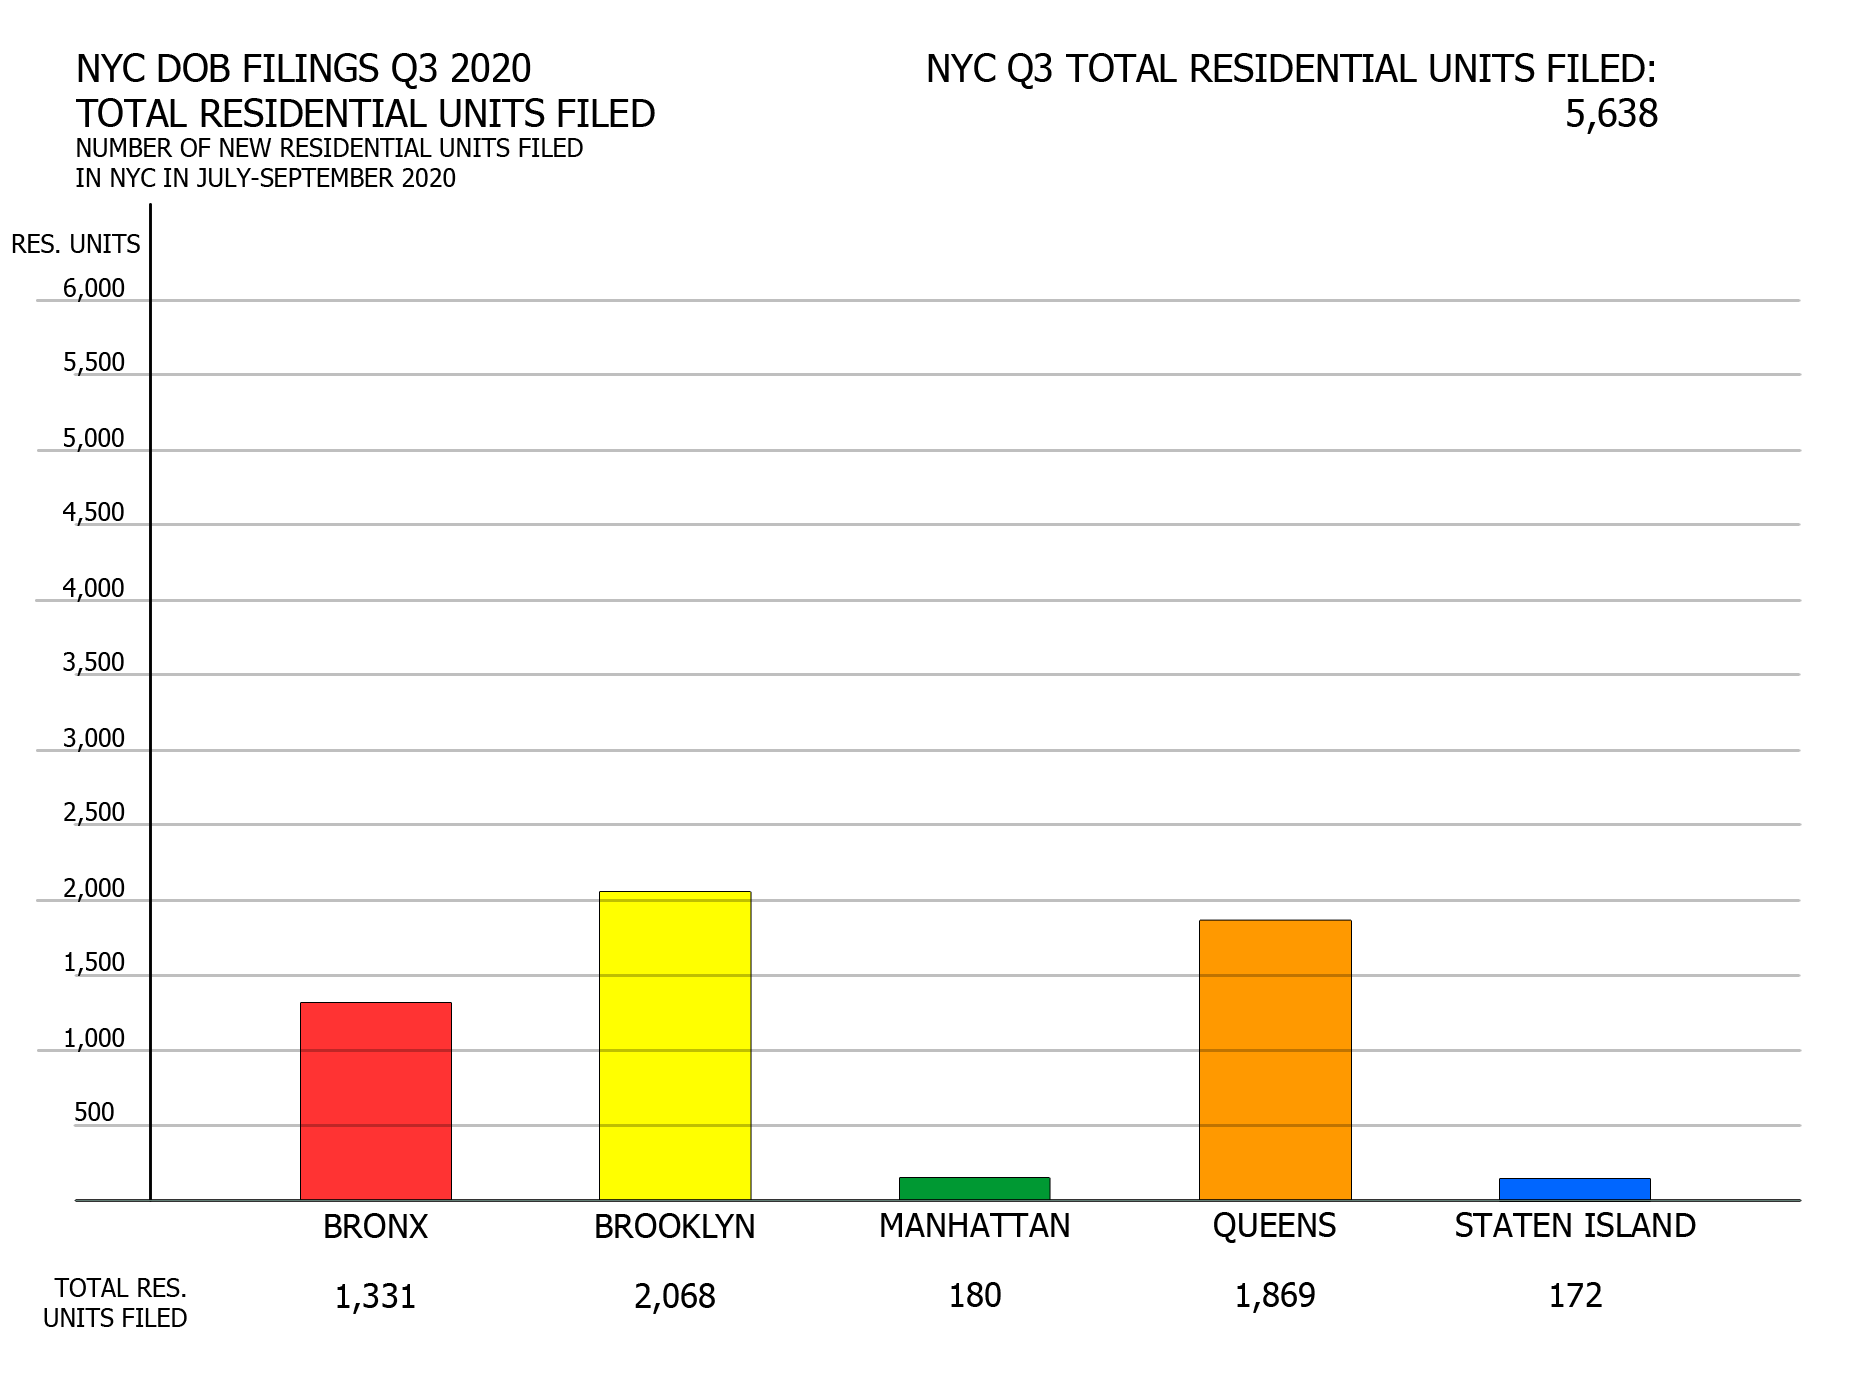
NYC DOB filings in Q3 2020 by total unit count per borough. Credit: Vitali Ogorodnikov
Brooklyn, the borough with by far the highest number of multi-family filings in Q3, leads the city with the most total units filed. Though Queens counts almost half as many multi-family proposals, it nearly makes up the gap with a much higher number of single/two-family structures on the drawing boards, with the Bronx trailing closely behind.
Manhattan’s four residential filings pale in comparison with Staten Island’s total of 82, yet the former’s large scale of planned developments still holds more units than the predominantly single- and two-family households in planning.
As expected in an uncertain market, many categories in the third quarter dipped in comparison to the second quarter. However, New York City has still posted remarkably robust numbers given the current economic climate. Furthermore, tens of millions of square feet are still planned across the boroughs, from single-family structures to megaprojects such as the Empire Station Complex, Anable Basin, and Innovation QNS, and many others that expect permits to be filed over the span of many months.
Given the resilience the city’s construction and real estate markets have shown even in the toughest of times, we expect much more development to surface across the five boroughs in the near future.
Subscribe to YIMBY’s daily e-mail
![]()
Follow YIMBYgram for real-time photo updates
Like YIMBY on Facebook
Follow YIMBY’s Twitter for the latest in YIMBYnews
Good read.
Manhattan is so dense and the cost to build is so high new development has all but stopped.
filings are not sales, there units up for sale. There is no count on how many have closed out on purchase by new owners.
And a great photo, Mr. Young