
Summer has come and gone, and as New Yorkers get ready to roll back their clocks, YIMBY rolls out our latest quarterly report that analyzes in detail the trends behind three months’ worth of construction permit filings. In the period from July through September of 2022, the Department of Buildings registered a total of 769 new construction filings throughout New York City, which promise to add 7,217 units to the city’s residential and hotel stock. The permit numbers maintain the robust filing volume we have observed so far throughout the year, as even the quarter’s least-active months continue to far outpace the figures from last year.
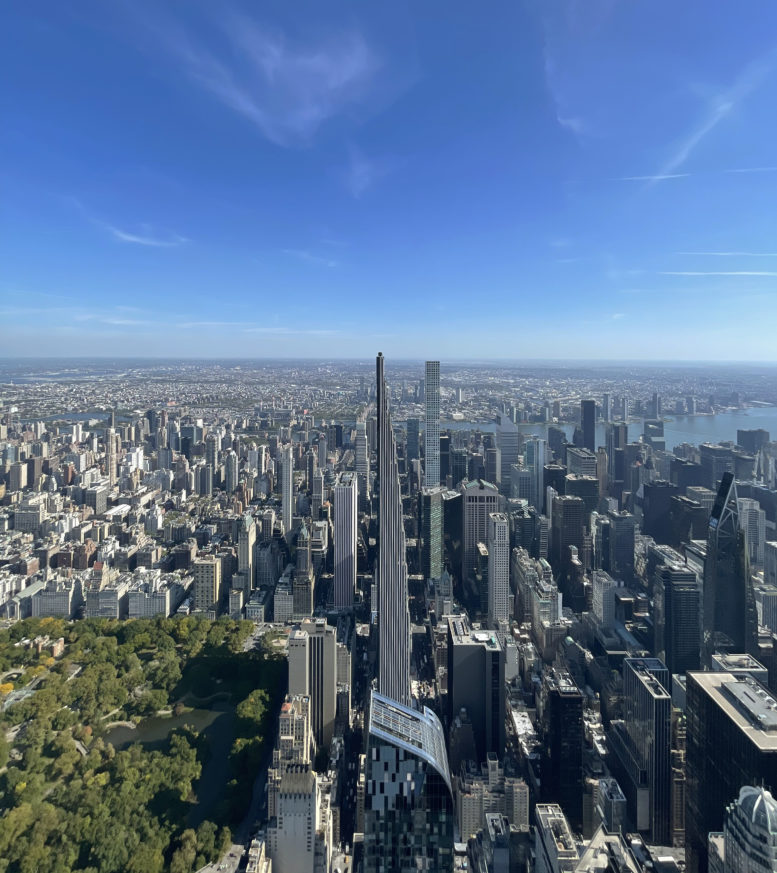
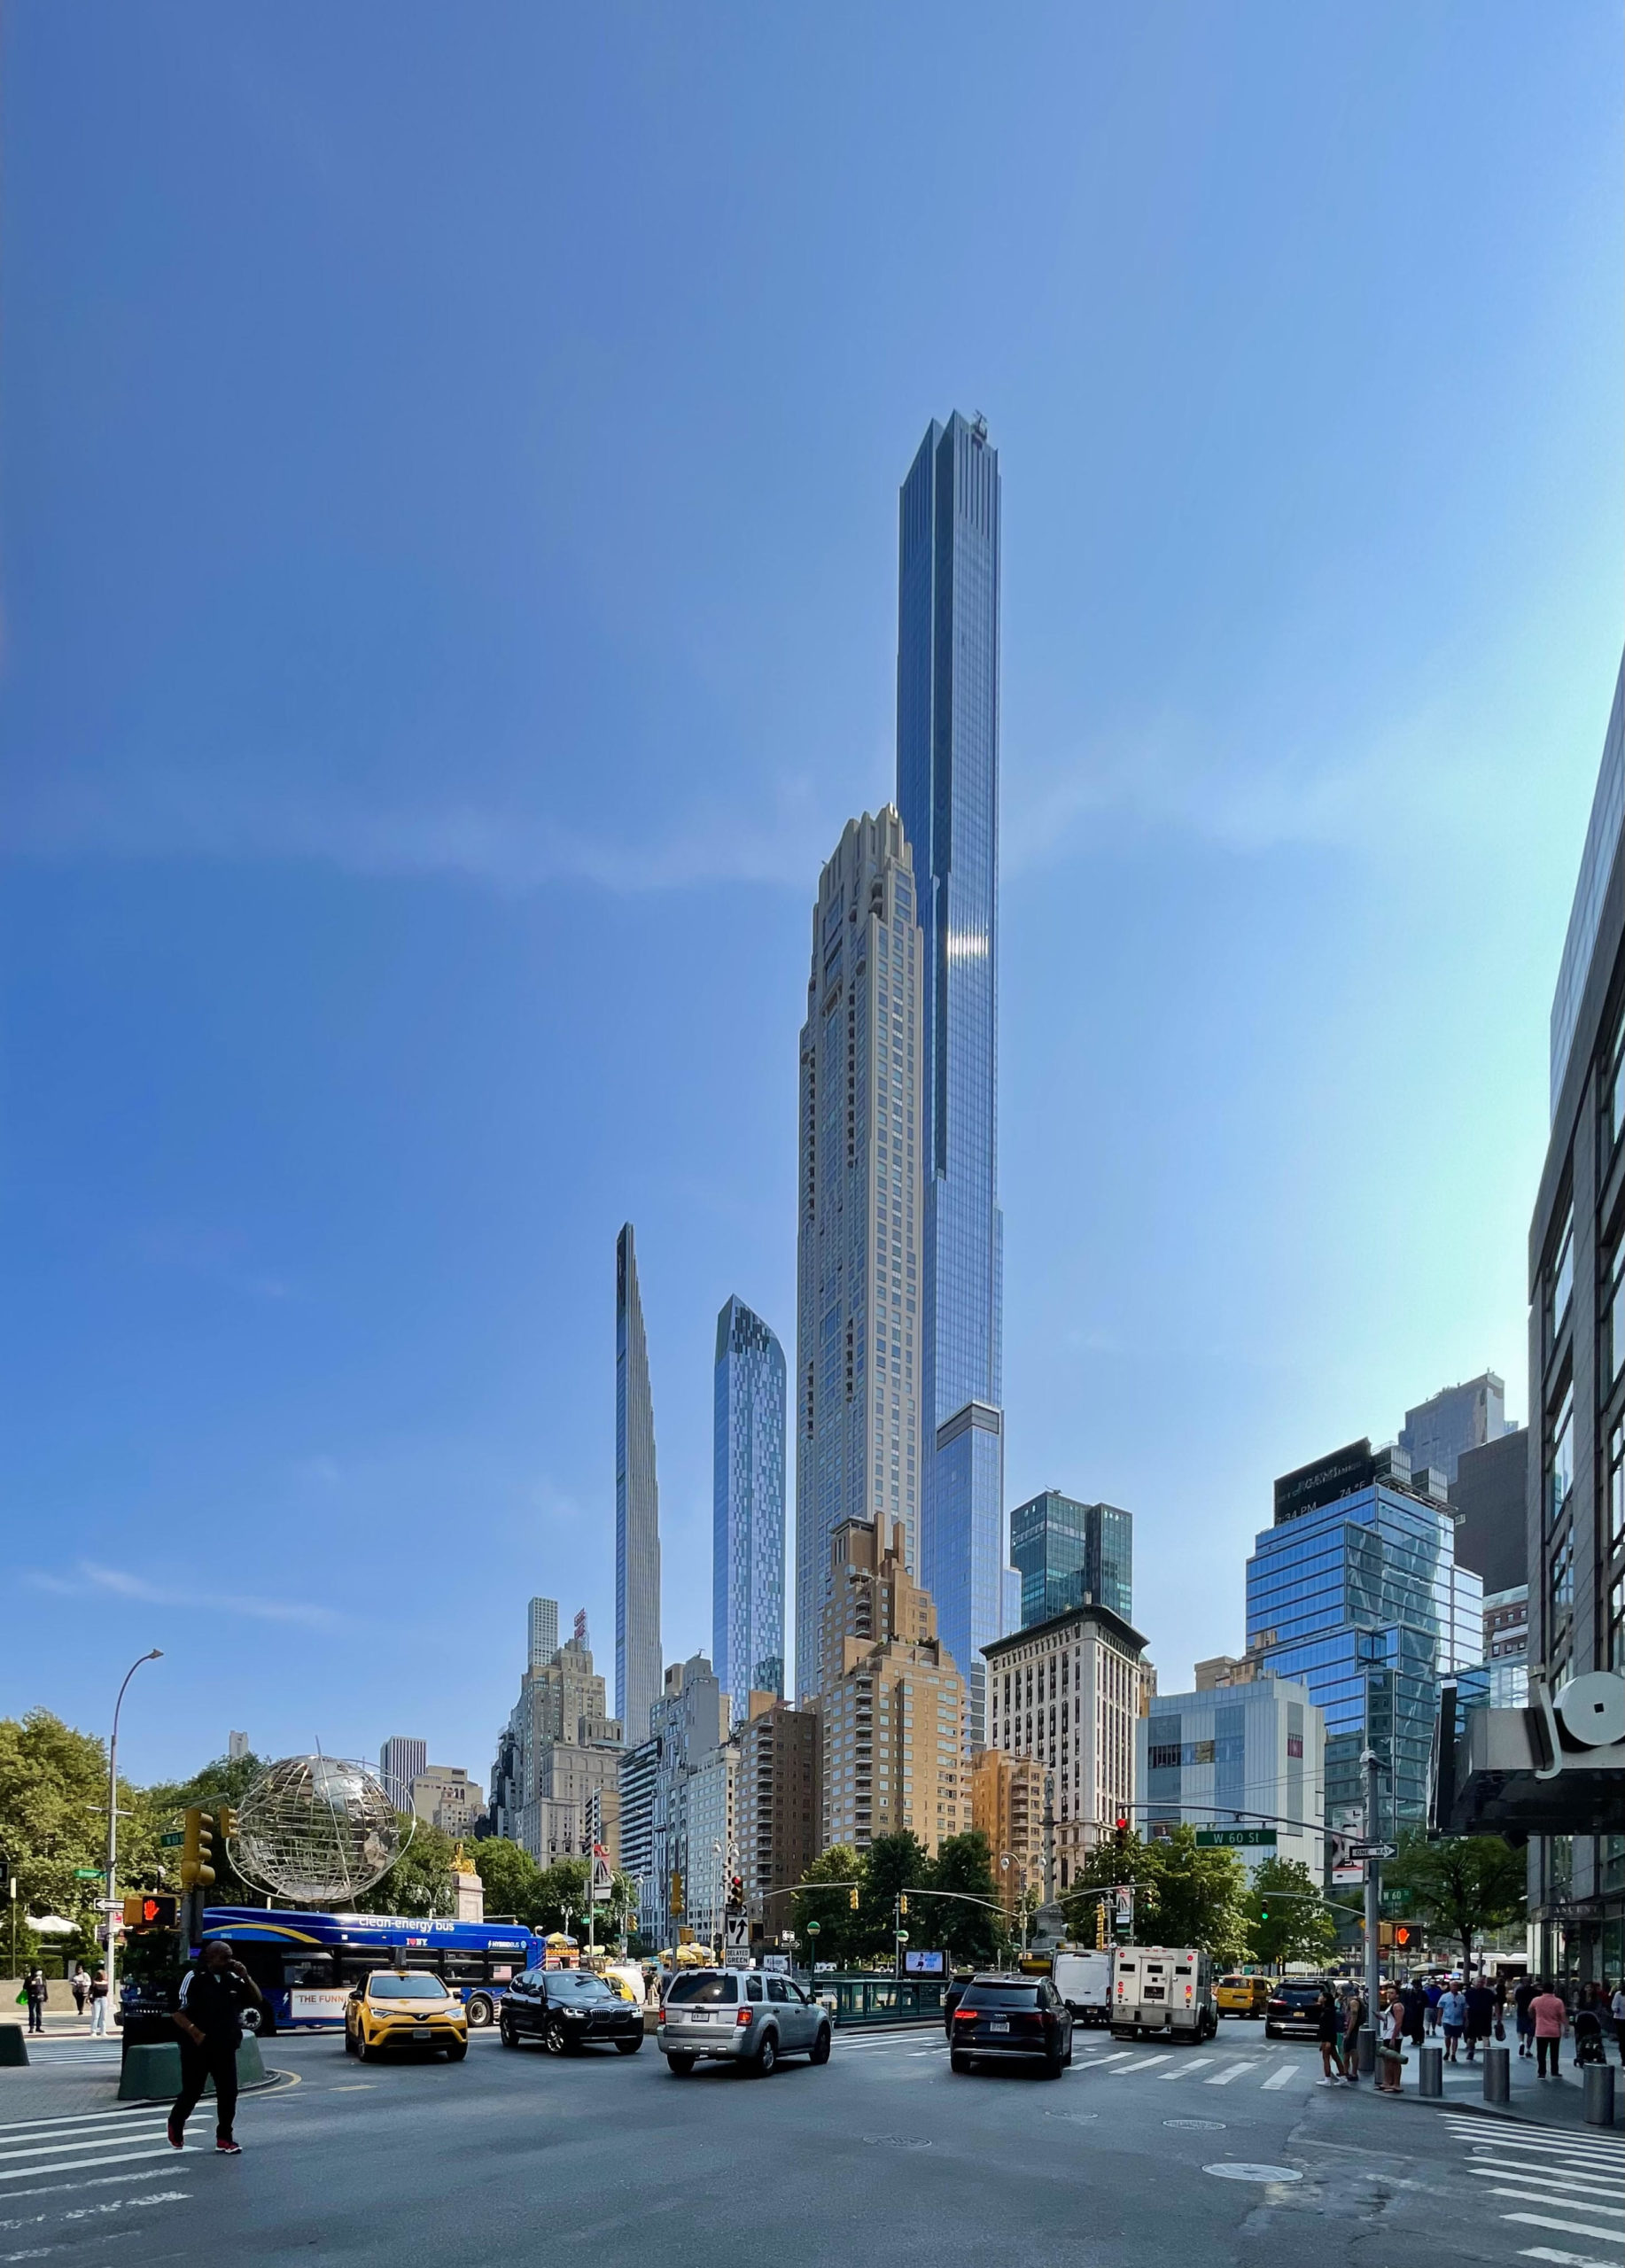
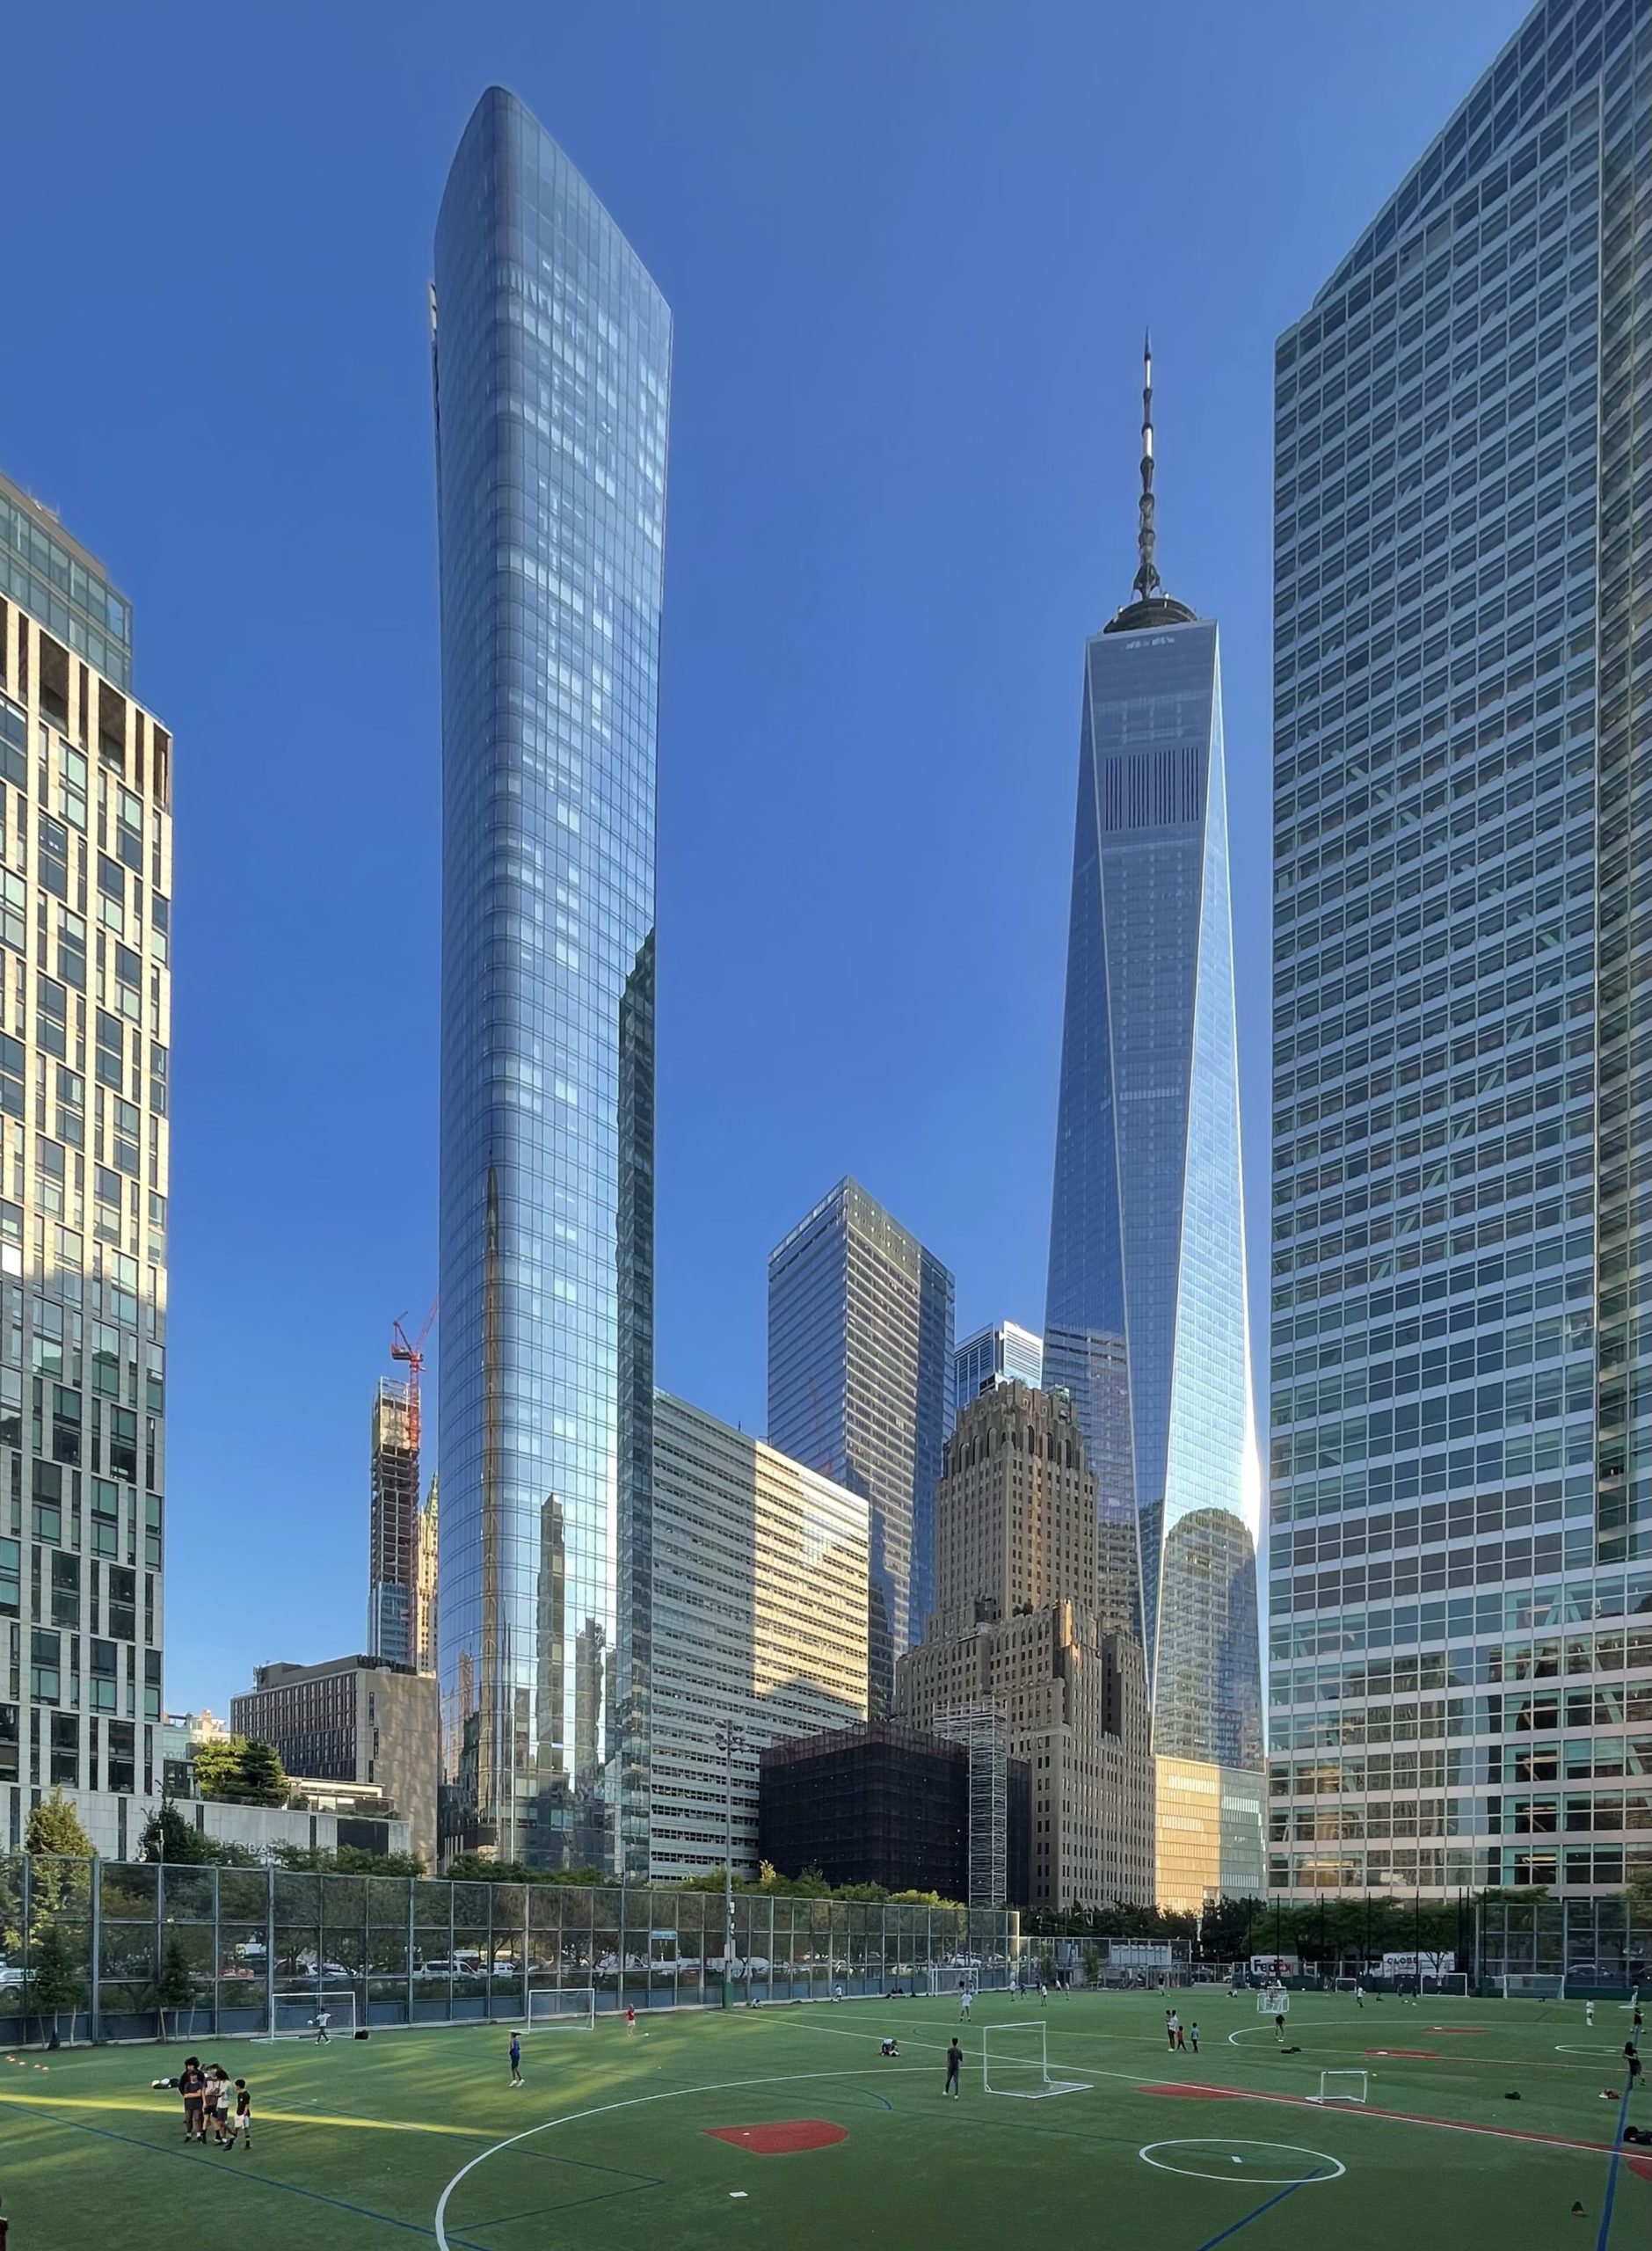
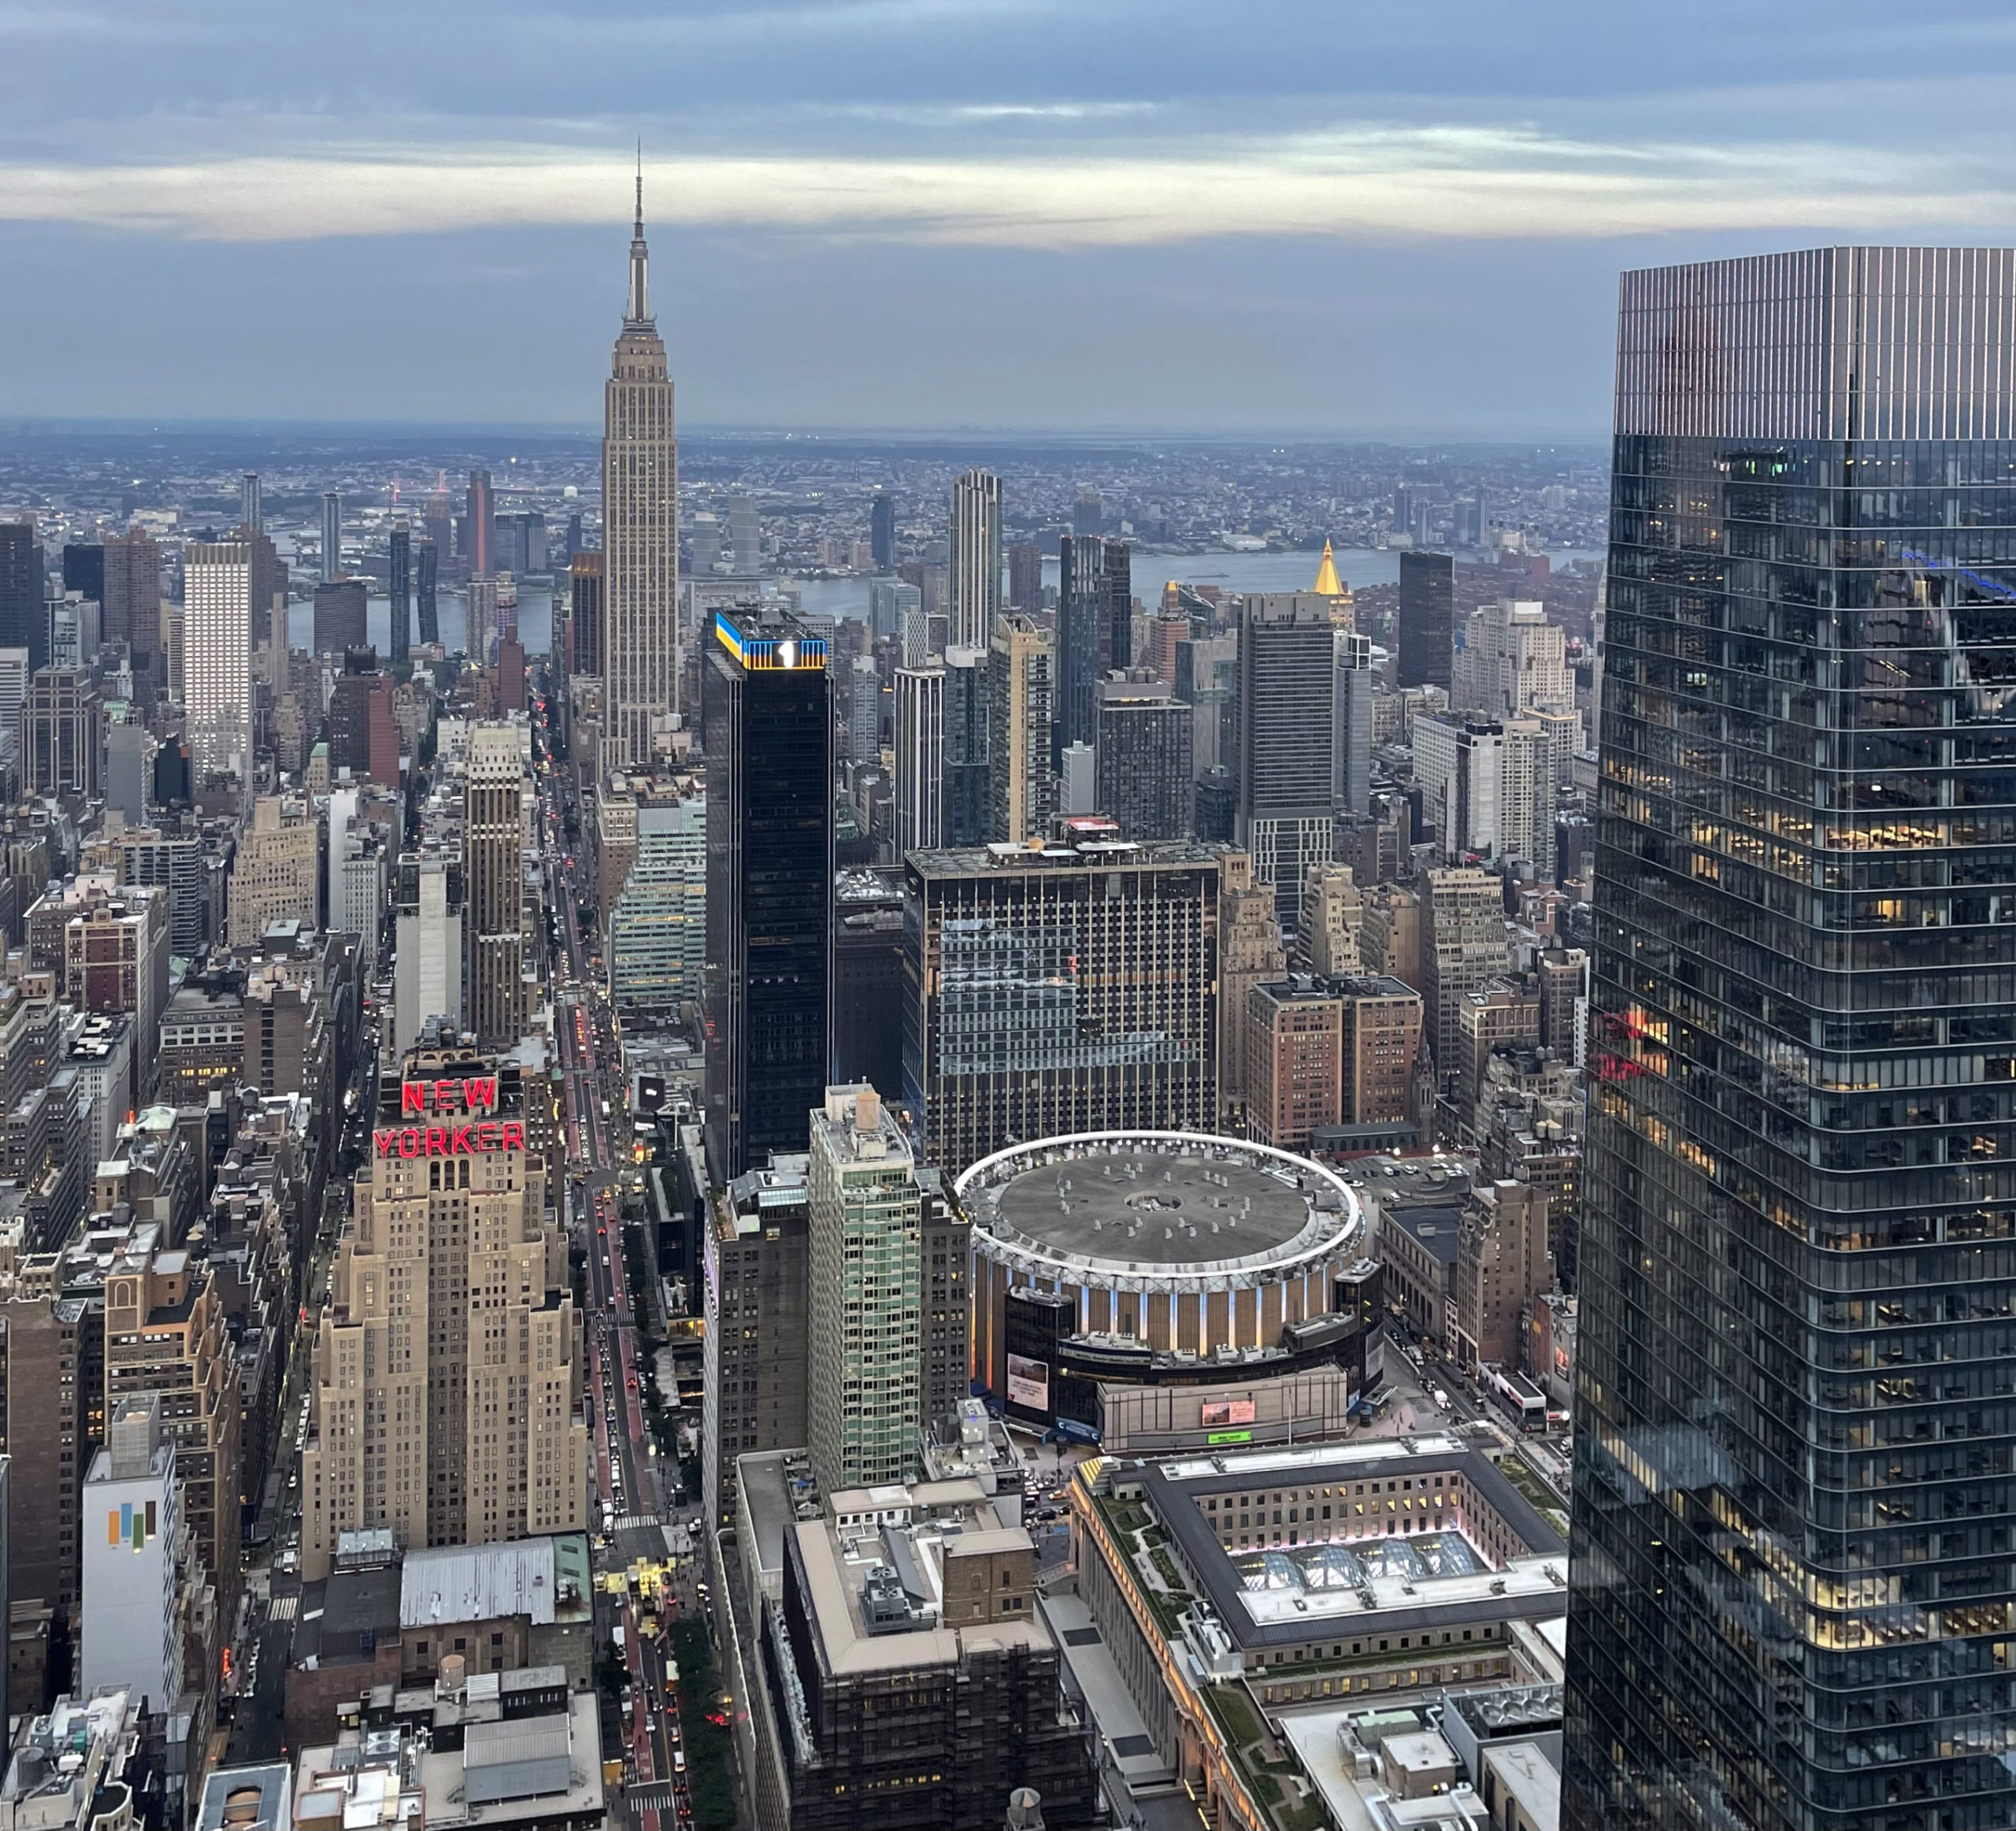
Midtown and Lower Manhattan from Central Park Tower. Photo by Michael Young
Number of permit filings per month
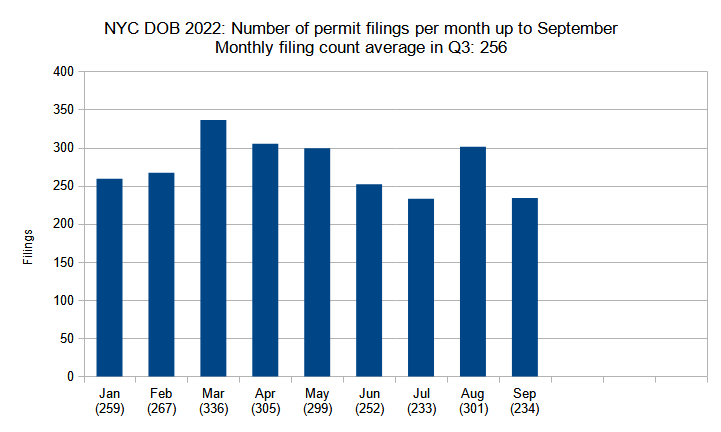
Number of new construction permits filed per month in New York City up to September 2022. Data source: the NYC Department of Buildings. Data aggregation and graphics credit: Vitali Ogorodnikov
The total volume of new construction permits filed per month during the third quarter in New York City maintained its sustained high volume when compared to last year’s figures, and despite a slight dip, remains generally consistent with the figures observed over the course of the year so far. The monthly average for Q3 sits at 256, slightly lower than Q1 and Q2’s monthly averages of 287 and 285, respectively.
With 233 and 234 filings, July and September registered the lowest averages noted in this year’s tally so far. On the other hand, with 301 filings, the average for August is the third-highest for the year so far, trailing only slightly behind March, with 336 filings, and April, with 305 filings.
Despite the dip, however, the numbers indicate that construction permit activity remains robust. Even the lowest year-to-date average (July, with 233 filings) measures 39 percent higher than last year’s monthly filing average of 168, and registers notably higher than even last year’s best-performing month (December, with 219 filings).

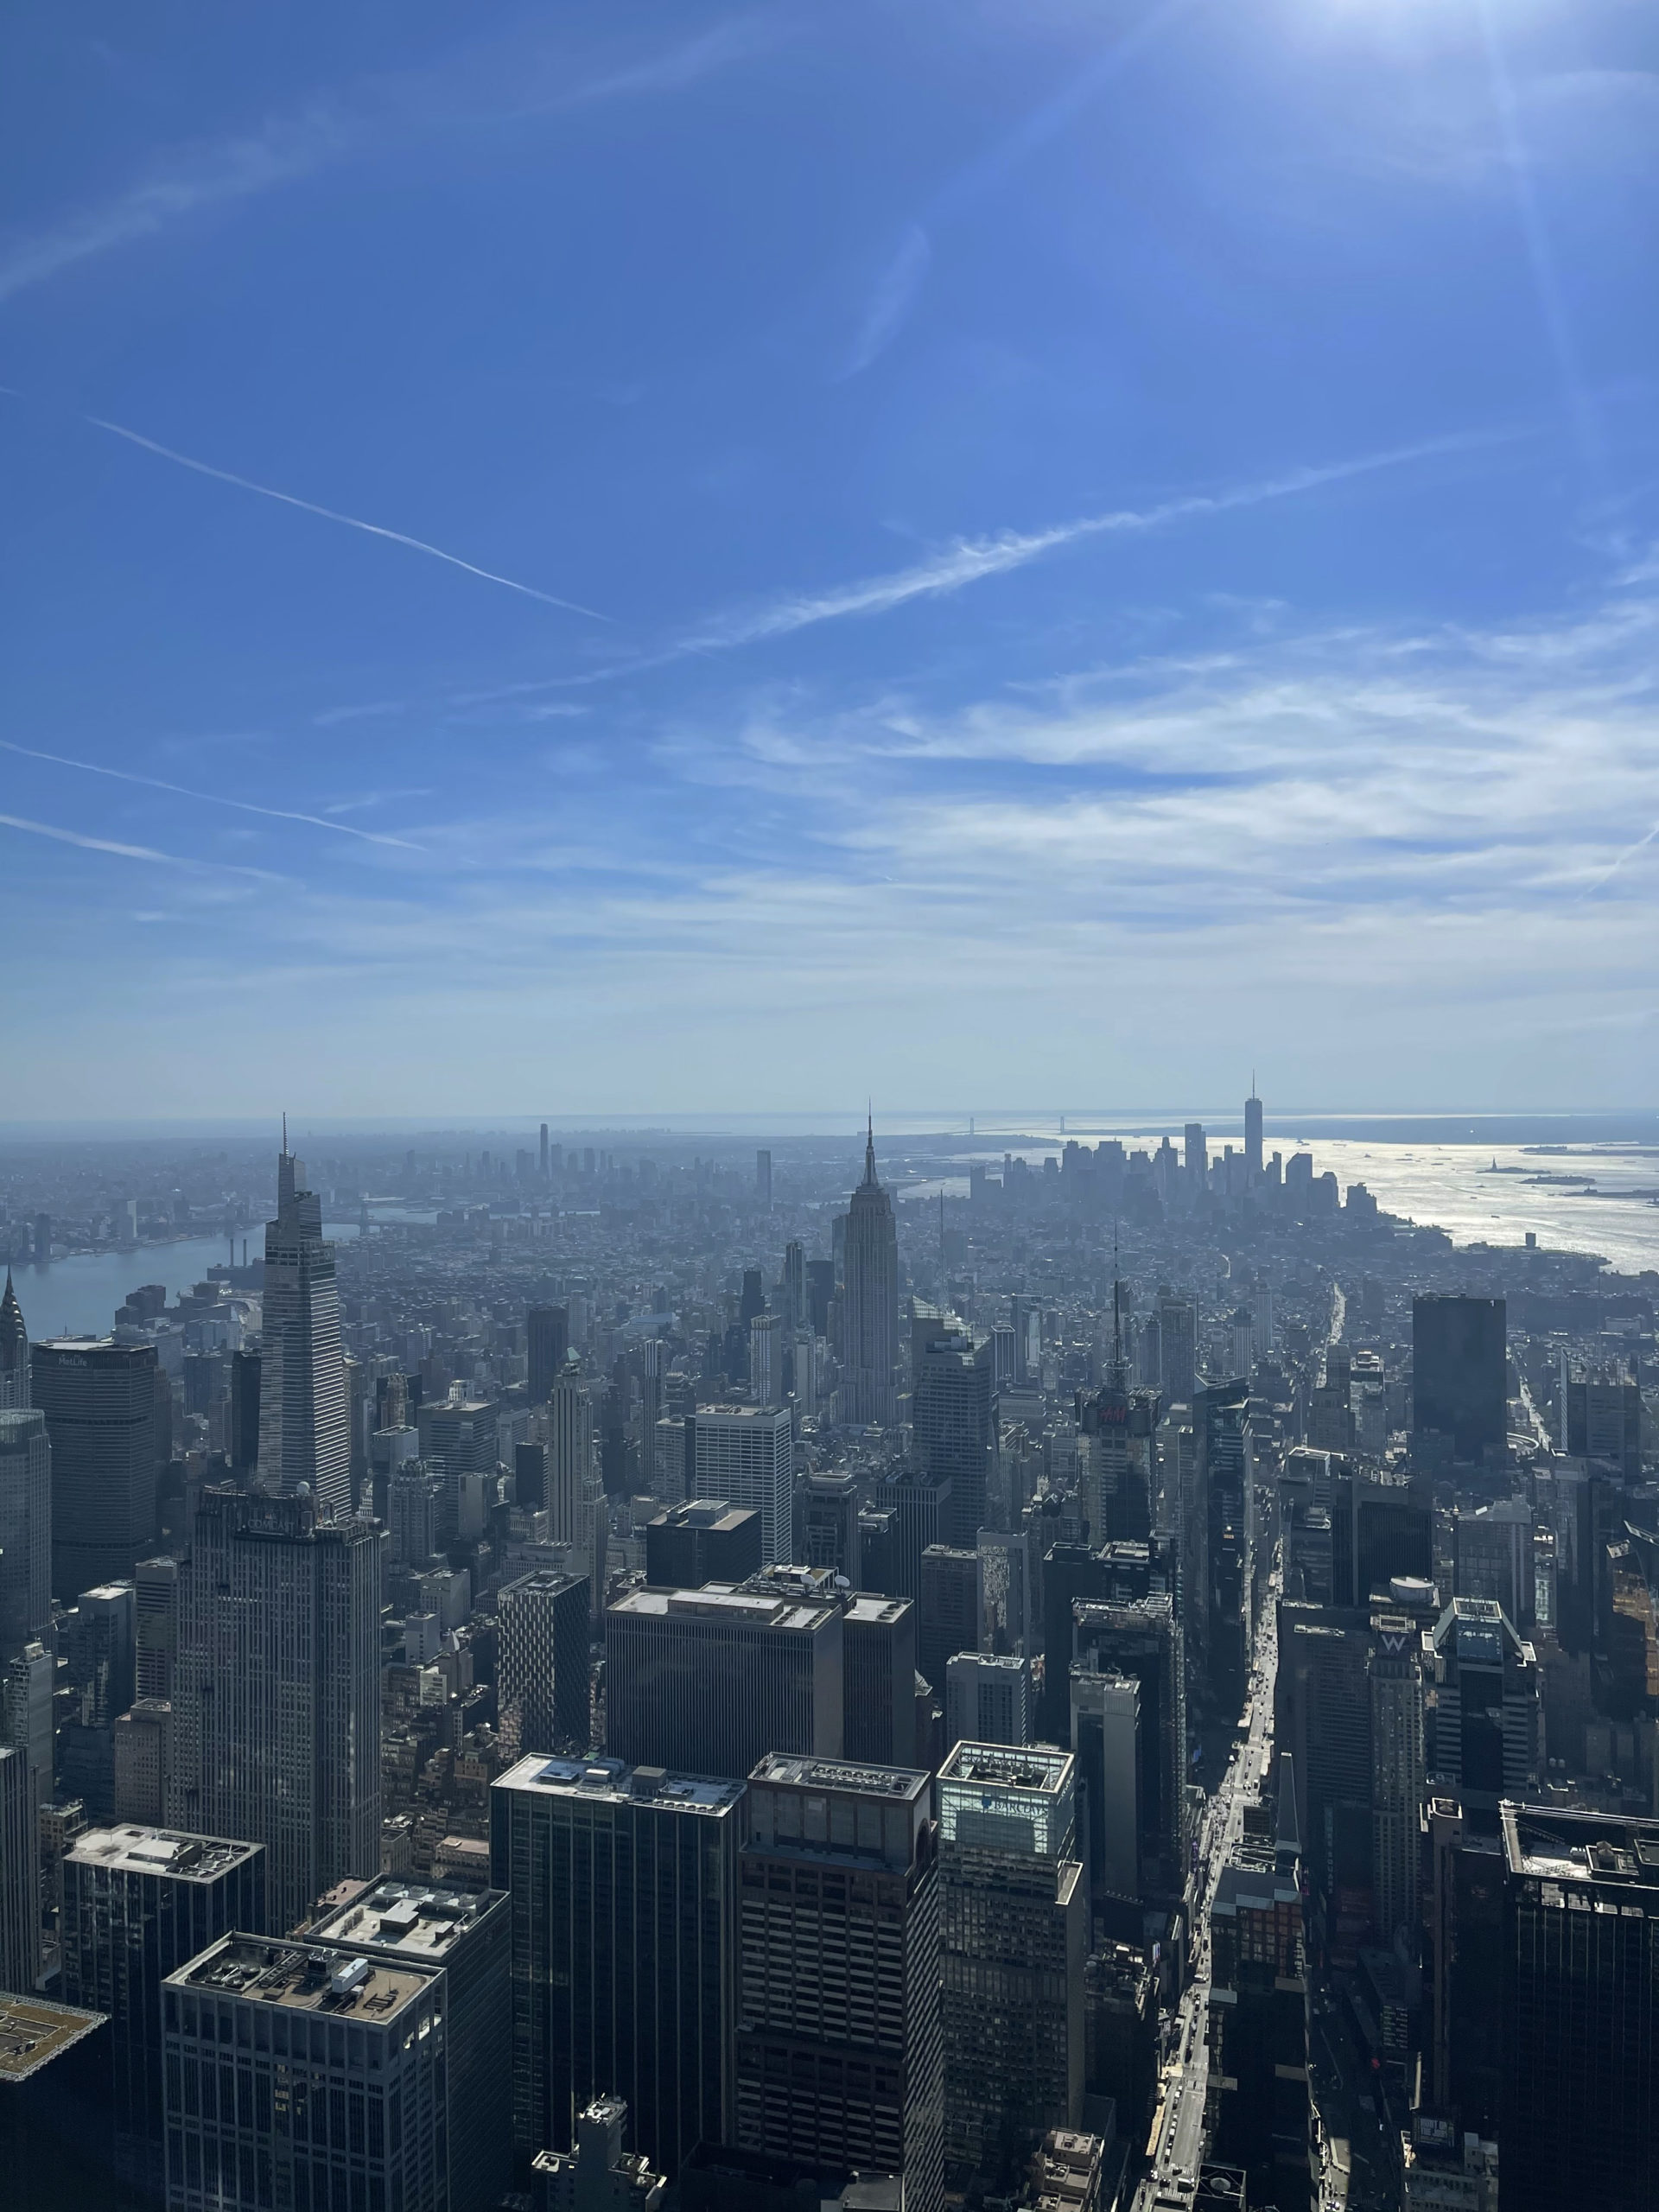
Photo by Michael Young
Number of permit filings by borough
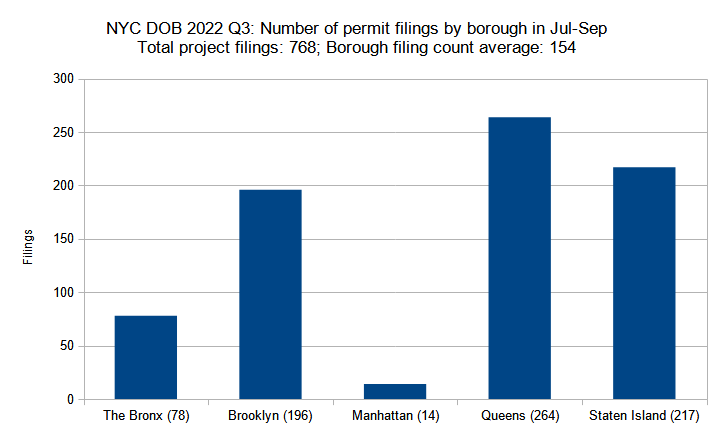
Number of new construction permits filed per borough in New York City in the third quarter (July through September) of 2022. Data source: the NYC Department of Buildings. Data aggregation and graphics credit: Vitali Ogorodnikov
The third quarter saw an average of 154 filings per borough, although the totals vary widely. Manhattan, where the construction industry prioritizes scale rather than quantity, counted by far the fewest filings of any borough, although its drop from the second quarter’s 32 filings down to just 14 in the third quarter is still rather surprising.
The rest of the chart also generally looks much like that from last quarter, with a few exceptions. The entries at the first, third, and fourth place have all dipped slightly: Queens, the leader, slipped from Q2’s total of 309 down to 264 in Q3 and Brooklyn and The Bronx have both lowered their tallies from 238 to 196 and from 117 to 78, respectively.
The quarter’s only comparative gain has been observed in Staten Island, which upped its total from 161 filings in Q2 to 217 filings in Q3, surpassing Brooklyn to take second place among the boroughs. However, much of the new filing activity in Staten Island, and to a lesser extent in Queens and Brooklyn, consists of minor structures such as single- and two-family homes and garages, rather than office or multi-family apartment buildings.
Central Park Tower. Photo by Michael Young
Residential and hotel units filed per borough
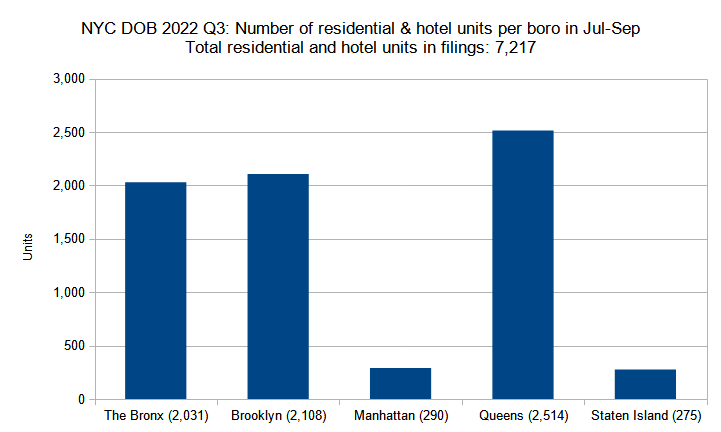
Number of residential and hotel units in new construction permits filed per borough in New York City in the third quarter (July through September) of 2022. Data source: the NYC Department of Buildings. Data aggregation and graphics credit: Vitali Ogorodnikov
The third quarter saw fewer new unit filings than the second quarter, with the total lowering from 9,997 residential and hotel unit filings in Q2 down to 7,217 units in Q3. The Bronx and Brooklyn each saw around 1,000 fewer new units filed, lowering from 3,115 and 3,162 units in Q2, respectively, down to 2,031 and 2,108 units in Q3.
Manhattan and Staten Island have also seen notable drops, lowering from 1,016 and 401 units in Q2, respectively, down to 290 and 275 units in Q3.
By contrast, Queens increased its unit count from Q2’s total of 2,303 up to 2,514 units in Q3, taking the lead position and accounting for more than one-third of the quarter’s total unit count.
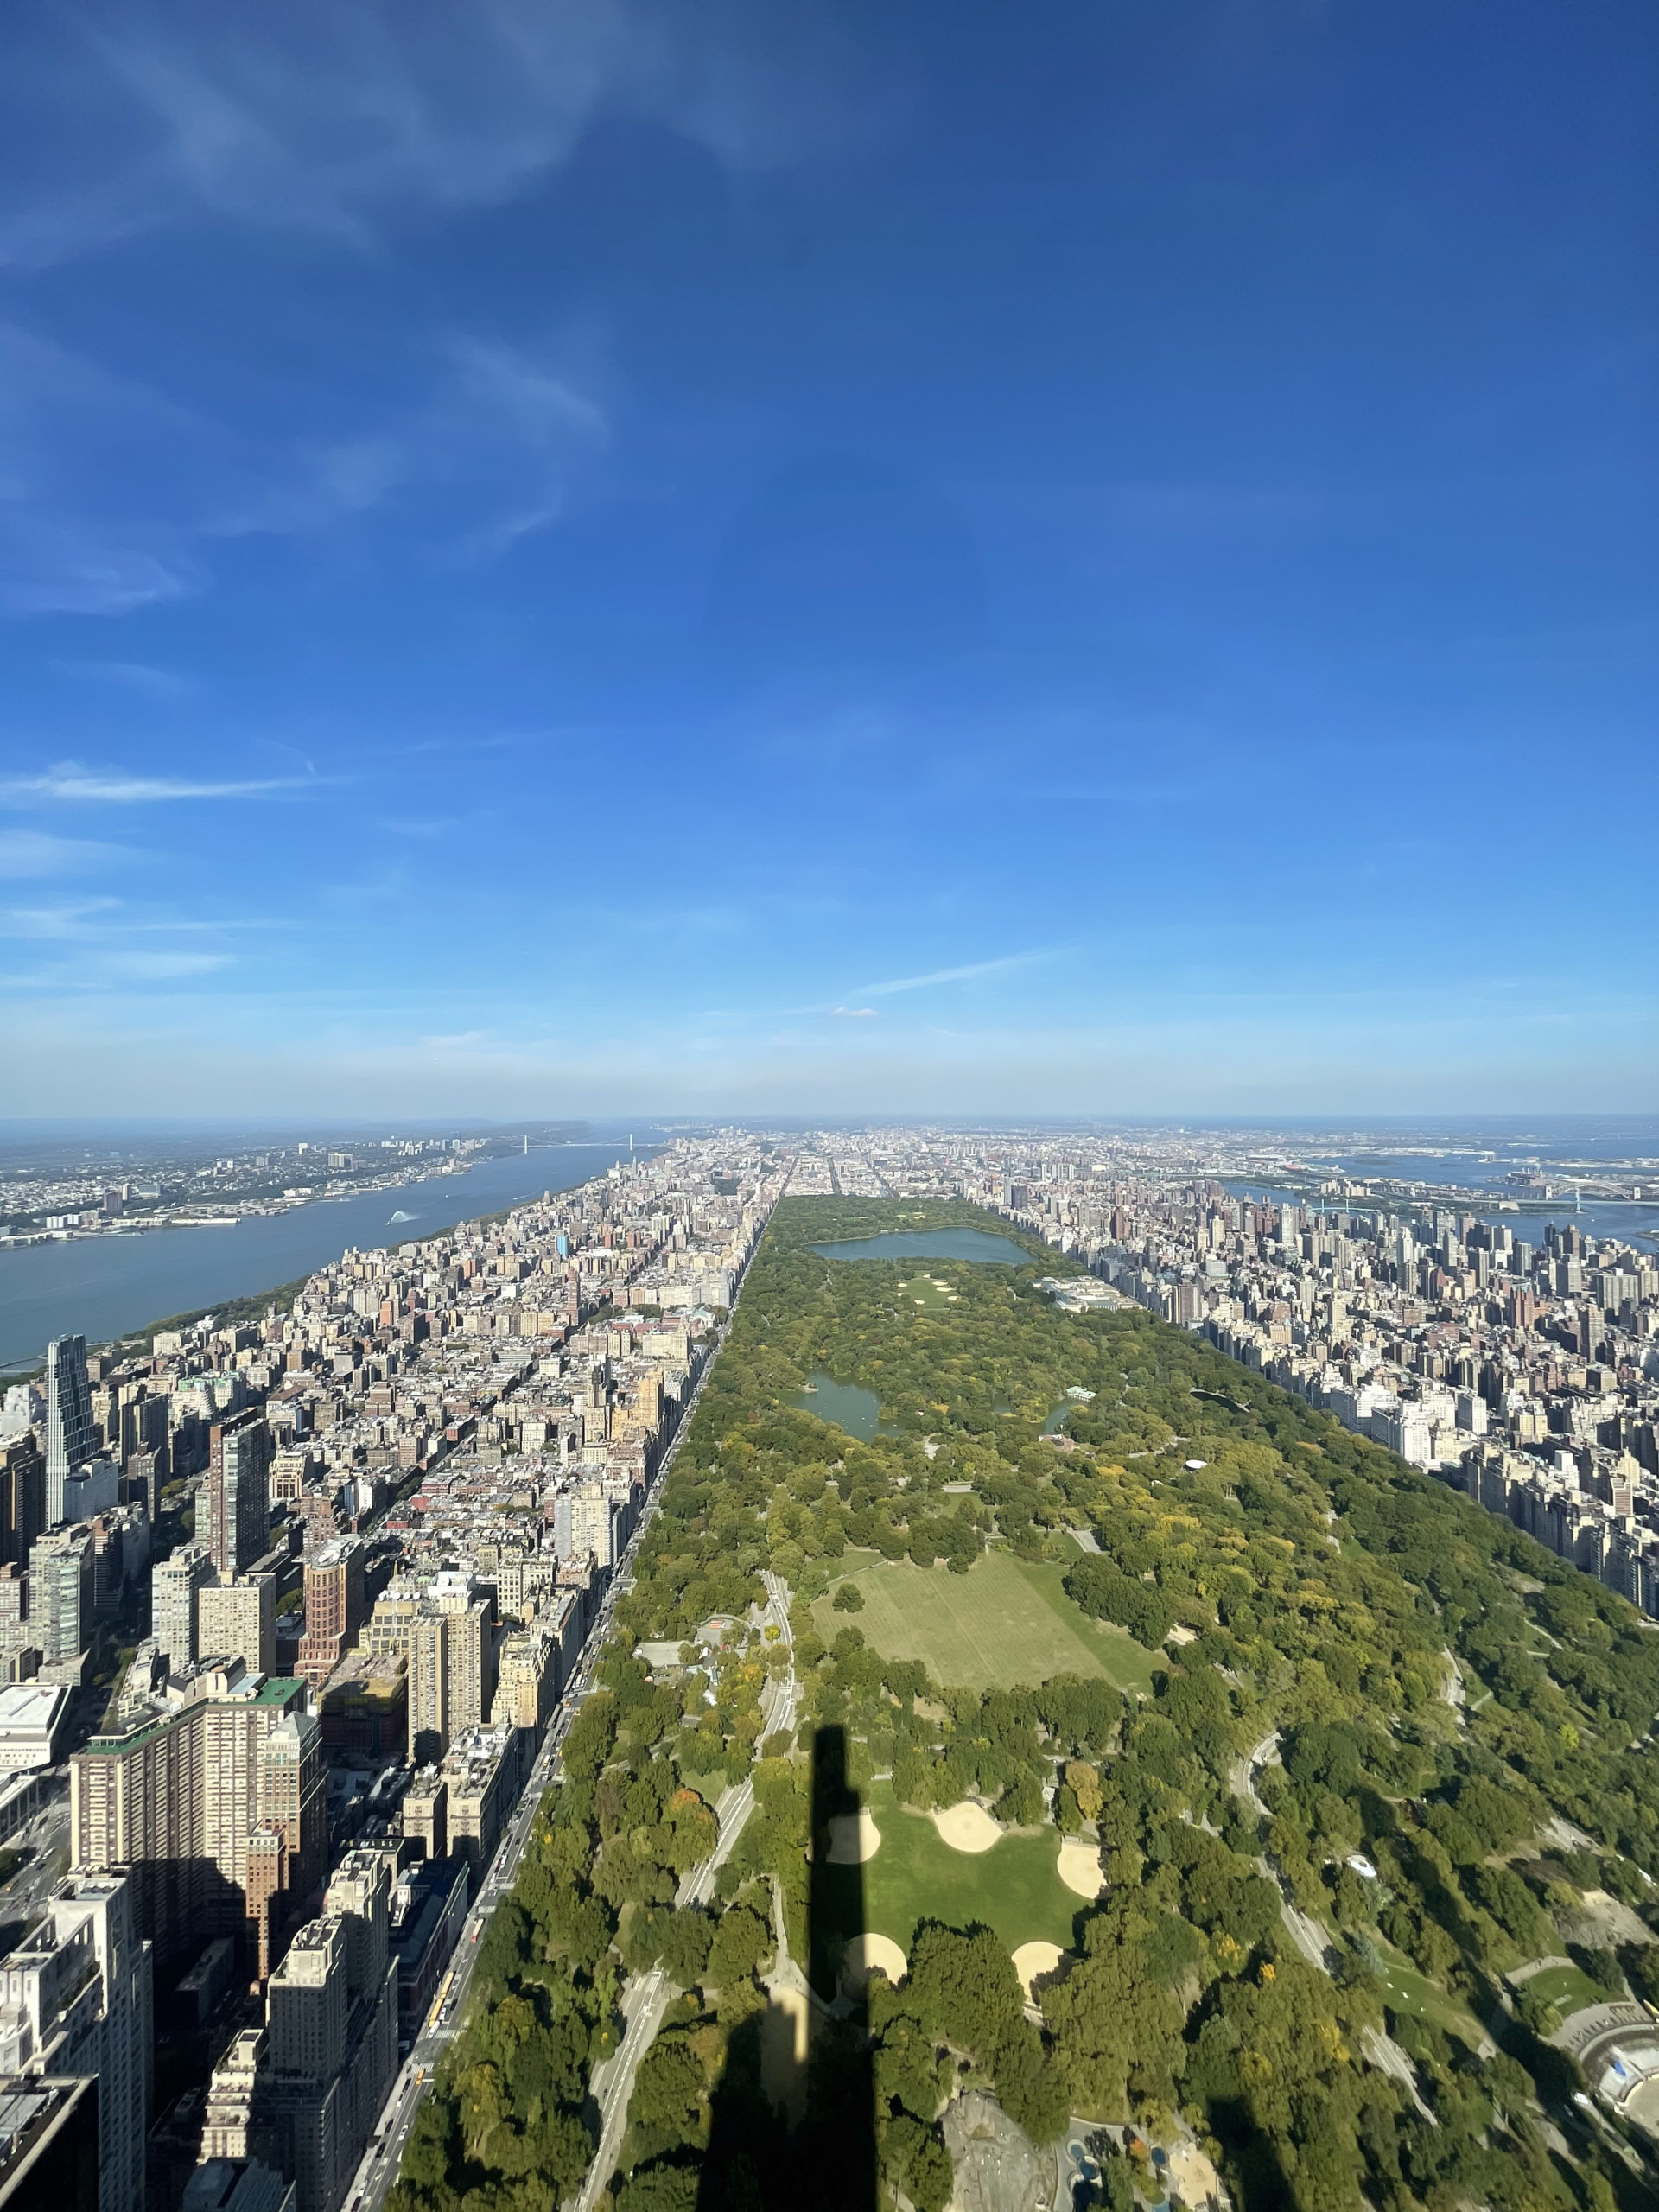
Central Park from Central Park Tower. Photo by Michael Young
Permits listed by unit count per filing
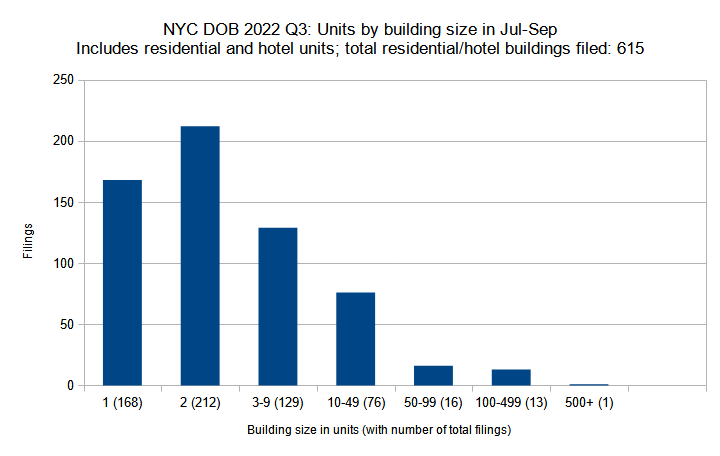
New residential and hotel construction permits filed in New York City in the third quarter (July through September) of 2022 grouped by unit count per filling. Data source: the NYC Department of Buildings. Data aggregation and graphics credit: Vitali Ogorodnikov
When tallying the third quarter’s permit filings by number of residential units per proposed building, we have observed slight increases in number of filings in the lowest and highest density categories, and decreases in the groups between. The third quarter saw a slight uptick in single-family filings (up from 164 to 168), a much larger gain for two-family filings (up from 172 to 212), and a rise from one to two filings in the 500-unit-plus category. The filing category with buildings holding from 100 to 499 units saw a negligible single-digit drop from 14 in Q2 down to 13 in Q3.
In turn, the filing count in the three categories in between, representing buildings ranging from three to 99 units, saw more considerable drops from the second quarter, from 322 in Q2 to 221 in Q3.
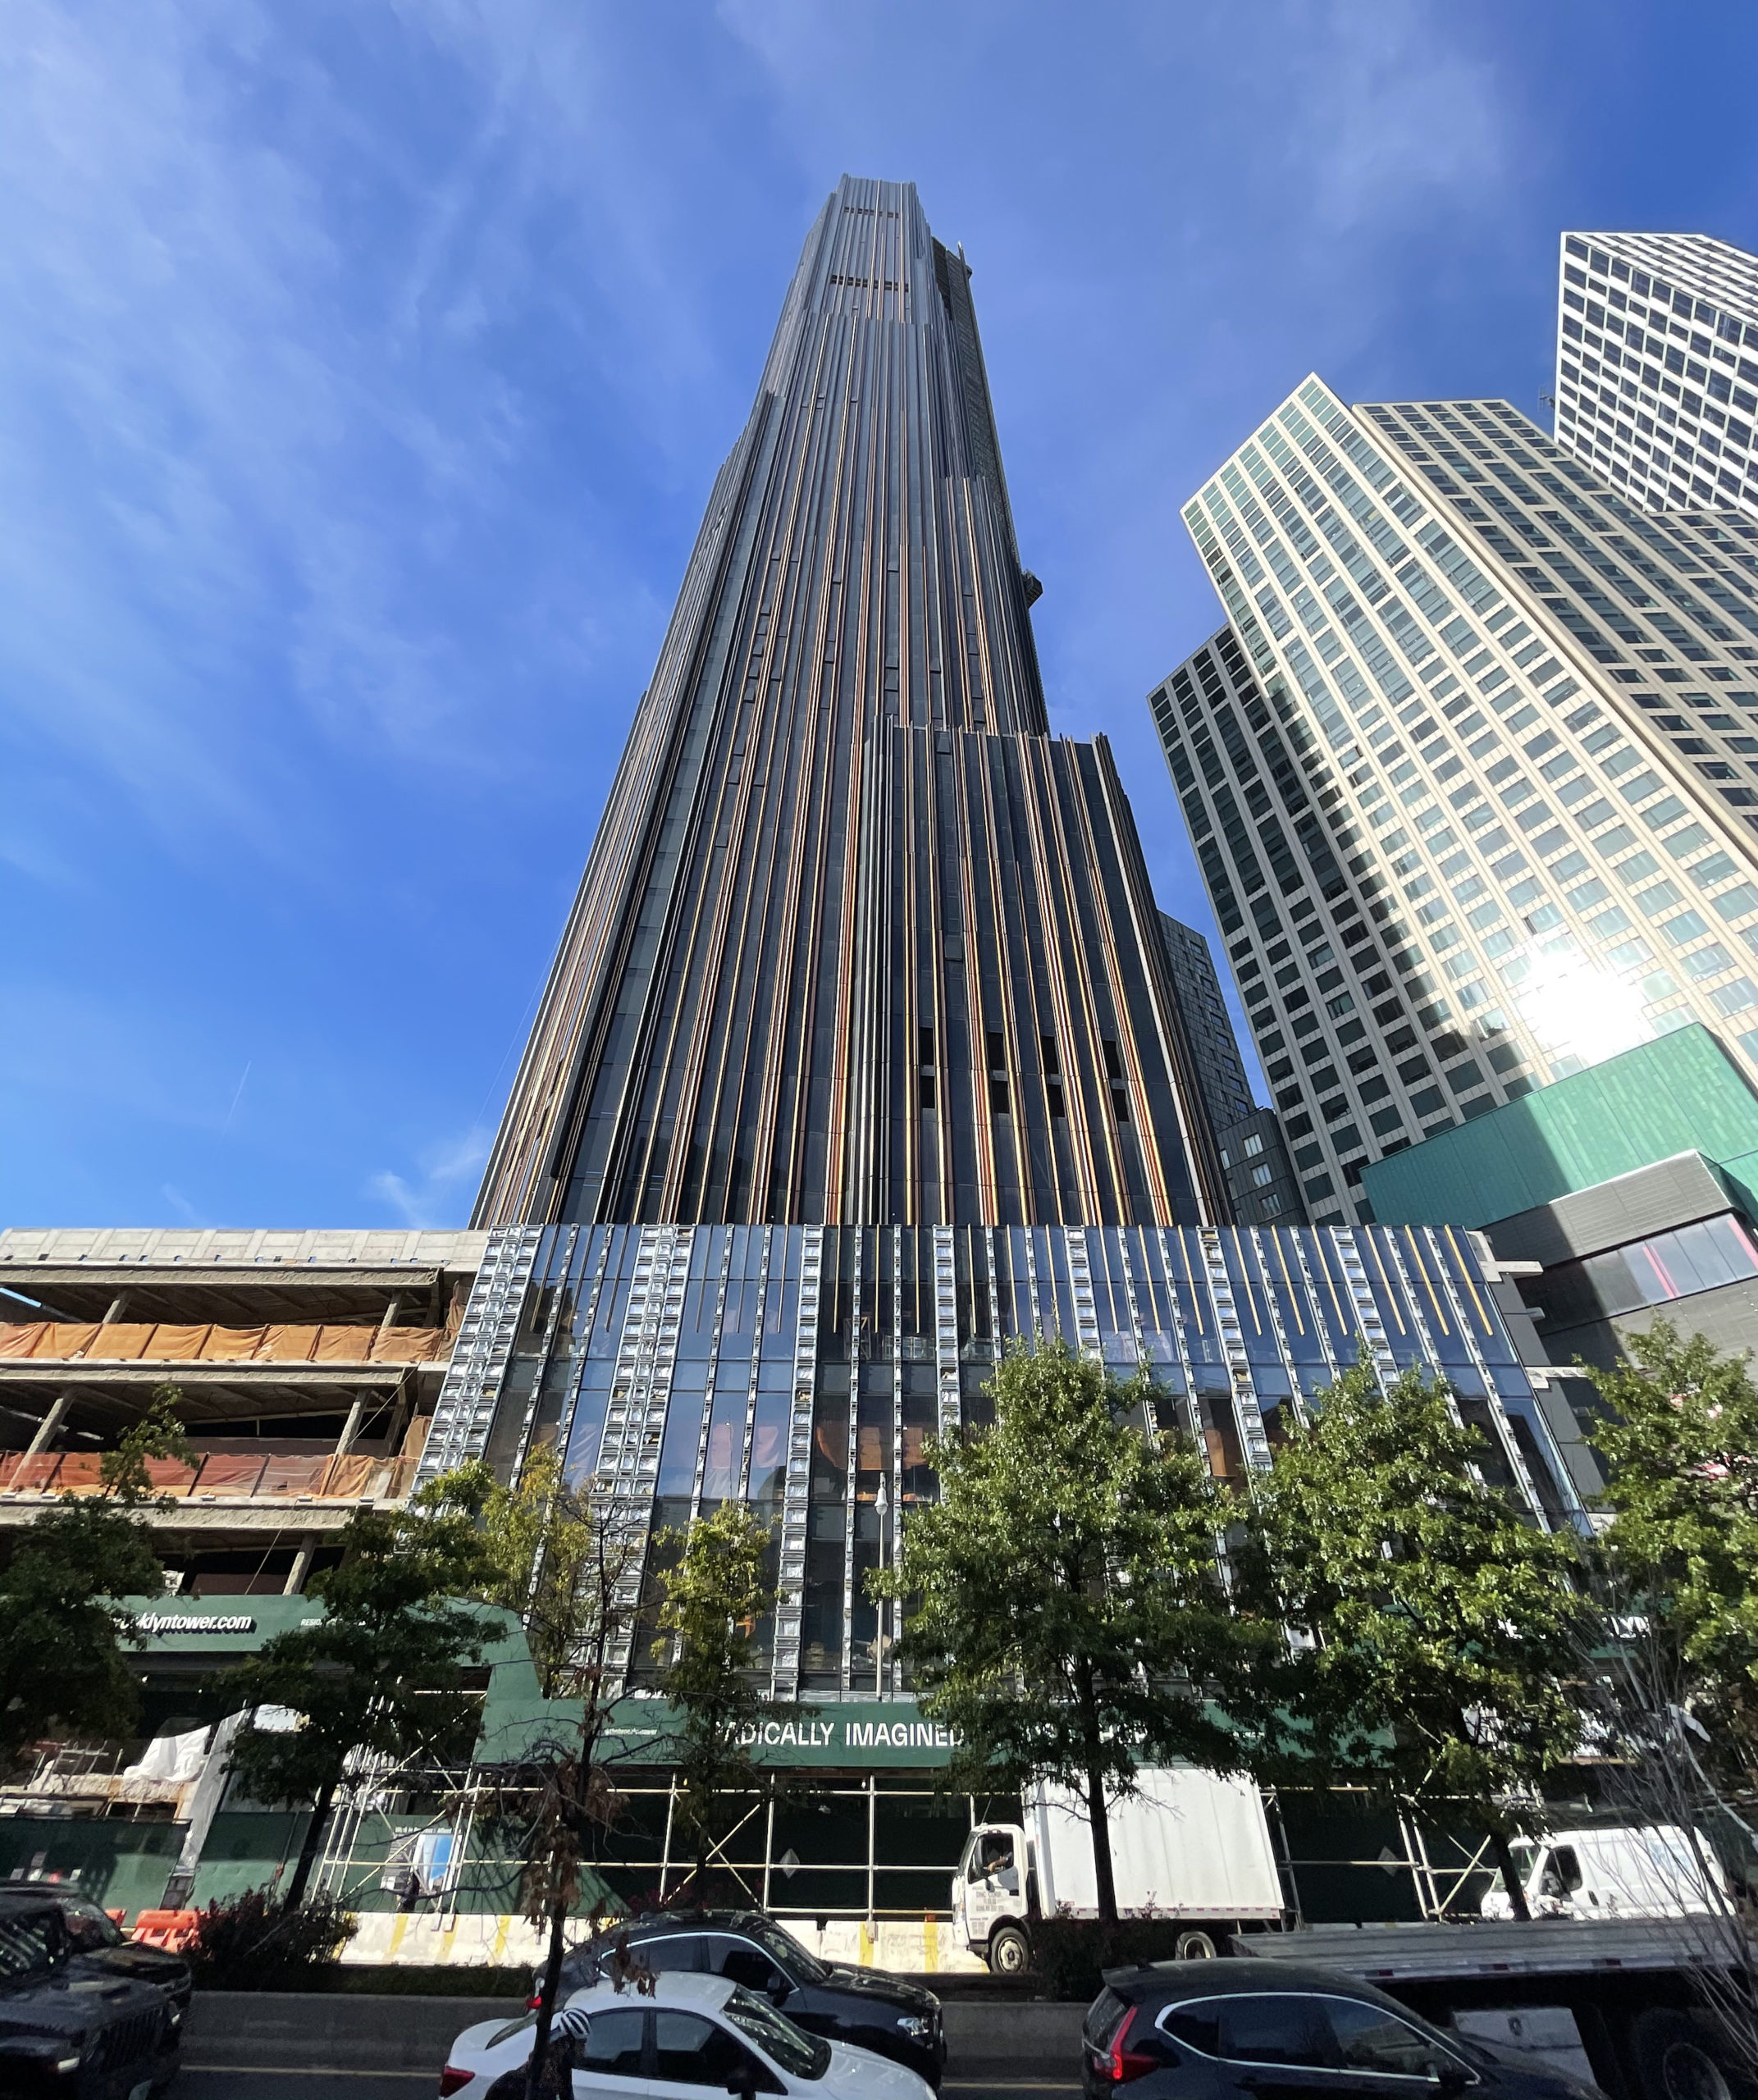
The Brooklyn Tower. Photo by Michael Young
Average unit count per residential and hotel filing by borough
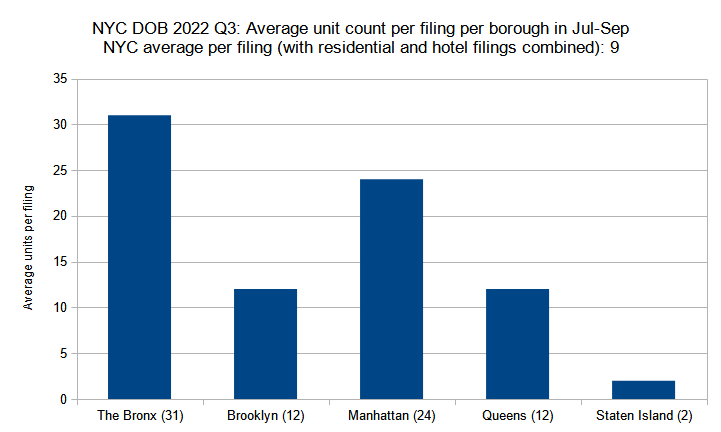
Average unit count (residential and hotel) per new construction permit per borough filed in New York City in the third quarter (July through September) of 2022. Data source: the NYC Department of Buildings. Data aggregation and graphics credit: Vitali Ogorodnikov
As one of the world’s preeminent skyscraper districts, we would naturally expect Manhattan to have the city’s highest unit count per average filing. Curiously, in the third quarter that distinction instead went to the Bronx, which tallied 31 units per average residential or hotel filing, with Manhattan sitting at second place with 24 units per average filing.
Brooklyn and Queens each tallied 12 units per average residential or hotel filing, slightly above the citywide average of nine. As expected, Staten Island drags the average down with its almost exclusively single- and two-family permits filed in the third quarter.

The Brooklyn Tower. Photo by Michael Young
Permit filings by floor count category
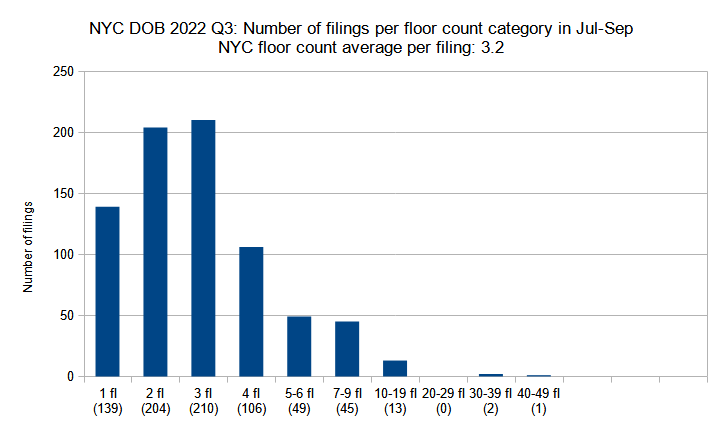
New construction permits filed in New York City in the third quarter (July through September) of 2022 grouped by floor count. Data source: the NYC Department of Buildings. Data aggregation and graphics credit: Vitali Ogorodnikov
In the third quarter, permits for single-story structures dropped somewhat from 161 filings in Q2 down to 139 filings in Q3. The two-story group rose slightly from 201 filings in Q2 to 204 filings in Q3. The greatest gain was observed among three-story filings, which surged from 176 filings in Q2 up to 210 filings in Q3, becoming the leading category for the quarter.
Most of the rest of the groups saw notable decreases, with some groups dropping by nearly half of the filing count. The 20-29-story category, which listed three buildings in the second quarter, recorded zero entries this time around.
Curiously, slight increases are seen in the tallest categories: the 30-39-story group rose from one entry in Q2 to two in Q3, and while no filing had exceeded 39 stories in Q2, one such filing was registered in Q3, adding the 40-49-story category back into the chart.
In the third quarter, the following filings make up the top ten buildings with the most floors: 343 Madison Avenue, Manhattan (49 stories); 255 East 77th Street, Manhattan (36 stories); 61-06 Junction Boulevard, Queens (30 stories); 133-09 37th Avenue, Queens (17 stories); 362 Livingston Street, Brooklyn (15 stories); 2797 Atlantic Avenue, Brooklyn (14 stories); 1940 Jerome Avenue, the Bronx (13 stories); 142 West 21st Street, Manhattan (13 stories); 58-01 Queens Boulevard, Queens (12 stories); and 501 Ninth Avenue, Manhattan (12 stories).
125 Barclay Street (bottom center). Photo by Michael Young
Average number of floors per filing per borough
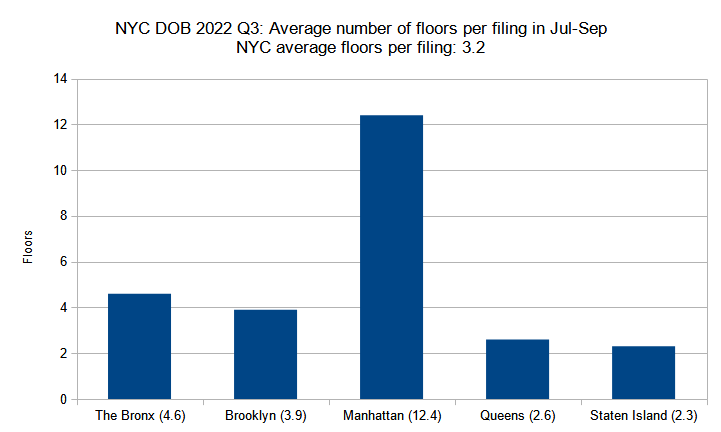
Average number of floors per new construction permit per borough filed in New York City in the third quarter (July through September) of 2022. Data source: the NYC Department of Buildings. Data aggregation and graphics credit: Vitali Ogorodnikov
Though we have expressed surprise at an earlier analysis that showed that the Bronx, rather than Manhattan, tallied the most units per average residential or hotel filing in NYC in the third quarter, Manhattan is still on top in terms of an average floor count per filing. The borough’s average of 12.4 floors per filing in Q3 makes for a roughly 50 percent increase over its Q2 average of 8.6 stories per filing.
The rest of the boroughs have also retained their previous positions in the tally, as well as nearly matching floor averages. The Bronx dipped very slightly from a 4.9-floor average in Q2 down to 4.6 floors in Q3. Brooklyn dipped from 4.4 floors in Q2 down to 3.9 floors in Q3, making for the greatest drop between the two quarters of any borough. Queens retained its Q2 average of 2.6 floors per filing. Staten Island slightly boosted its average from 2.2 up to 2.3 floors per filing.
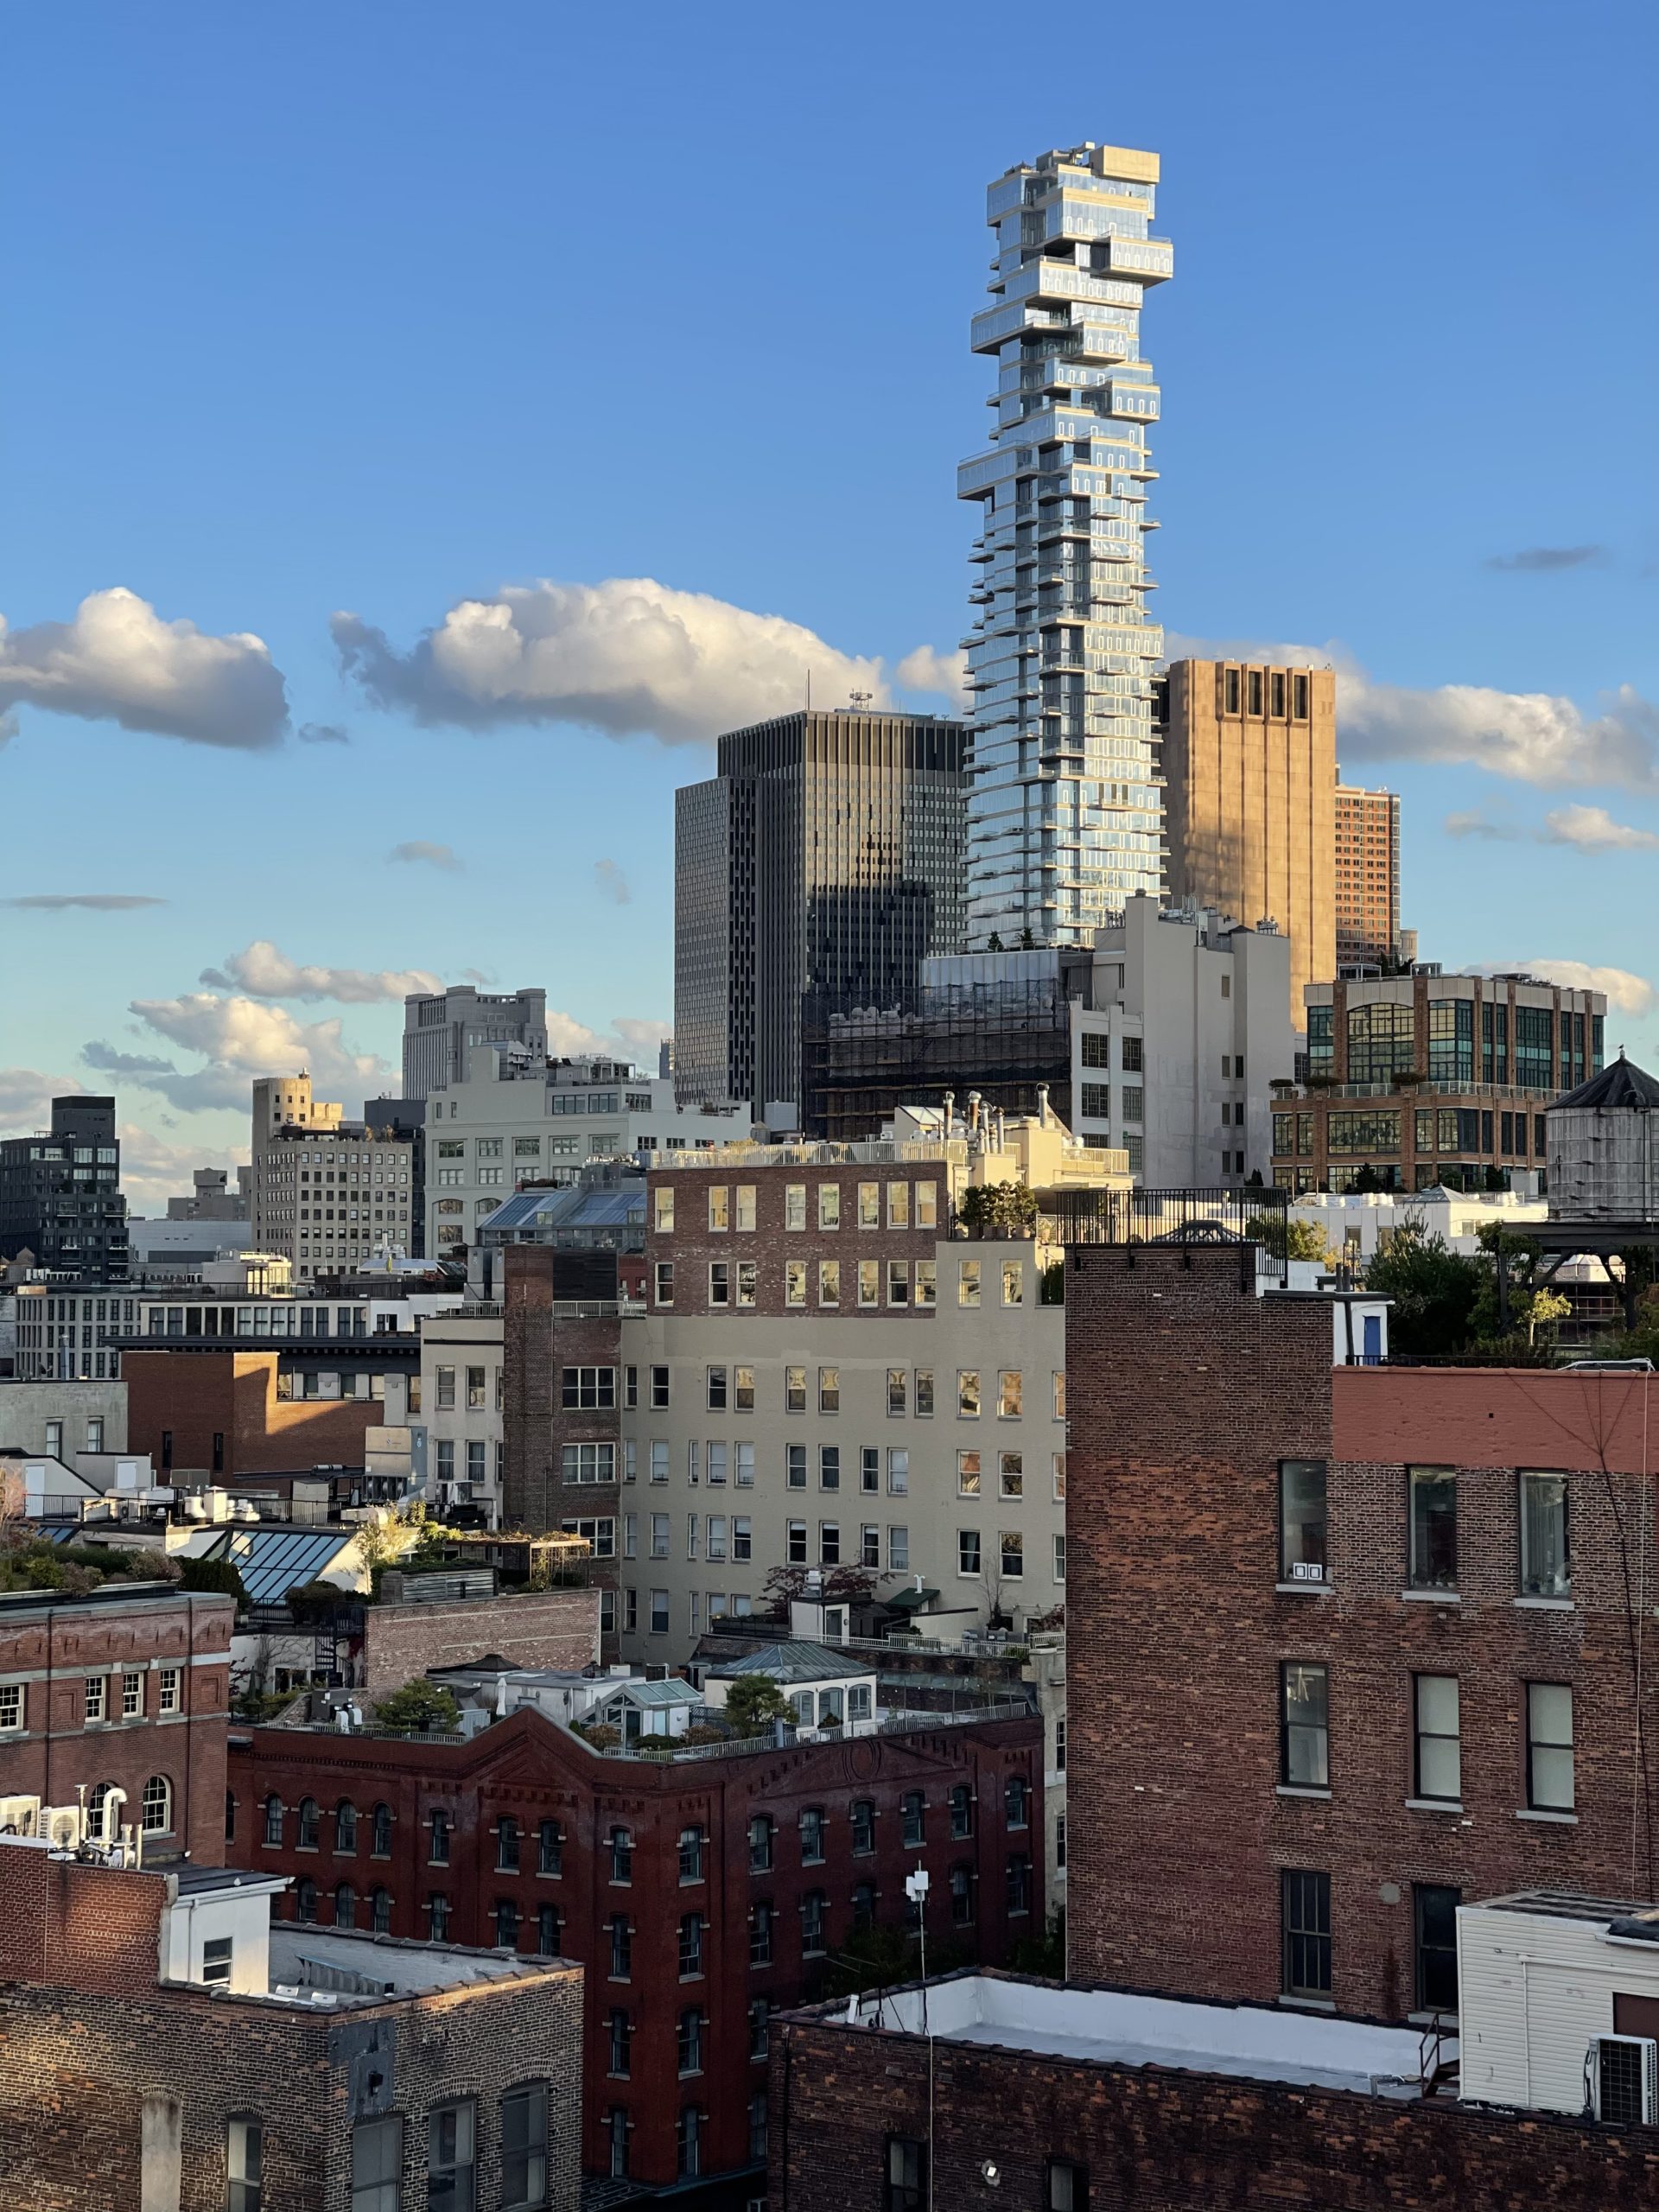
Photo by Michael Young
Total floor area filed by borough
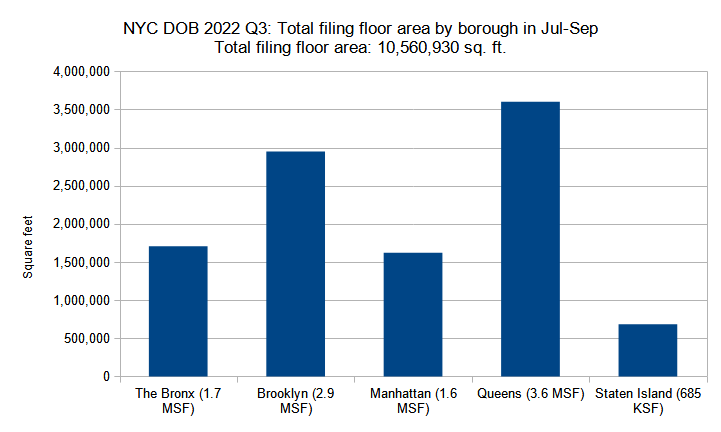
Combined floor area of new construction permits filed per borough in New York City in the third quarter (July through September) of 2022. Data source: the NYC Department of Buildings. Data aggregation and graphics credit: Vitali Ogorodnikov
Although the total volume of floor area filed for in New York City dropped from 13 million square feet in the second quarter down to 10.5 million square feet in the third quarter, the distribution between the boroughs is so similar that one chart may easily be mistaken for another at first glance.
Queens is still ahead of the pack in the third quarter, even though its total dipped from 4.3 million square feet in Q2 down to 3.6 million square feet in Q3. Brooklyn, in second place, has lowered from 4.1 million square feet in Q2 down to 2.9 million square feet in Q3. The Bronx, in third place, went from 2.2 million square feet in Q2 down to 1.7 million square feet in Q3. Manhattan maintained a similar square footage total, slipping from 1.8 million square feet in Q2 down to 1.6 million square feet in Q3.
Staten Island displayed the smallest drop of the group, with its total lowering from 723,000 square feet in the second quarter down to 685,000 square feet in the third quarter. However, it is still a comparatively paltry overall volume, cobbled together largely from single- and two-family home permits, which keeps it in last place among the five boroughs.
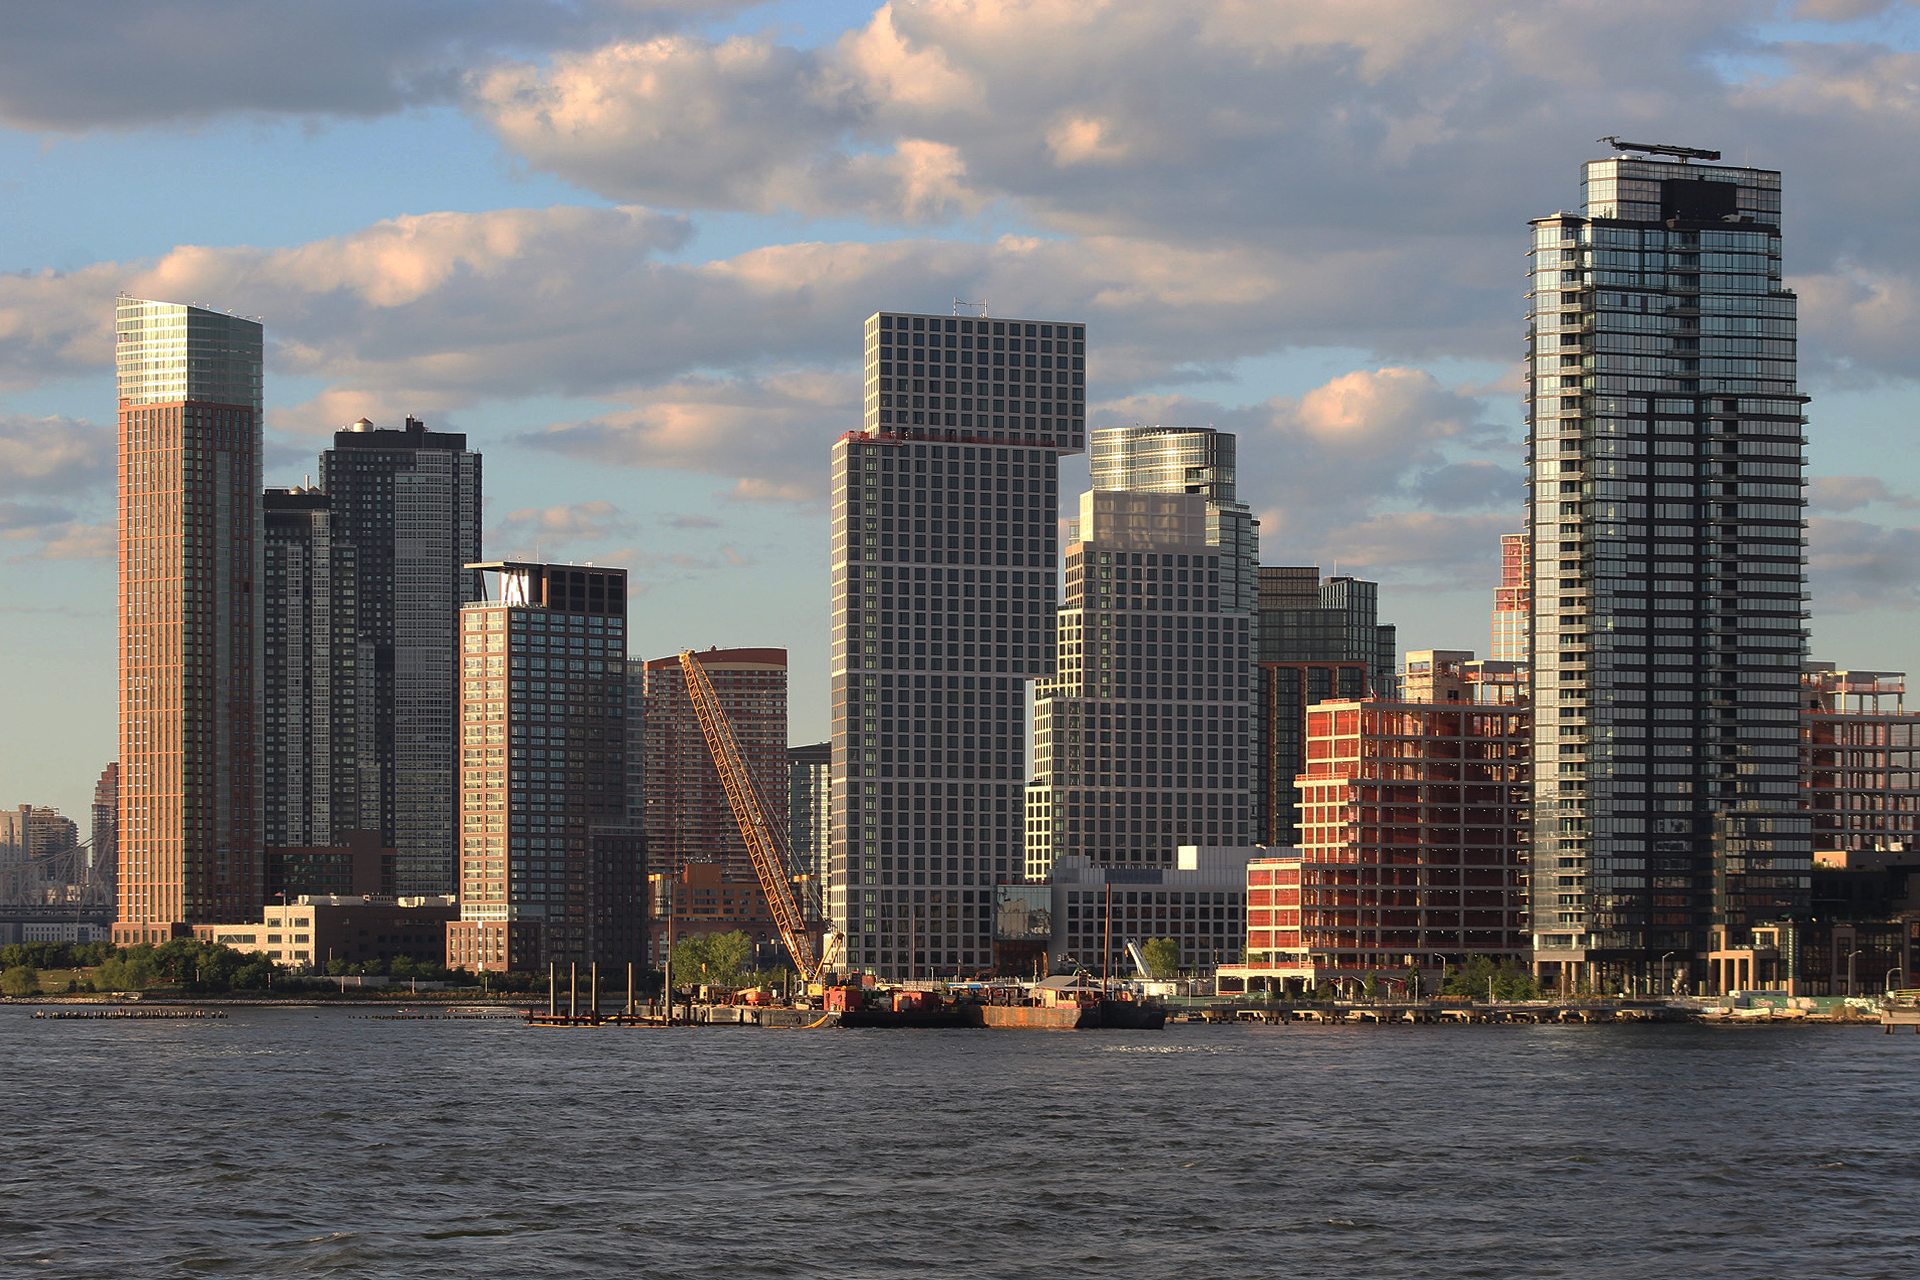
Eagle + West (center). Photo by Michael Young
Average floor area per permit filing by borough
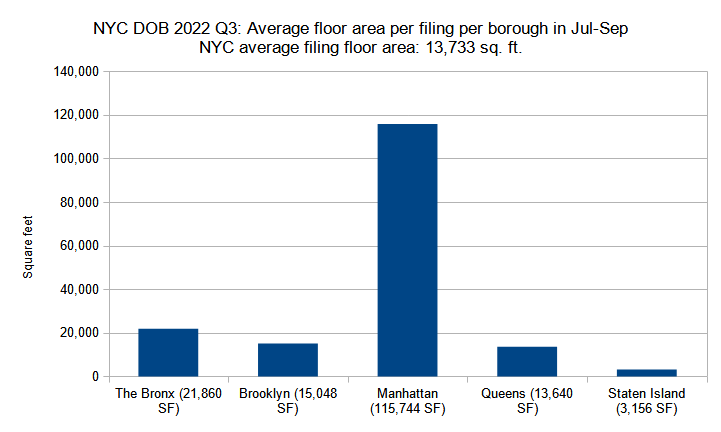
Average floor area per new construction permit per borough filed in New York City in the third quarter (July through September) of 2022. Data source: the NYC Department of Buildings. Data aggregation and graphics credit: Vitali Ogorodnikov
When comparing the square footage of the average filing by borough, the chart for the third quarter remains very similar to that of the second quarter, although Manhattan dramatically increased its dominance over its counterparts. The borough’s third-quarter average of 115,744 square feet per filing more than doubles its prior quarter’s average of 55,862 square feet.
The average areas per filing for the remaining boroughs have barely changed, with the Bronx rising from 19,077 square feet in Q2 to 21,860 square feet in Q3, Brooklyn dipping from 17,118 in Q2 to 15,048 in Q3, Queens shifting slightly down from 13,804 in Q2 down to 13,640 in Q3, and Staten Island lowering from 4,490 square feet in Q2 down to 3,156 square feet in Q3.
The ten largest filings in the third quarter are as follows: 343 Madison Avenue, Manhattan (982,000 square feet); 61-06 Junction Boulevard, Queens (786,398 square feet); 28-90 Review Avenue, Queens (682,459 square feet); 2797 Atlantic Avenue, Brooklyn (362,172 square feet); 171 West 239th Street, the Bronx (279,518 square feet); 255 East 77th Street, Manhattan (250,723 square feet); 133-09 37th Avenue, Queens (171,713 square feet); 575 Grand Street, Brooklyn (158,072 square feet); 325 Bergen Street, Brooklyn (156,046 square feet); and 78-29 Austin Street, Queens (150,780 square feet).
Note that there is a significant, though hardly surprising, overlap between the top ten lists for the third quarter’s largest buildings by floor count and by floor area.
2 Penn Plaza (center) and the Penn District. Photo by Michael Young
Permits listed by floor area per filing
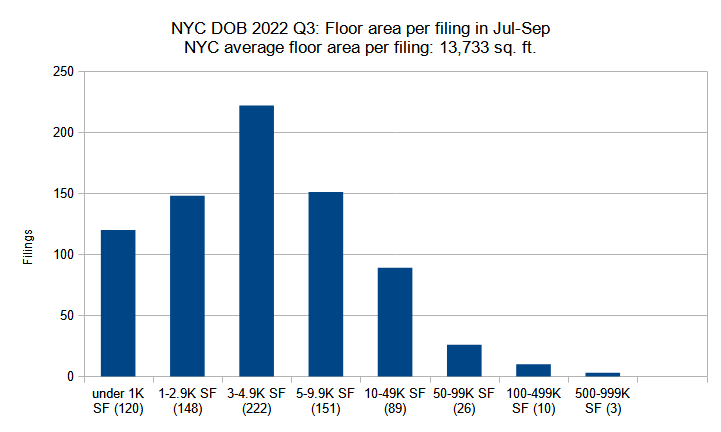
New construction permits filed in New York City in the third quarter (July through September) of 2022 grouped by total floor area. Data source: the NYC Department of Buildings. Data aggregation and graphics credit: Vitali Ogorodnikov
Our earlier data analysis, which categorized third-quarter construction filings by number of units per filing, showed the largest categories to be those accounting for single- and two-family residences, while the tally by floor count per filing has shown proposed buildings with two to three stories to be by far the predominant group.
Naturally, the same trend is evident when we tally the third-quarter filings by floor area, where the category with 3,000 to 5,000 square feet (222 filings total), which generally corresponds to the scale of buildings described above, has come out on top. Similarly, the two adjacent categories, which would also include such buildings and span a general range from 1,000 to 10,000 square feet, take a very close second and third place.
As expected, the number of filings in the larger categories drops at a steady rate until it reaches the ten filings in the 100,000 to 500,000-square-foot category and three more in the half-million to 1-million-square-foot category. Filings spanning under 1,000 square feet, which generally represent garages, tally a total of 120 entries.

625 Fulton Street. Photo by Michael Young

540 Fulton Street (right). Photo by Michael Young
The Brooklyn Tower. Photo by Michael Young

35 Commercial Street. Photo by Michael Young
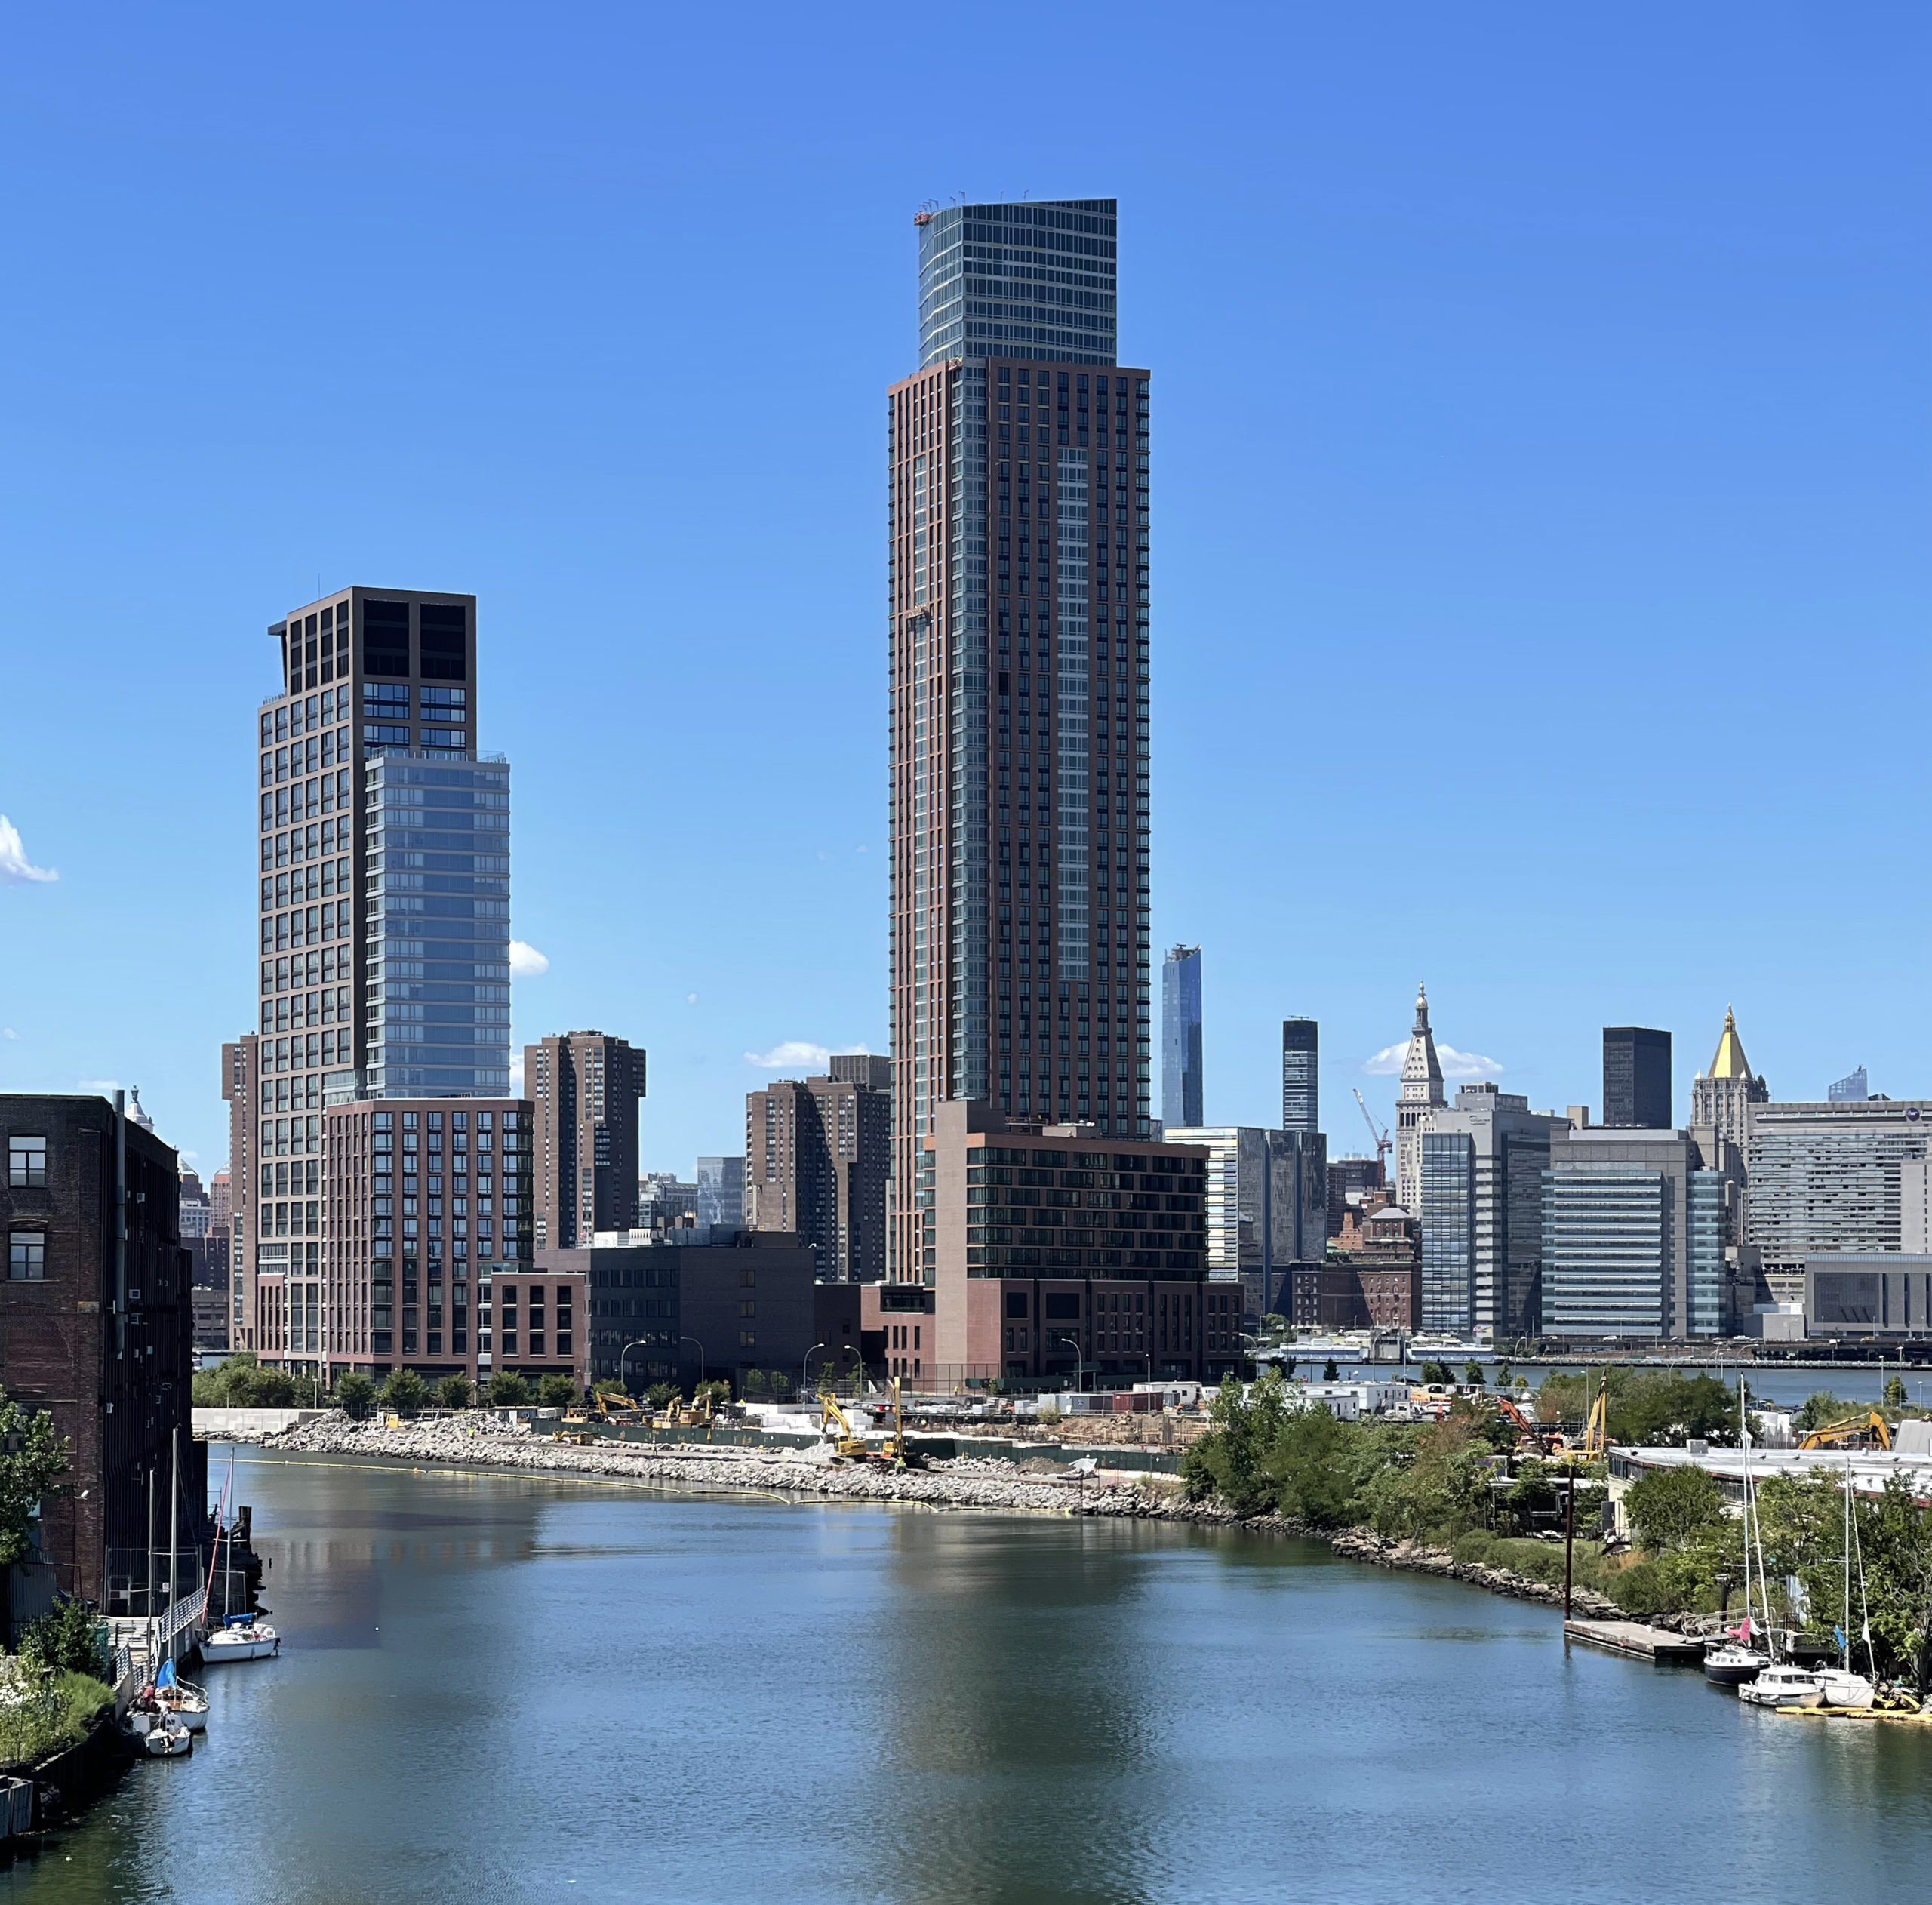
Photo by Michael Young
555 West 38th Street. Photo by Michael Young

Photo by Michael Young
Photo by Michael Young

Photo by Michael Young
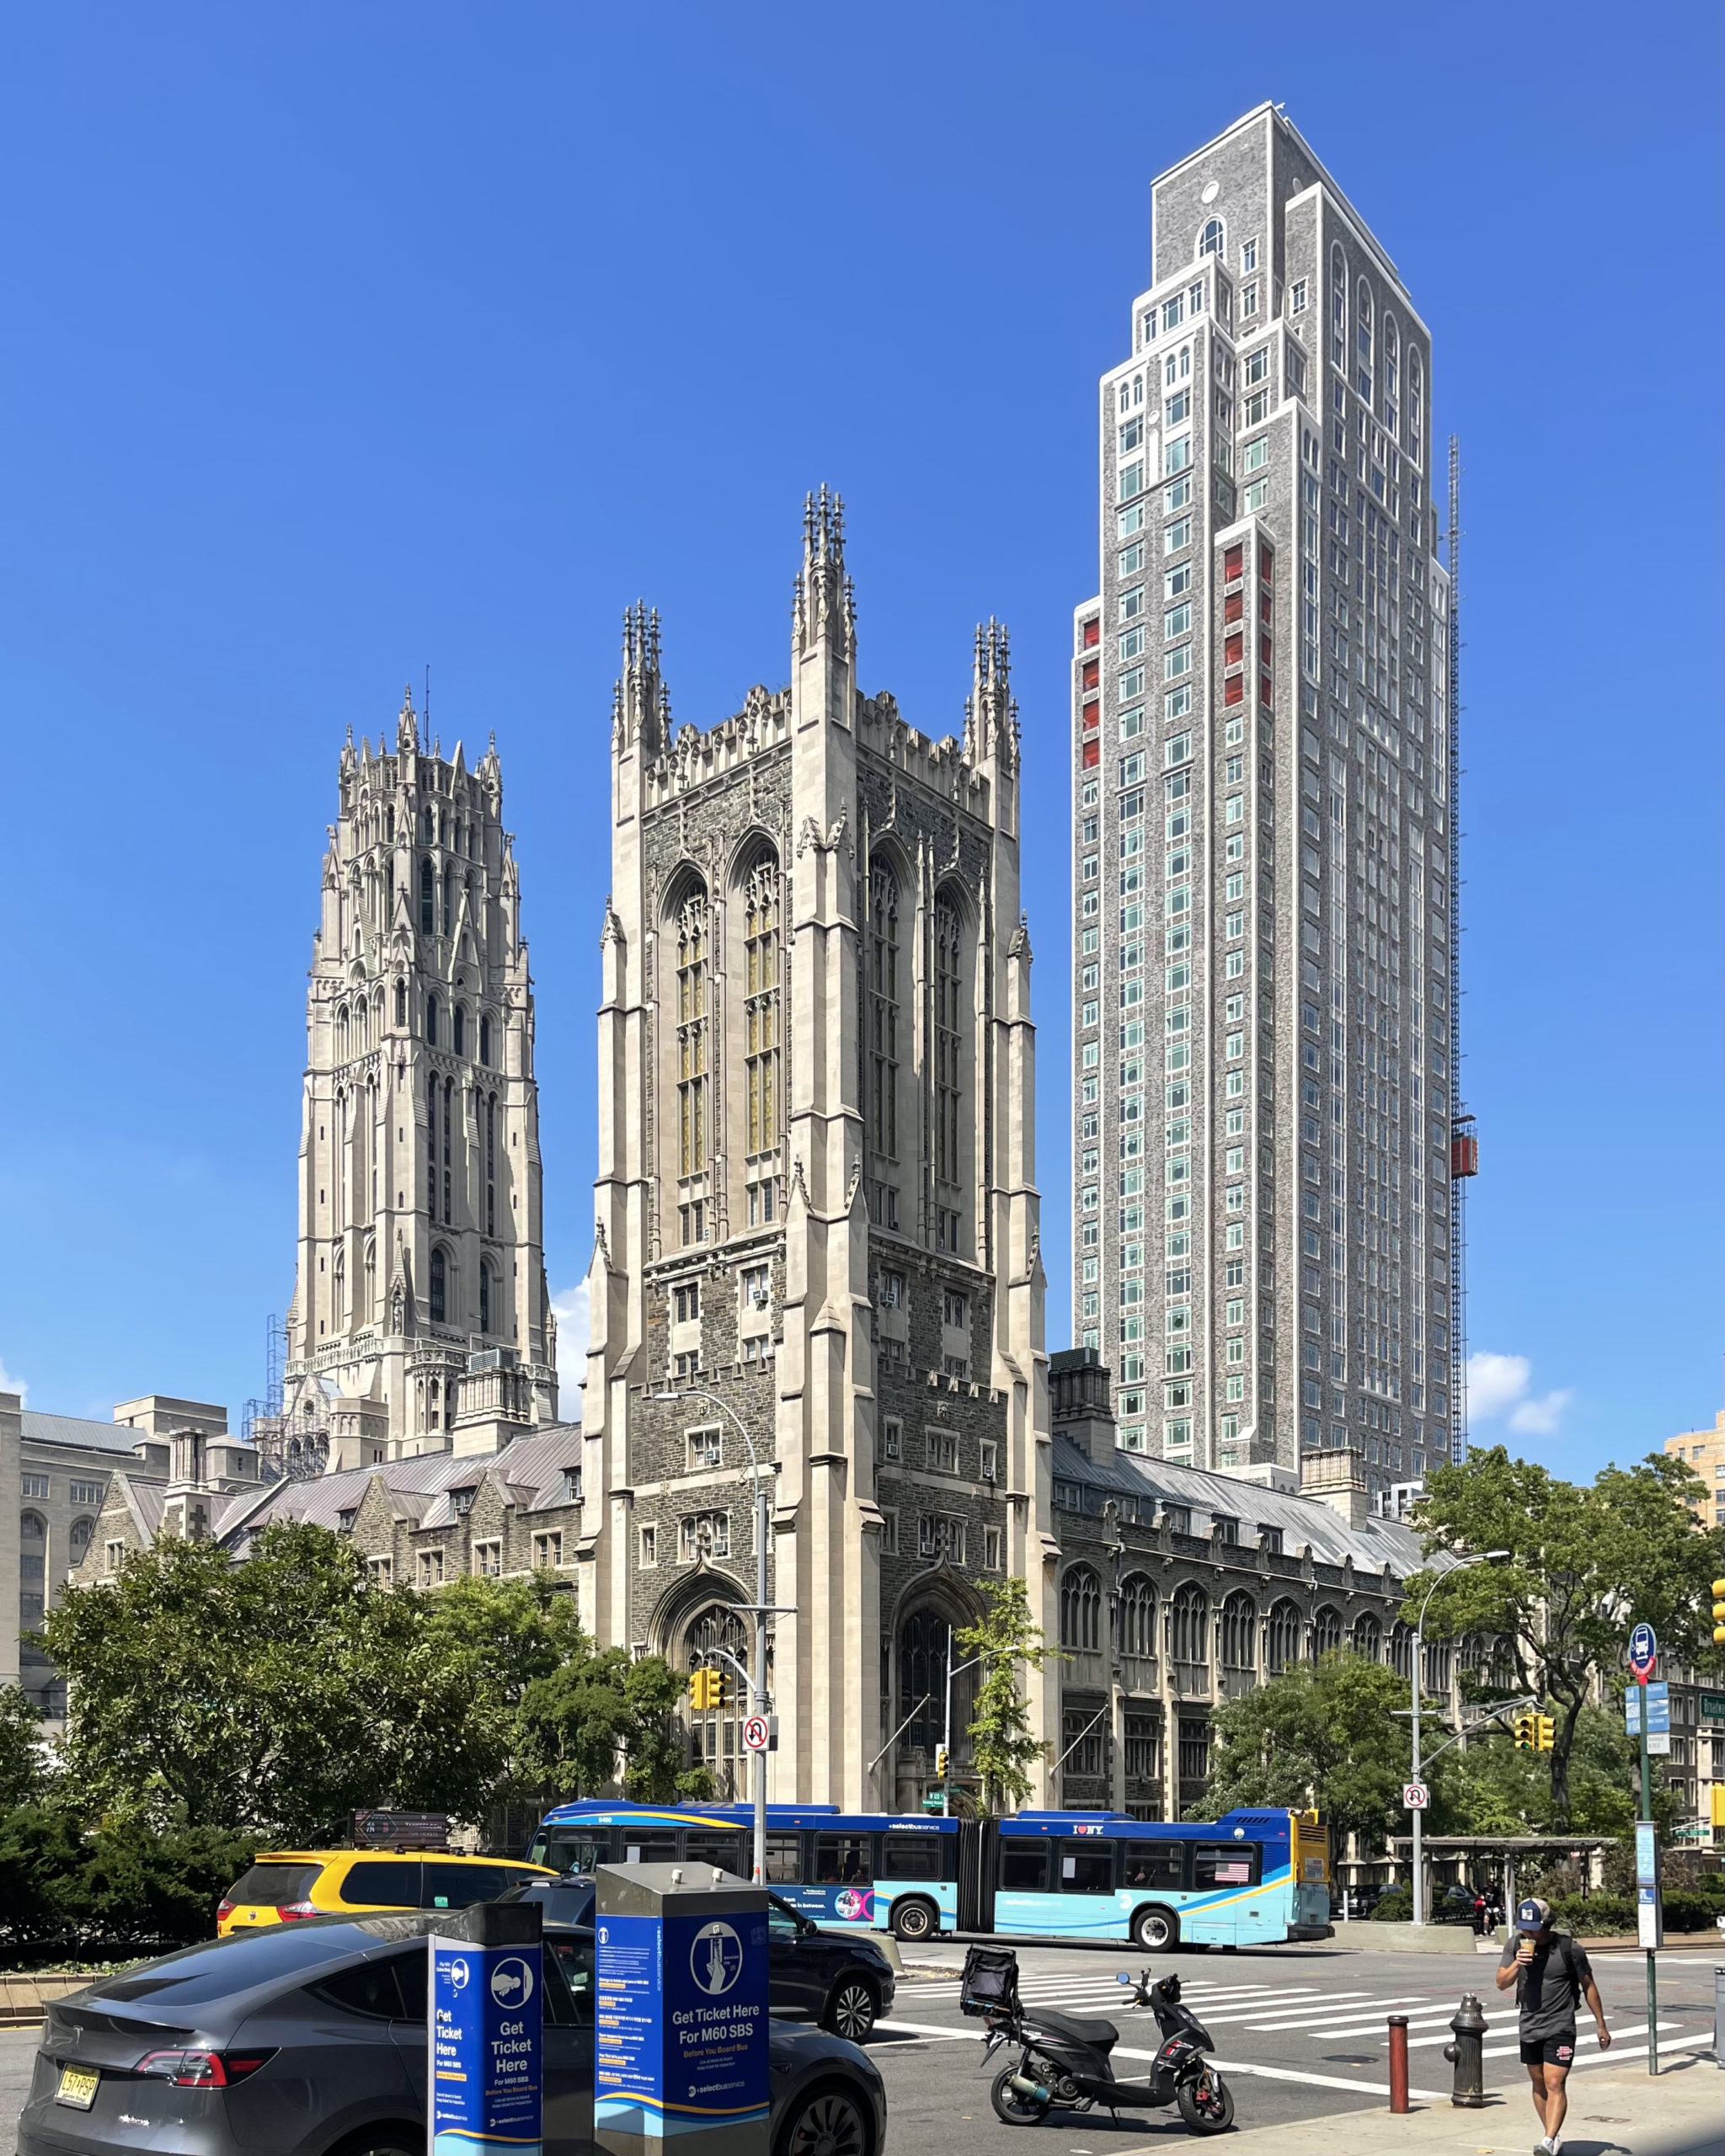
Claremont Hall. Photo by Michael Young
Photo by Michael Young
Subscribe to YIMBY’s daily e-mail
![]()
Follow YIMBYgram for real-time photo updates
Like YIMBY on Facebook
Follow YIMBY’s Twitter for the latest in YIMBYnews
As much as people keep on saying that New York is “dying,” it’s still not going anywhere and development is doing superb.
Of course it’s not going anywhere but UP for the foreseeable future because it draws drive and talent from around the world (immigrants), just like my grandparents who fled pogroms in the Ukraine and Belarus 122 years ago. May it always be so.
Well said. Yes. May it always be so!
The high numbers in the first half were in anticipation of the expiration of 421-a.
Residential and hotels are very different property types, so it’s really annoying the city combines the two for permit tallies. How do we know the actual number of new housing units built in the city?
and a new report came out there is 80,000 vacant rent stabilized units to date, and people desperately need truly affordably housing, in nyc, a dam shame
As always, quarterly reports are a time for Michael Young’s “Greatest Hits”! Absolutely exquisite photography—a joy to behold! 📸
I agree! A nice recap of photos 🙌
And readers of YIMBY get it for free! Thanks, YIMBY! Thanks, Michael!