
The fourth-quarter numbers for New York City’s construction filings are in, and YIMBY is excited to report that the overall figures from October through December dramatically outpace those from the previous quarter. Although the total number of new building filings is slightly down, dipping from 768 in Q3 to 738 in Q4, the number of residential and hotel unit filings surged from 7,217 in Q3 to 13,030 in Q4. Similarly, the total filed-for floor area effectively doubled, rising from 10.6 million square feet in Q3 to 20.3 million square feet in Q4. In effect, not only has the size of the average filing become twice as large during the period, but it also increased in height from an average of 3.2 floors in Q3 to 4.1 floors in Q4. The full report in Excel format is available with a subscription to YIMBY’s Building Wire.
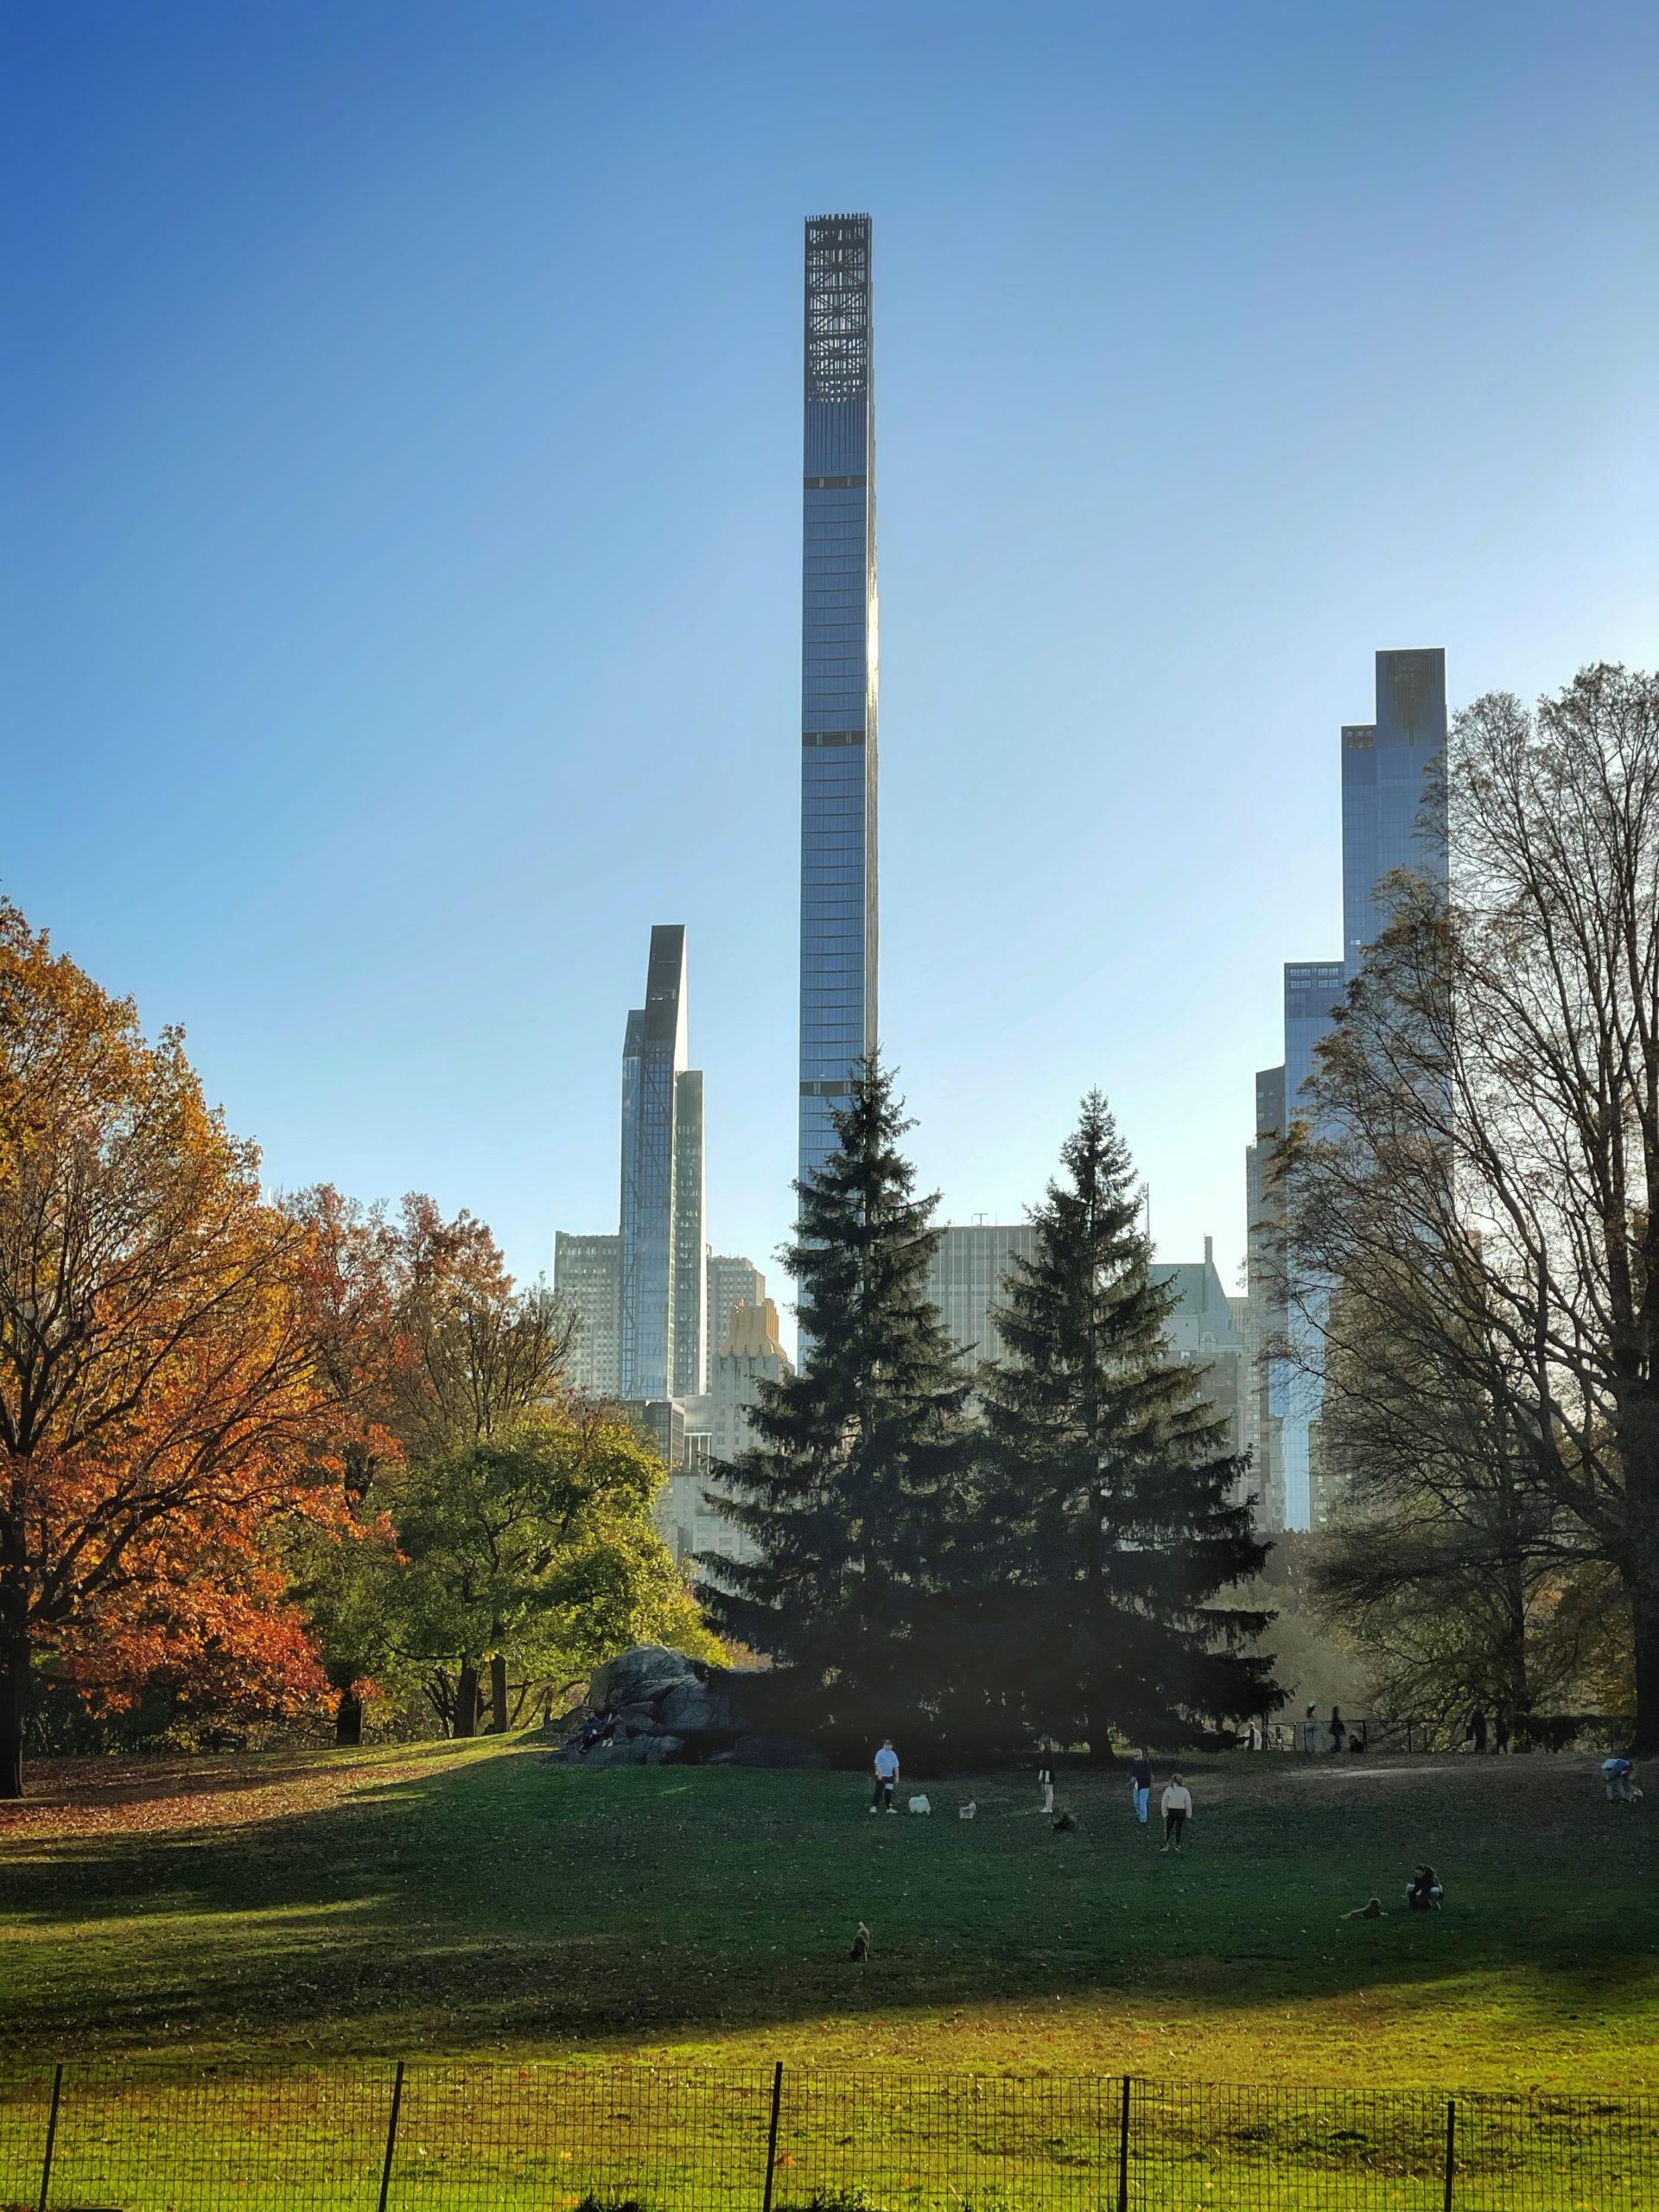
111 West 57th Street. Photo by Michael Young
Number of permit filings per month
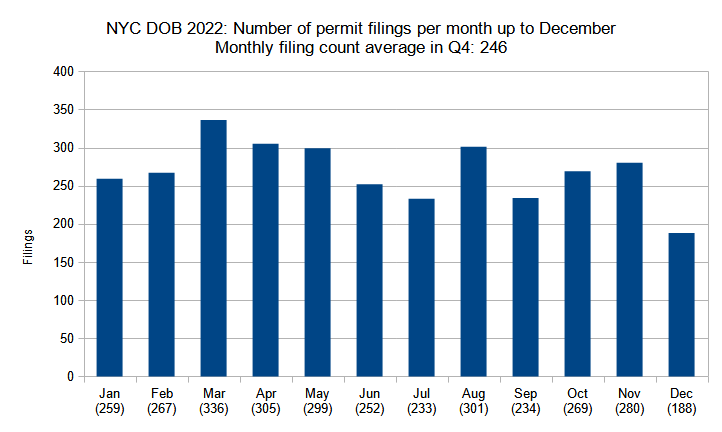
Number of new construction permits filed per month in New York City up to December 2022. Data source: the NYC Department of Buildings. Data aggregation and graphics credit: Vitali Ogorodnikov
As a whole, the average number of permits filed per month remained consistent with the rest of the year, perhaps dipping slightly from third-quarter figures. The fourth quarter tallied a total of 269 new building filings in October, 280 in November, and 188 in December, averaging 246 permits per month. The number is slightly lower than the monthly average of 256 permits for the third quarter and the 269 permit monthly average for the year.
However, despite the slight overall dip and the fact that December tallies the lowest average for the year, the numbers remain consistently strong in comparison to 2022. December’s tally of 188 easily clears the 2022 average of 168 new building permit filings per month.
Photo by Michael Young.
Number of permit filings by borough
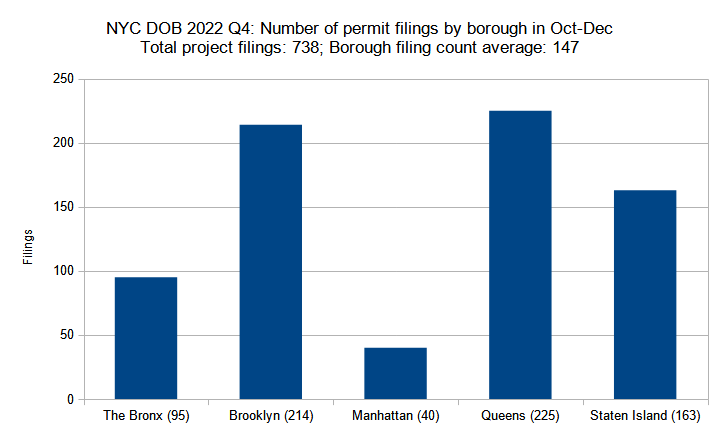
Number of new construction permits filed per borough in New York City in the fourth quarter (October through December) of 2022. Data source: the NYC Department of Buildings. Data aggregation and graphics credit: Vitali Ogorodnikov
Manhattan tends to produce buildings much larger in size, yet fewer in number, than any other borough. Following a trend well established in our regular report coverage, Manhattan, with 40 filings in the fourth quarter of 2022, counts far fewer new building filings than any of its counterparts or the average of 147 filings per borough. However, Manhattan’s fourth-quarter tally roughly triples the borough’s paltry count of 14 filings in the third quarter, indicating a strong resurgence in developer interest.
The rest of the boroughs also roughly follow the trend observed in the third quarter, with slight variations between the two periods. Queens still leads with 225 filings, although the figure is slightly smaller than its 264 count in Q3. Brooklyn raced ahead from third to second place, nearly catching up to first by rising from 196 filings in Q3 up to 214 filings in Q4.
Staten Island slipped to third place, dipping from 217 filings in Q3 down to 163 filings in Q4. The Bronx is still in fourth place, although its count has risen notably from 78 in Q3 to 95 in Q4.
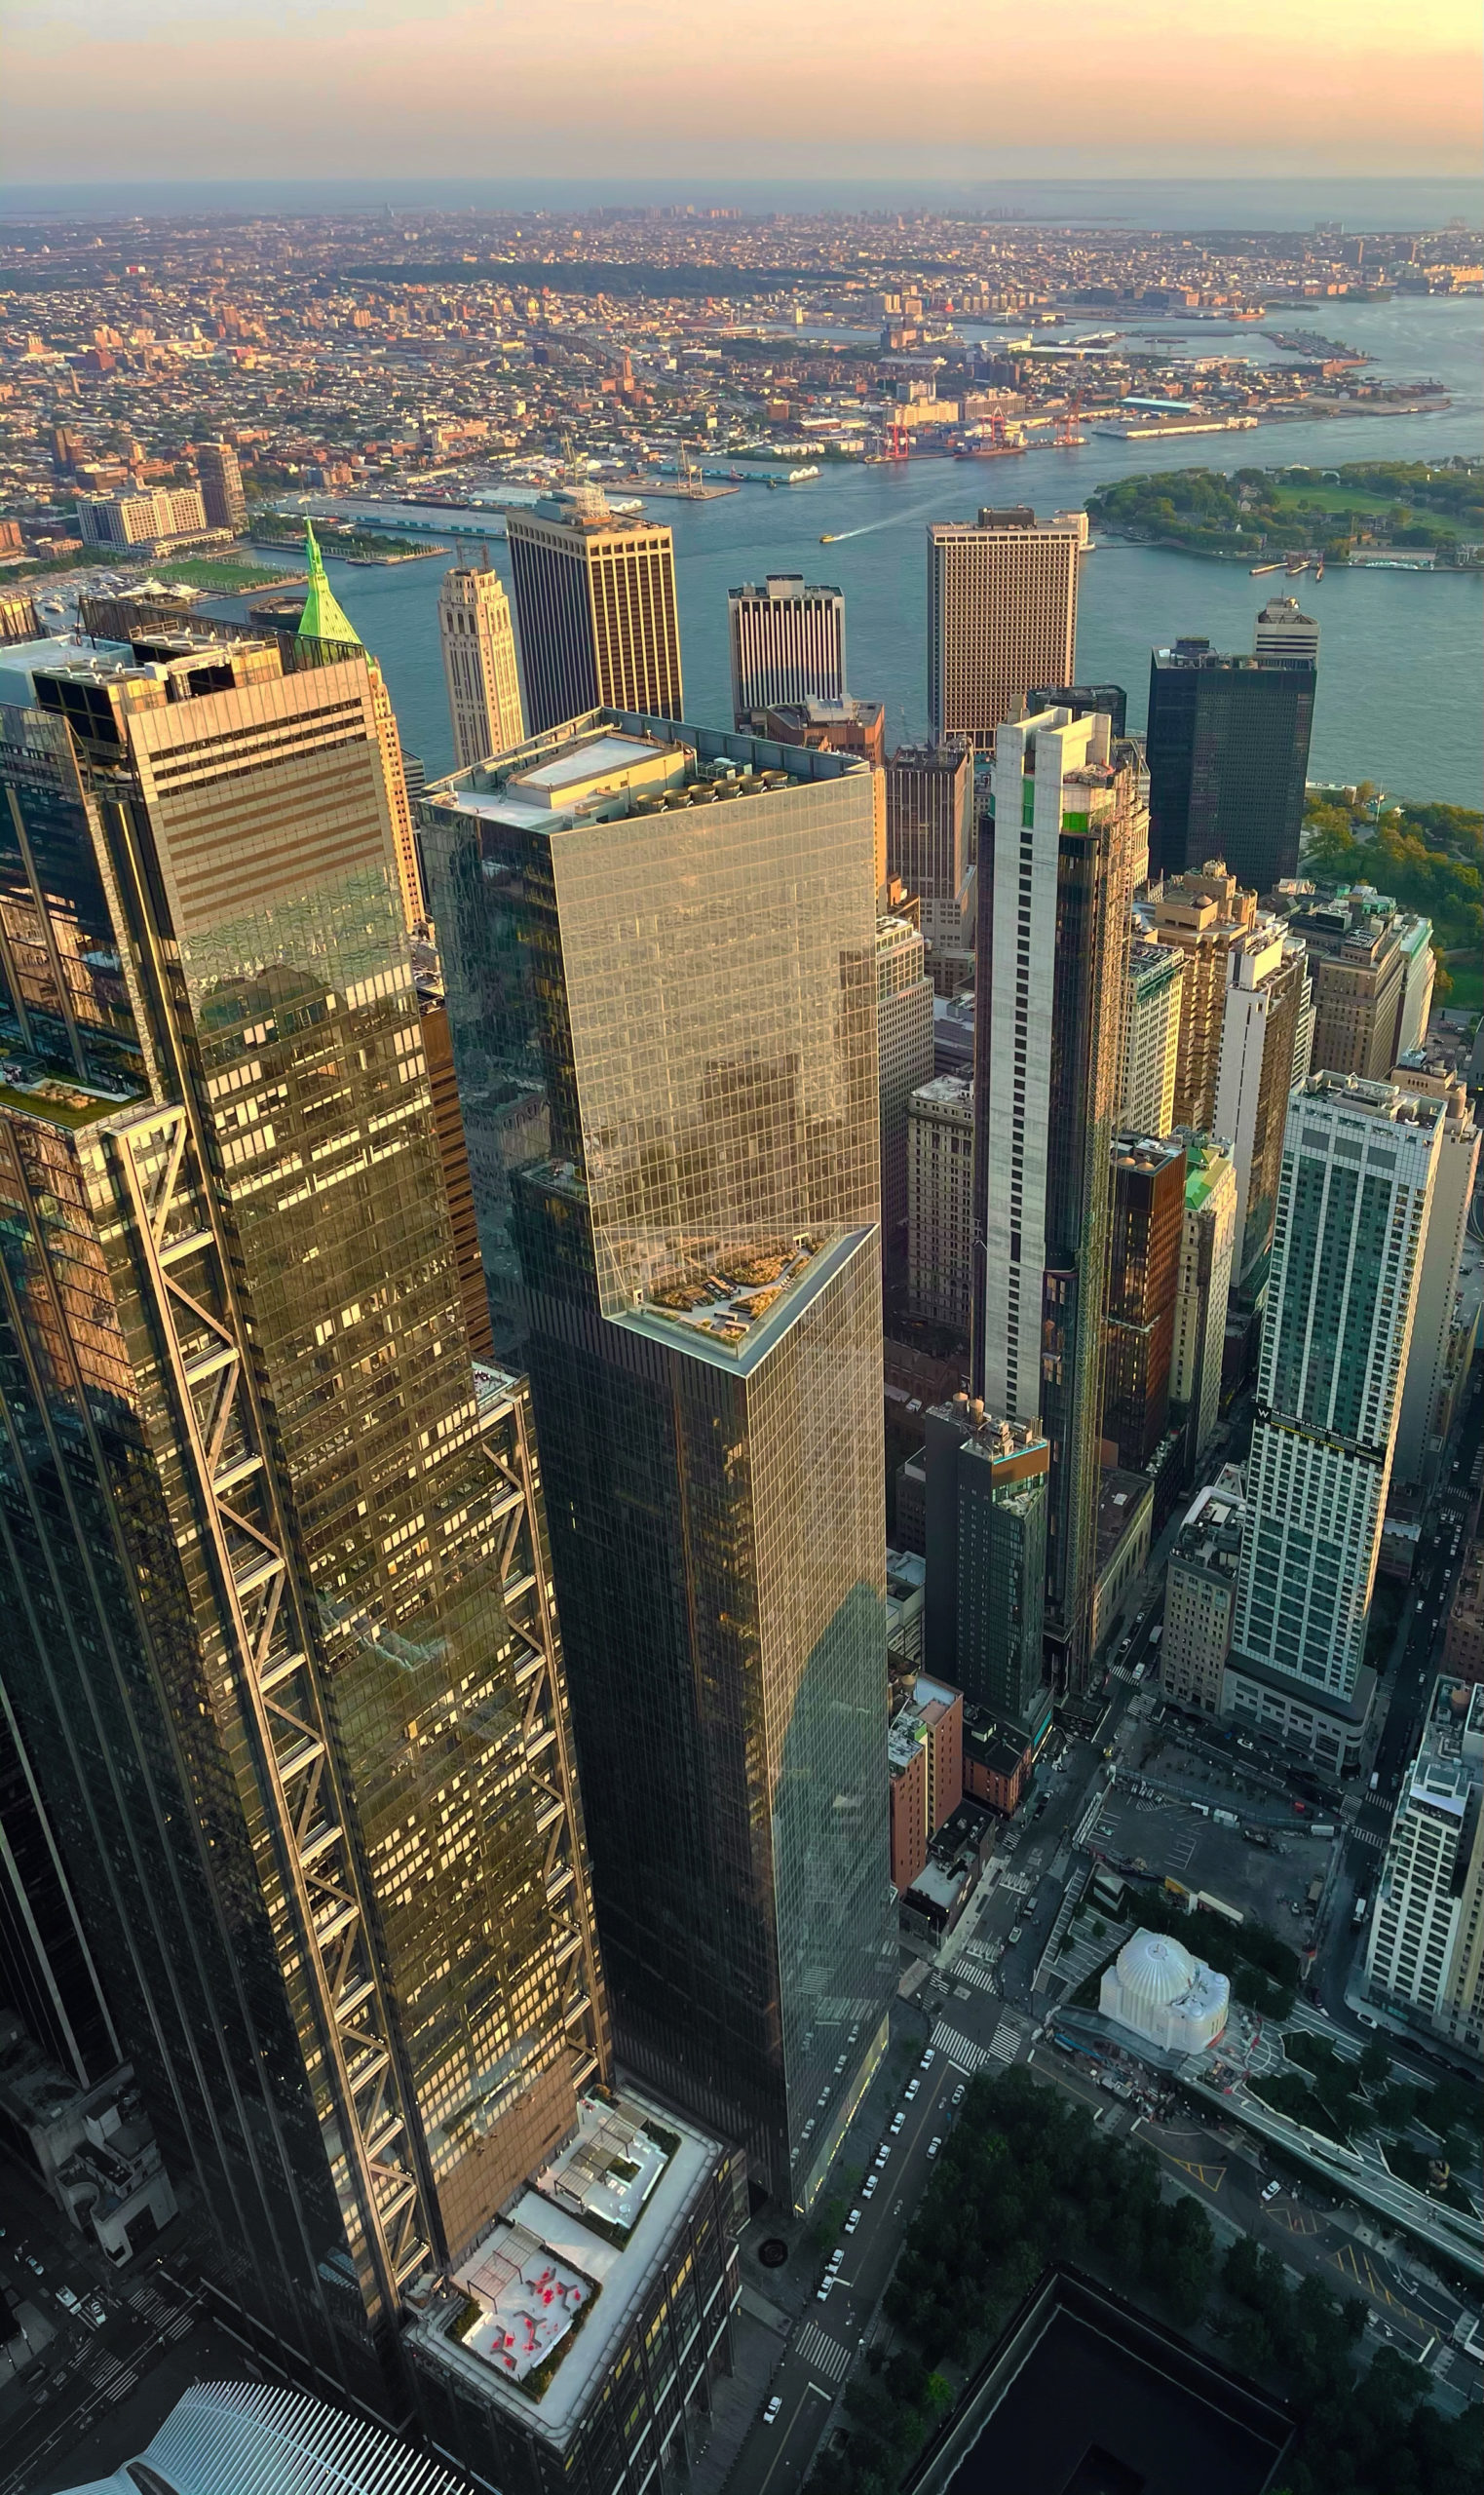
125 Greenwich Street. Photo by Michael Young
Residential and hotel units filed per borough
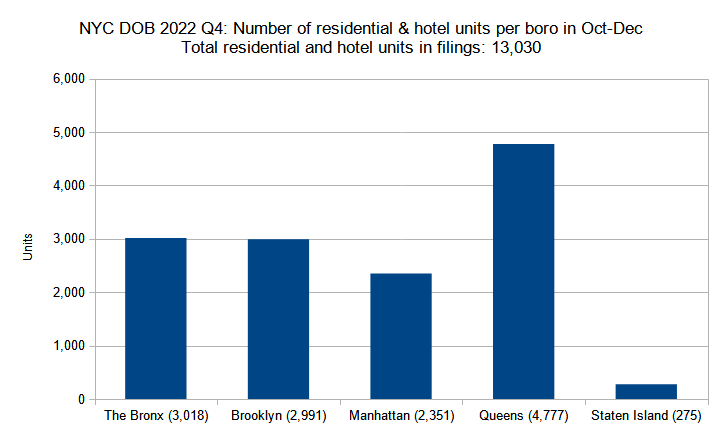
Number of residential and hotel units in new construction permits filed per borough in New York City in the fourth quarter (October through December) of 2022. Data source: the NYC Department of Buildings. Data aggregation and graphics credit: Vitali Ogorodnikov
As seen in the analysis above, the total count of new building permit filings in the fourth quarter of 2022 remained largely consistent with the previous quarter. By contrast, the total residential and hotel unit count nearly doubled, jumping from 7,217 in Q3 up to 13,030 in Q4. As such, the total unit count rose across the board in almost every borough.
The Bronx surged from 2,031 unit filings in Q3 to 3,018 units in Q4. Displaying a similar upswing, Brooklyn’s unit count rose from 2,108 in Q3 to 2,991 in Q4. Percentage-wise Manhattan has shown the highest growth, skyrocketing eightfold from a mere 290 units in Q3 to 2,351 units in Q4. Queens held on to first place by increasing its unit count from 2,514 in Q3 to an impressive total of 4,777 units in Q4.
Only Staten Island failed to show any progress during the period, although the fact that its count remained at 275 for each quarter also shows that the borough’s development progress has not lost any steam in the meantime.
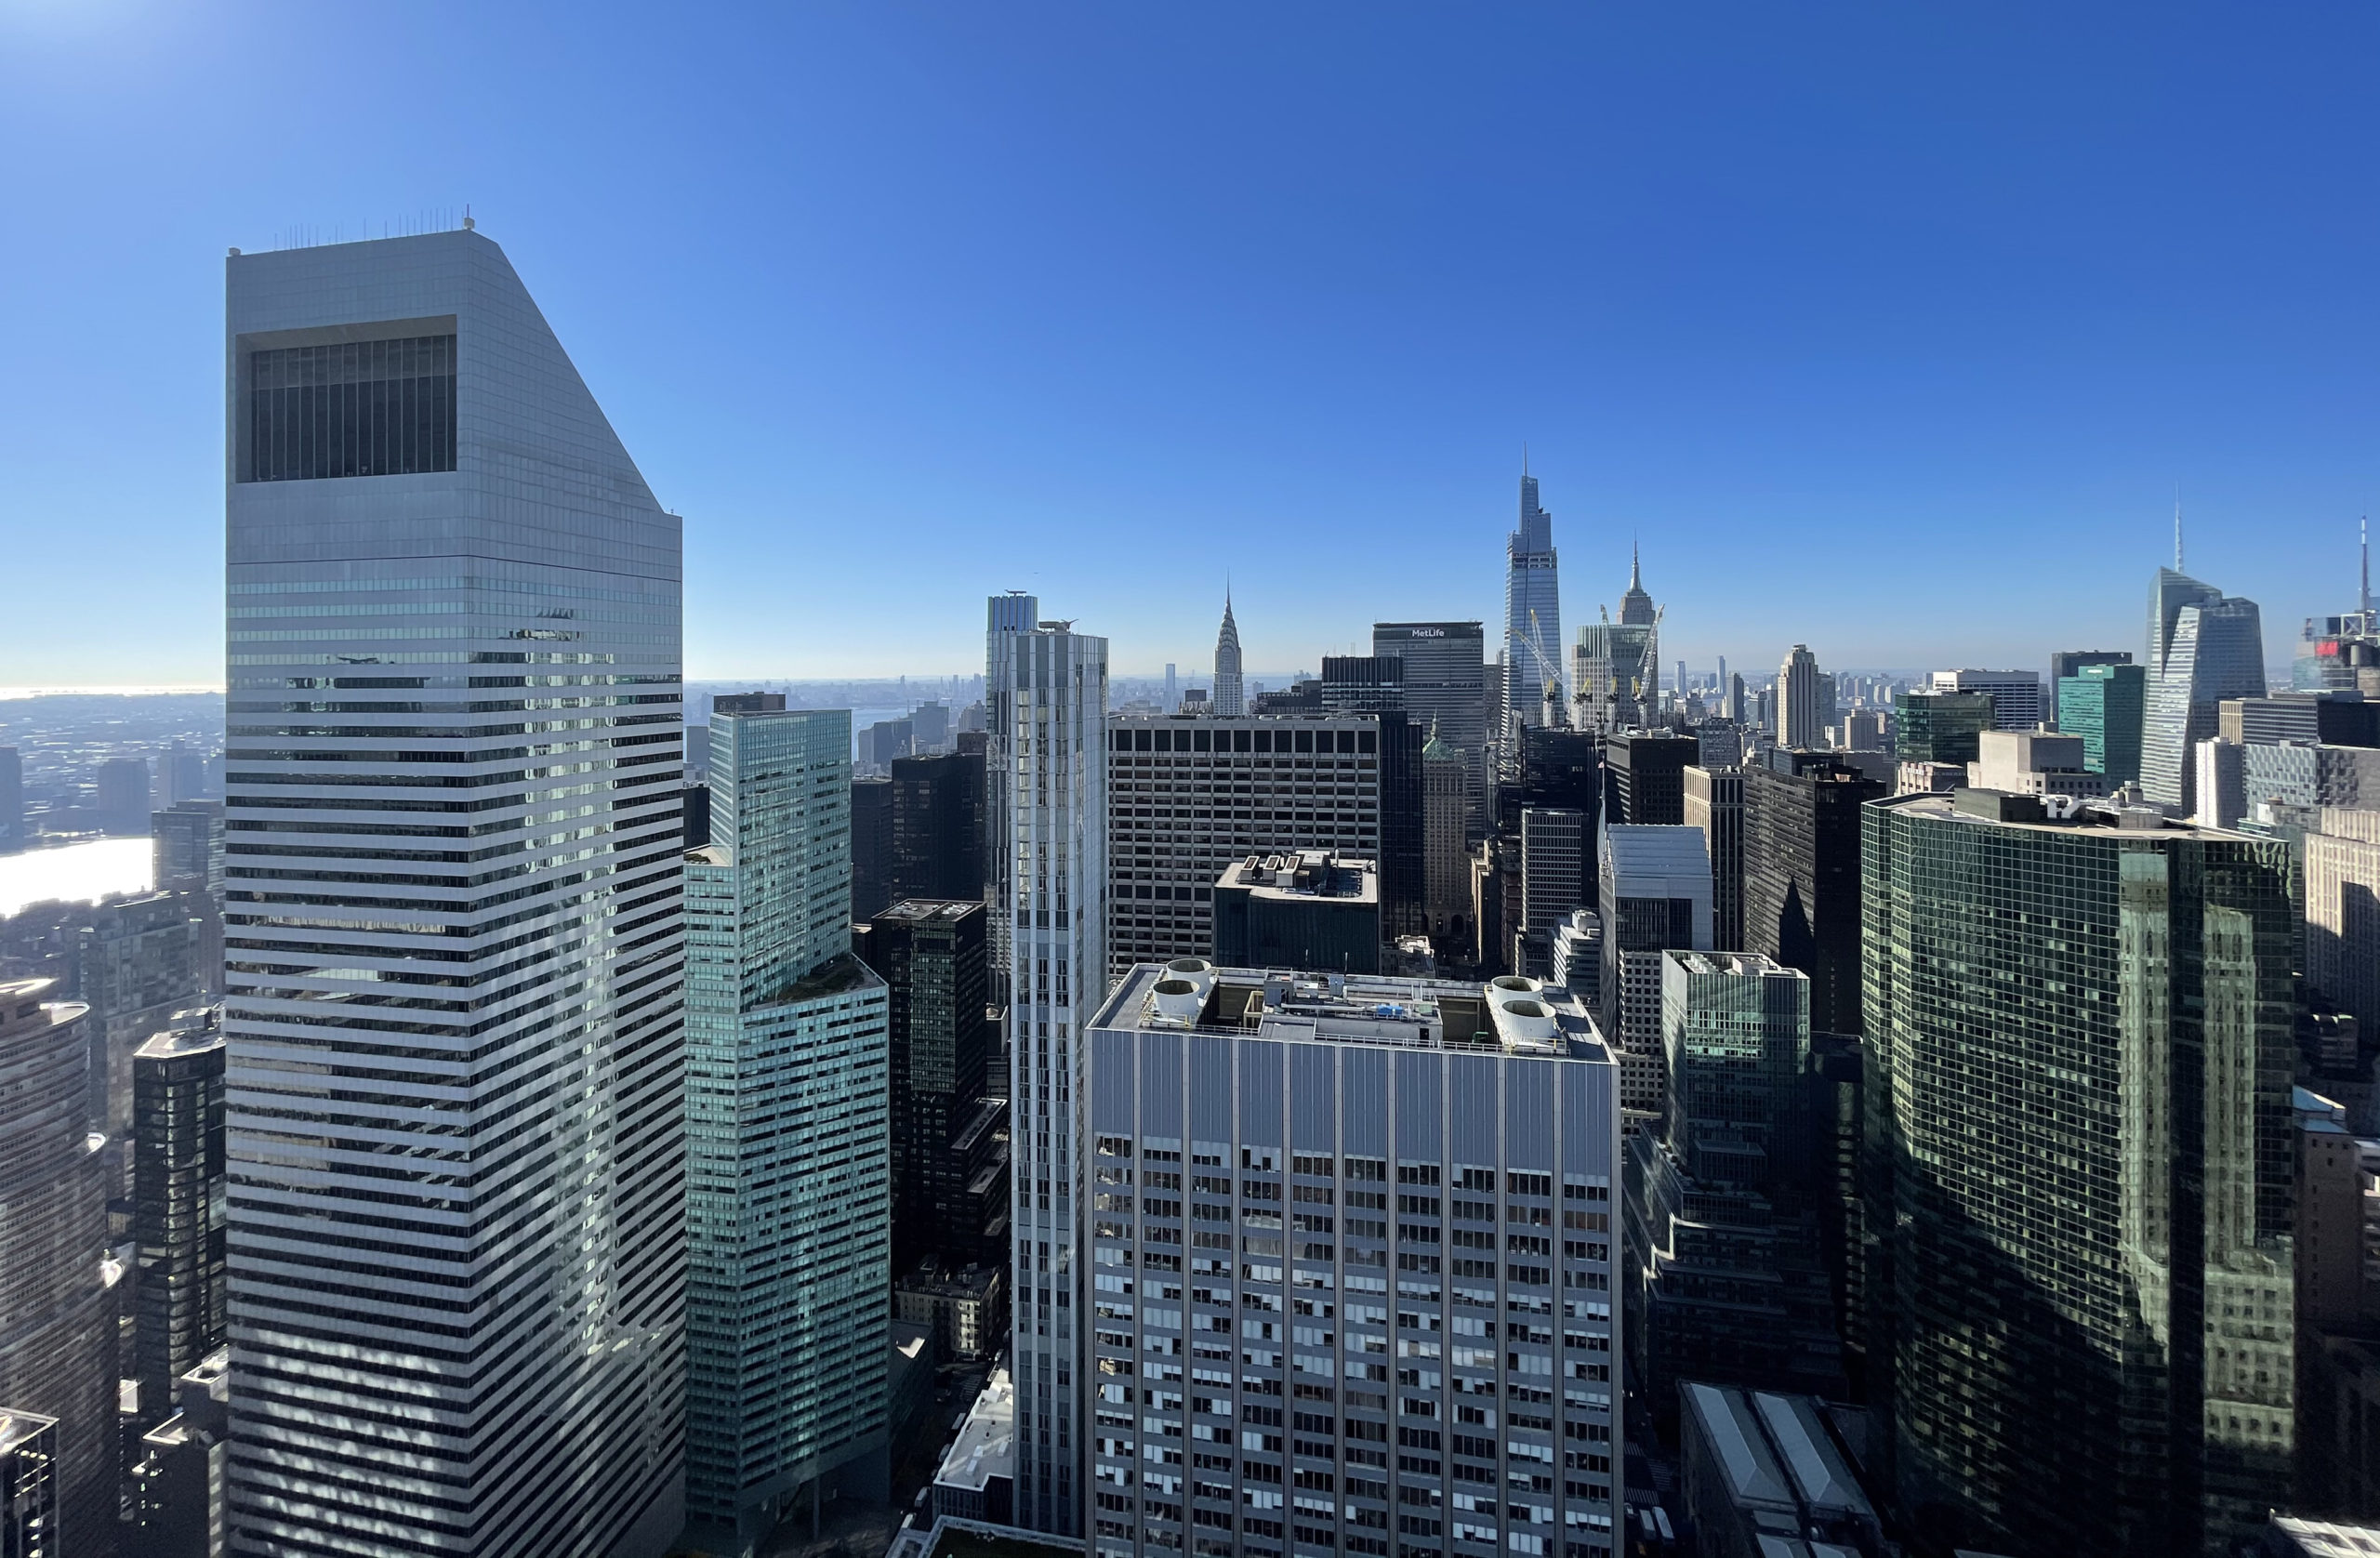
Photo by Michael Young
Permits listed by unit count per filing
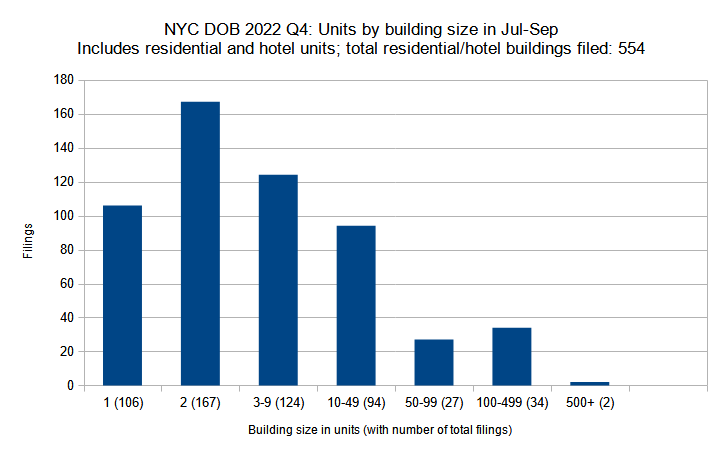
New residential and hotel construction permits filed in New York City in the fourth quarter (October through December) of 2022 grouped by unit count per filling. Data source: the NYC Department of Buildings. Data aggregation and graphics credit: Vitali Ogorodnikov
In the introduction, we mentioned that the total volume of new building permit filings in the fourth quarter of 2022 nearly doubled in comparison to the third quarter. Furthermore, if we break down the residential and hotel filings by unit counts, we discover that the filing counts have dropped notably in the lowest categories, which in turn also means that we have observed dramatic growth in some of the largest categories.
The total number of single-family filings dropped from 168 in Q3 down to 106 in Q4, and the figure lowered for two-family filings (which nevertheless remain the largest category) from 212 in Q3 down to 167 in Q4. The number of medium-sized filings, with three to nine units, has remained generally consistent, dipping ever so slightly from 129 in Q3 down to 124 in Q4.
The larger categories of apartment buildings and hotels is where we start to see significant growth. The number of filings for buildings with ten to 49 units has increased from 76 in Q3 to 94 in Q4; for buildings ranging from 50 to 99 units, the figure has nearly doubled from 16 filings in Q3 to 27 filings in Q4, and nearly tripled for large buildings ranging from 100 to 499 units (going from 13 filings in Q3 to 34 filings in Q4). The number of filings with 500 and more units has risen from one in Q3 to two in Q4.
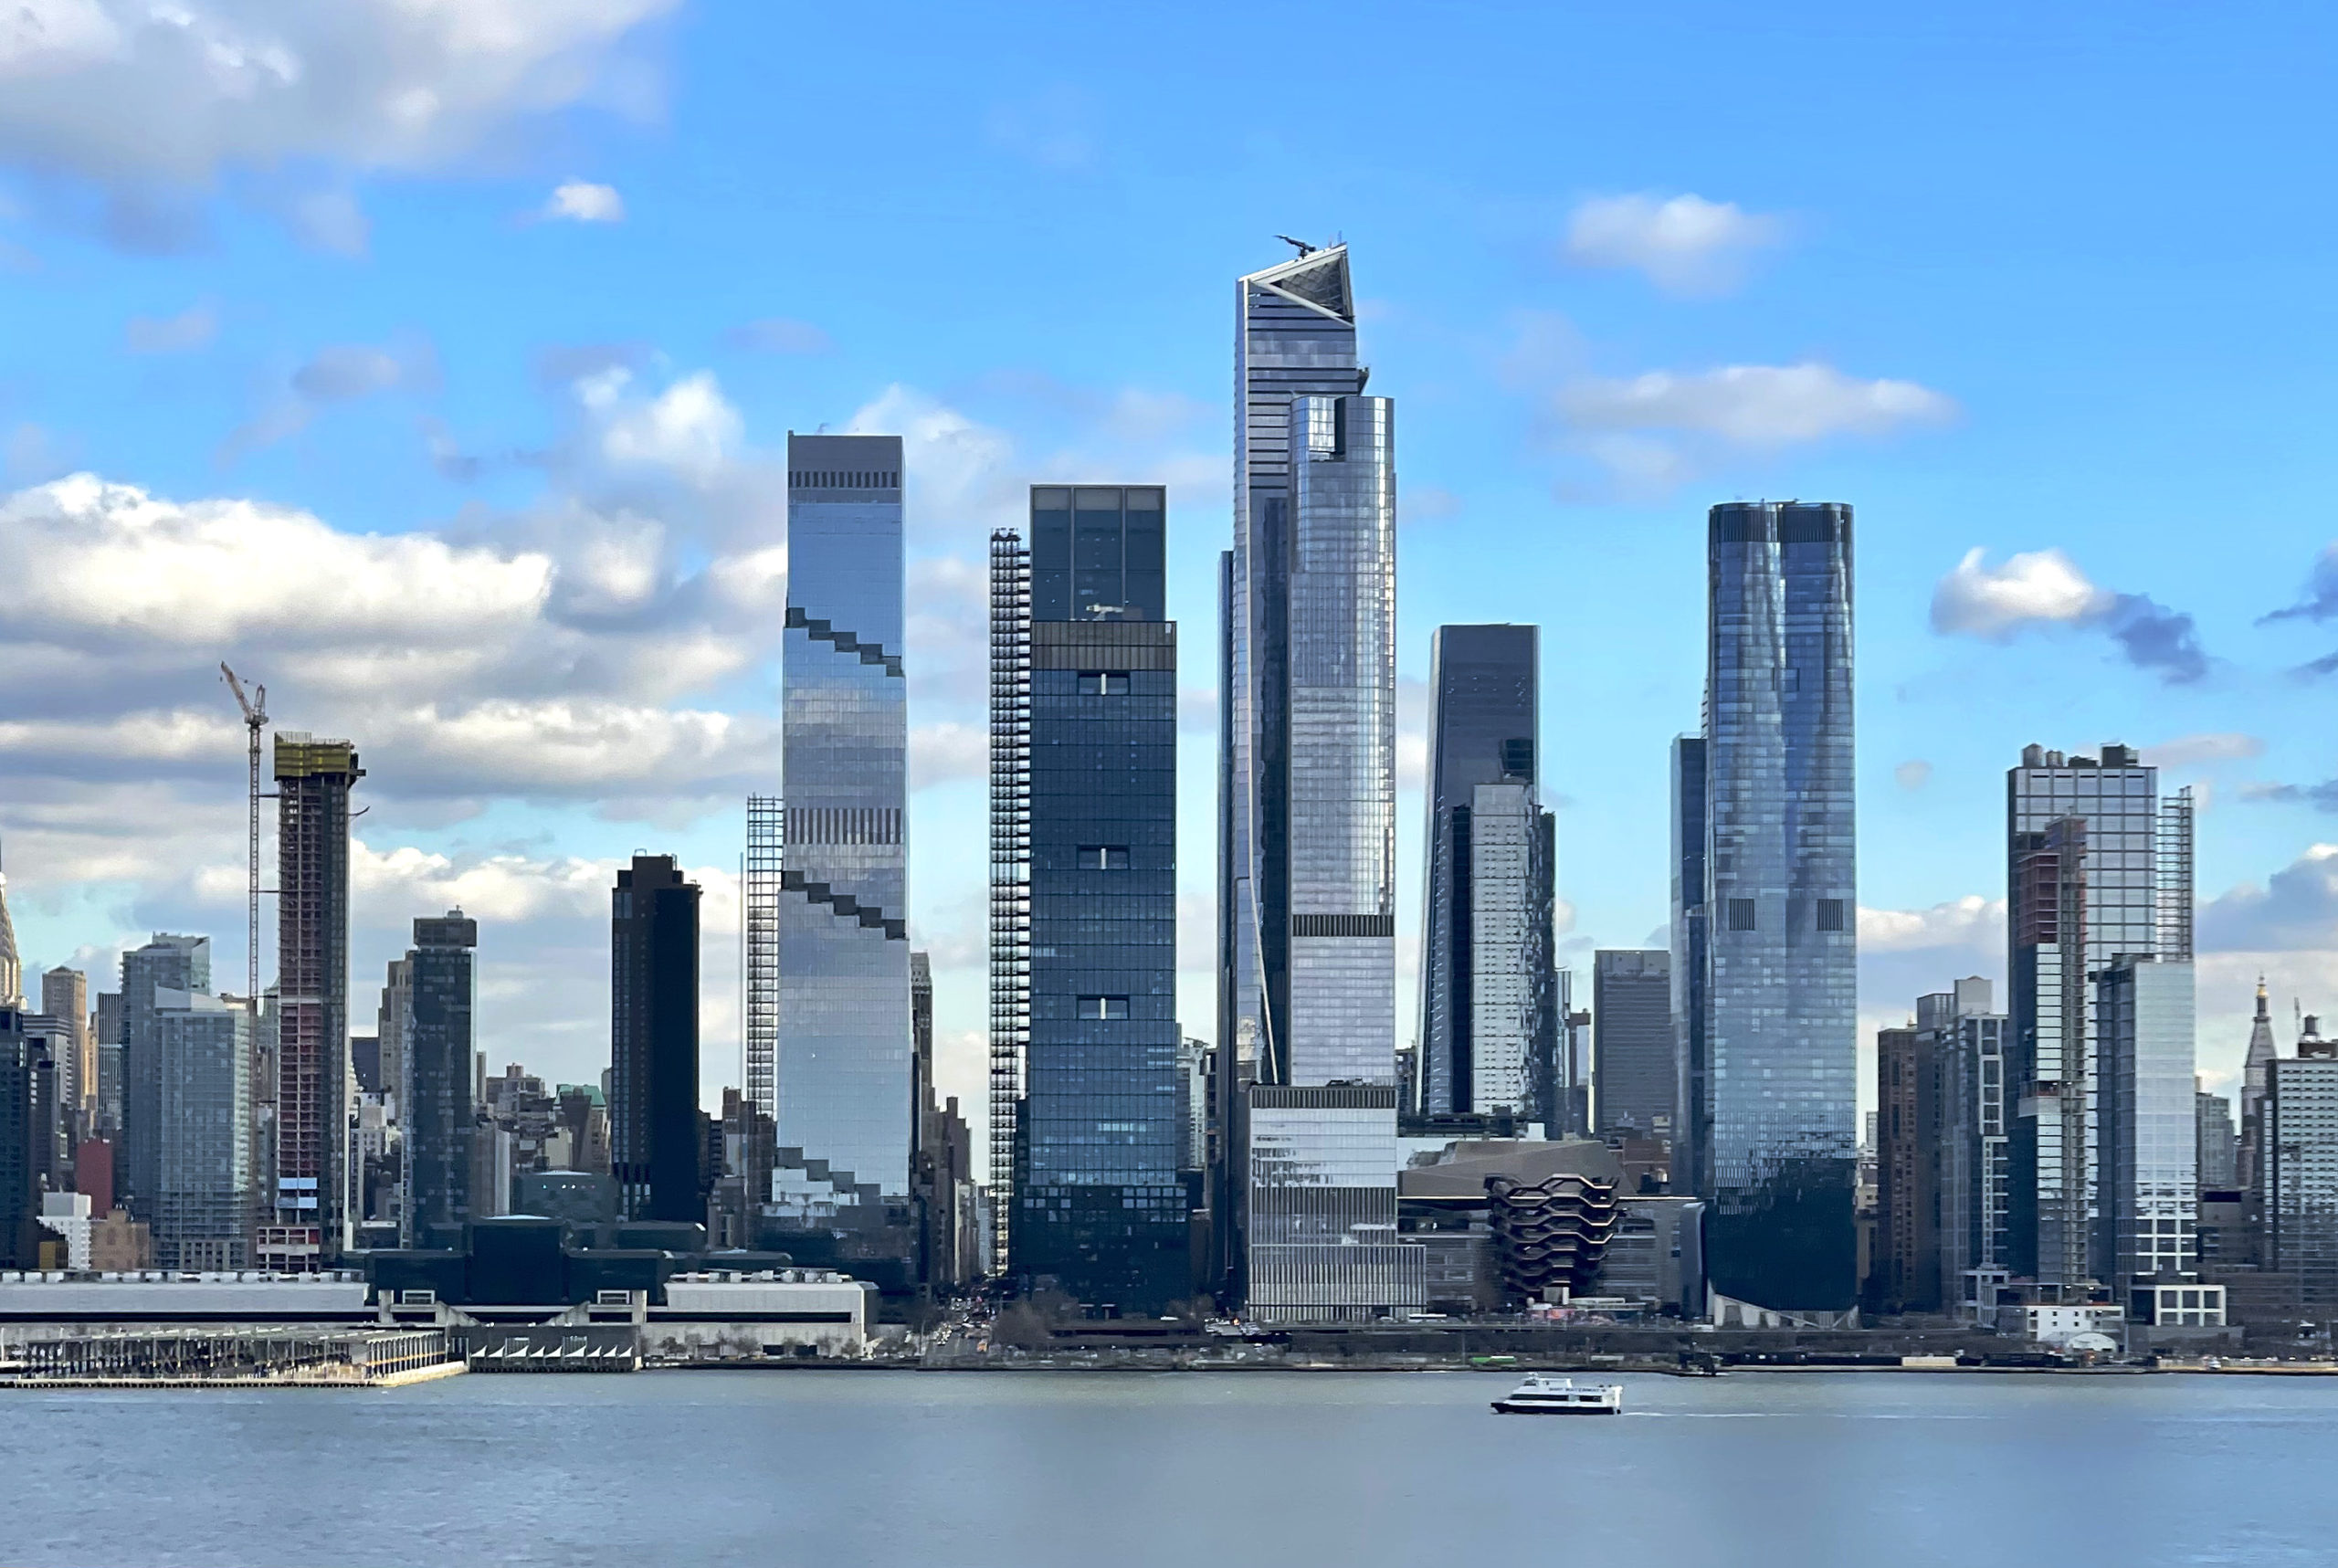
The Spiral and Hudson Yards. Photo by Michael Young
Average unit count per residential and hotel filing by borough
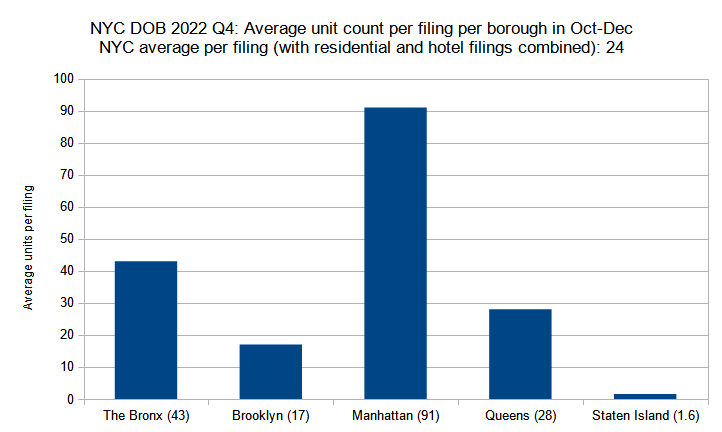
Average unit count (residential and hotel) per new construction permit per borough filed in New York City in the fourth quarter (October through December) of 2022. Data source: the NYC Department of Buildings. Data aggregation and graphics credit: Vitali Ogorodnikov
In the third quarter of 2022 we observed an unusual phenomenon where the average size of new residential and hotel building permit filings was larger in the Bronx, with an average of 31 units per residential or hotel filing, eclipsing Manhattan, where the corresponding average sat at 24.
In the fourth quarter, we saw a return to status quo; although the number for the Bronx actually increased to 43, the average for Manhattan nearly quadrupled, racing up to 91.
The numbers for Brooklyn and Queens have also increased, rising from an average of 12 each in Q3 to 17 for Brooklyn and 28 in Queens. Only Staten Island’s average of two filings per building (rounded down to 1.6 in the latest tally) has remained consistent between the quarters.

Photo by Michael Young
Permit filings by floor count category
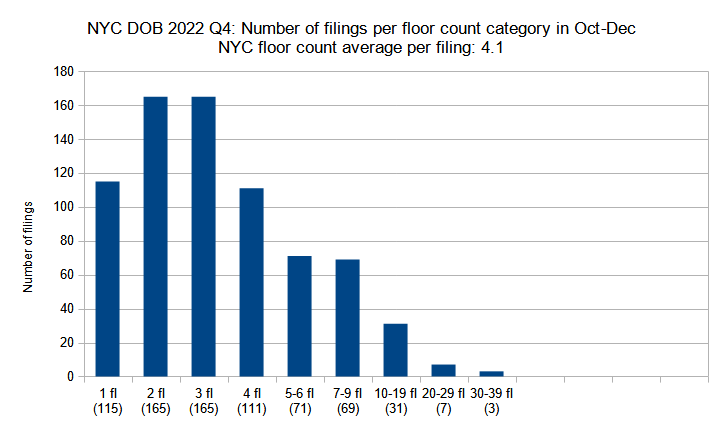
New construction permits filed in New York City in the fourth quarter (October through December) of 2022 grouped by floor count. Data source: the NYC Department of Buildings. Data aggregation and graphics credit: Vitali Ogorodnikov
Just as the average size of new residential and hotel building permit filings in the fourth quarter of 2022 increased notably, so did the average floor count, which rose considerably from 3.2 in Q3 to 4.1 in Q4. Low-rise buildings continue to dominate the filings in the fourth quarter, although the distribution shifted dramatically toward mid- and high-rise structures between the quarters.
During the period, the number of single-story filings dropped from 139 to 115; two-story filings from 204 to 165; and for three-story filings from 210 to 165, or roughly a quarter for the latter two categories.
In turn, the number of four-story filings has risen from 106 in Q3 to 115 in Q4; five- and six-story filings from 49 up to 71; and seven- through nine-story filings from 45 to 69. The high-rise category saw even greater percentages of growth, where the count of ten- to 19-story filings has increased from 13 in Q3 to 31 in Q4; filings with 20 to 29 stories from none in Q3 to seven in Q4; and filings from 30 to 39 stories from two in Q3 to three in Q4. Only in the 40-49-story category the third quarter came ahead, with a count of one filing, while the fourth quarter showed none.
Unsurprisingly, of the top buildings with the highest floor counts (three are tied for the 20th place), half are in Manhattan; the rest include seven in Queens, two in Brooklyn, and one in the Bronx. What is unexpected is that three of the six tallest (by floor count), including the number-one spot holder, are situated in Queens.
The six buildings with the highest floor counts are 3-11 26th Avenue in Hallets Point, Queens (35 stories); 80 Clarkson Street in Hudson Square/West Village in Manhattan (34 stories); 3-09 26th Avenue in Hallets Point, Queens (32 stories); 126 Lafayette Street in SoHo, Manhattan (25 stories); 514 West 36th Street in Hudson Yards, Manhattan (25 stories); and 3-01 26th Avenue in Hallets Point, Queens (24 stories).
Photo by Michael Young
Average number of floors per filing per borough
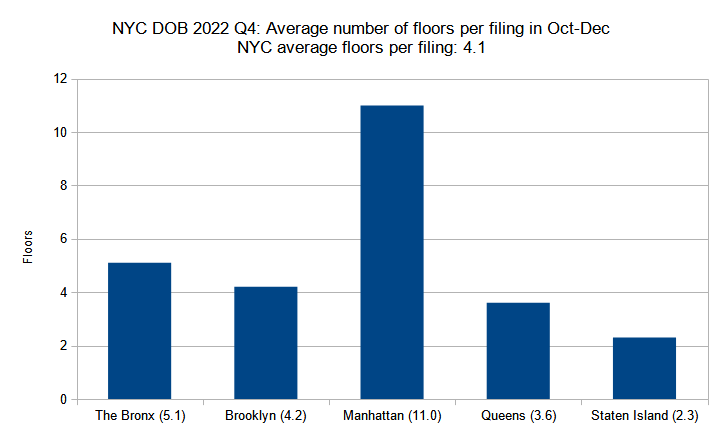
Average number of floors per new construction permit per borough filed in New York City in the fourth quarter (October through December) of 2022. Data source: the NYC Department of Buildings. Data aggregation and graphics credit: Vitali Ogorodnikov
In terms of average floor counts in the fourth quarter of 2022, the borough rates have remained largely the same, although we noted more increases than drops. Between the third and fourth quarters, the average floor count per filing rose from 4.6 to 5.1 in the Bronx, from 3.9 to 4.2 in Brooklyn, dropped from 12.4 to 11 in Manhattan, rose from 2.6 to 3.6 in Queens, and increased from 2.3 to 2.6 in Staten Island.
Curiously, the filings with the highest floor counts in each borough are situated quite far from its skyline focal point or expected point of growth. At 15 stories, 1298 Inwood Avenue in the Bronx’s Mount Eden is nestled in the western highlands quite far from either the Yankee Stadium area or the skyline rising in Mott Haven. At 23 stories, 3017 West 21st Street in Coney Island, Brooklyn will rise on the opposite side of the borough from the skyscraper district in Downtown Brooklyn.
80 Clarkson Street in Hudson Square/West Village in Manhattan will rise 34 stories, not in the Financial District nor in Midtown. Rising 35 stories, 3-11 26th Avenue in Hallets Point, Queens is situated almost two miles north of the skyline core in Long Island City.
Even 655 Chelsea Road in Staten Island at four stories, though not a tall building by any means, will rise in Travis-Chelsea just off the Arthur Kill on the island’s western shore, near the Fresh Kills landfill. It is located quite far from where one would expect any notable development, let alone the borough’s tallest for the quarter, to take place.
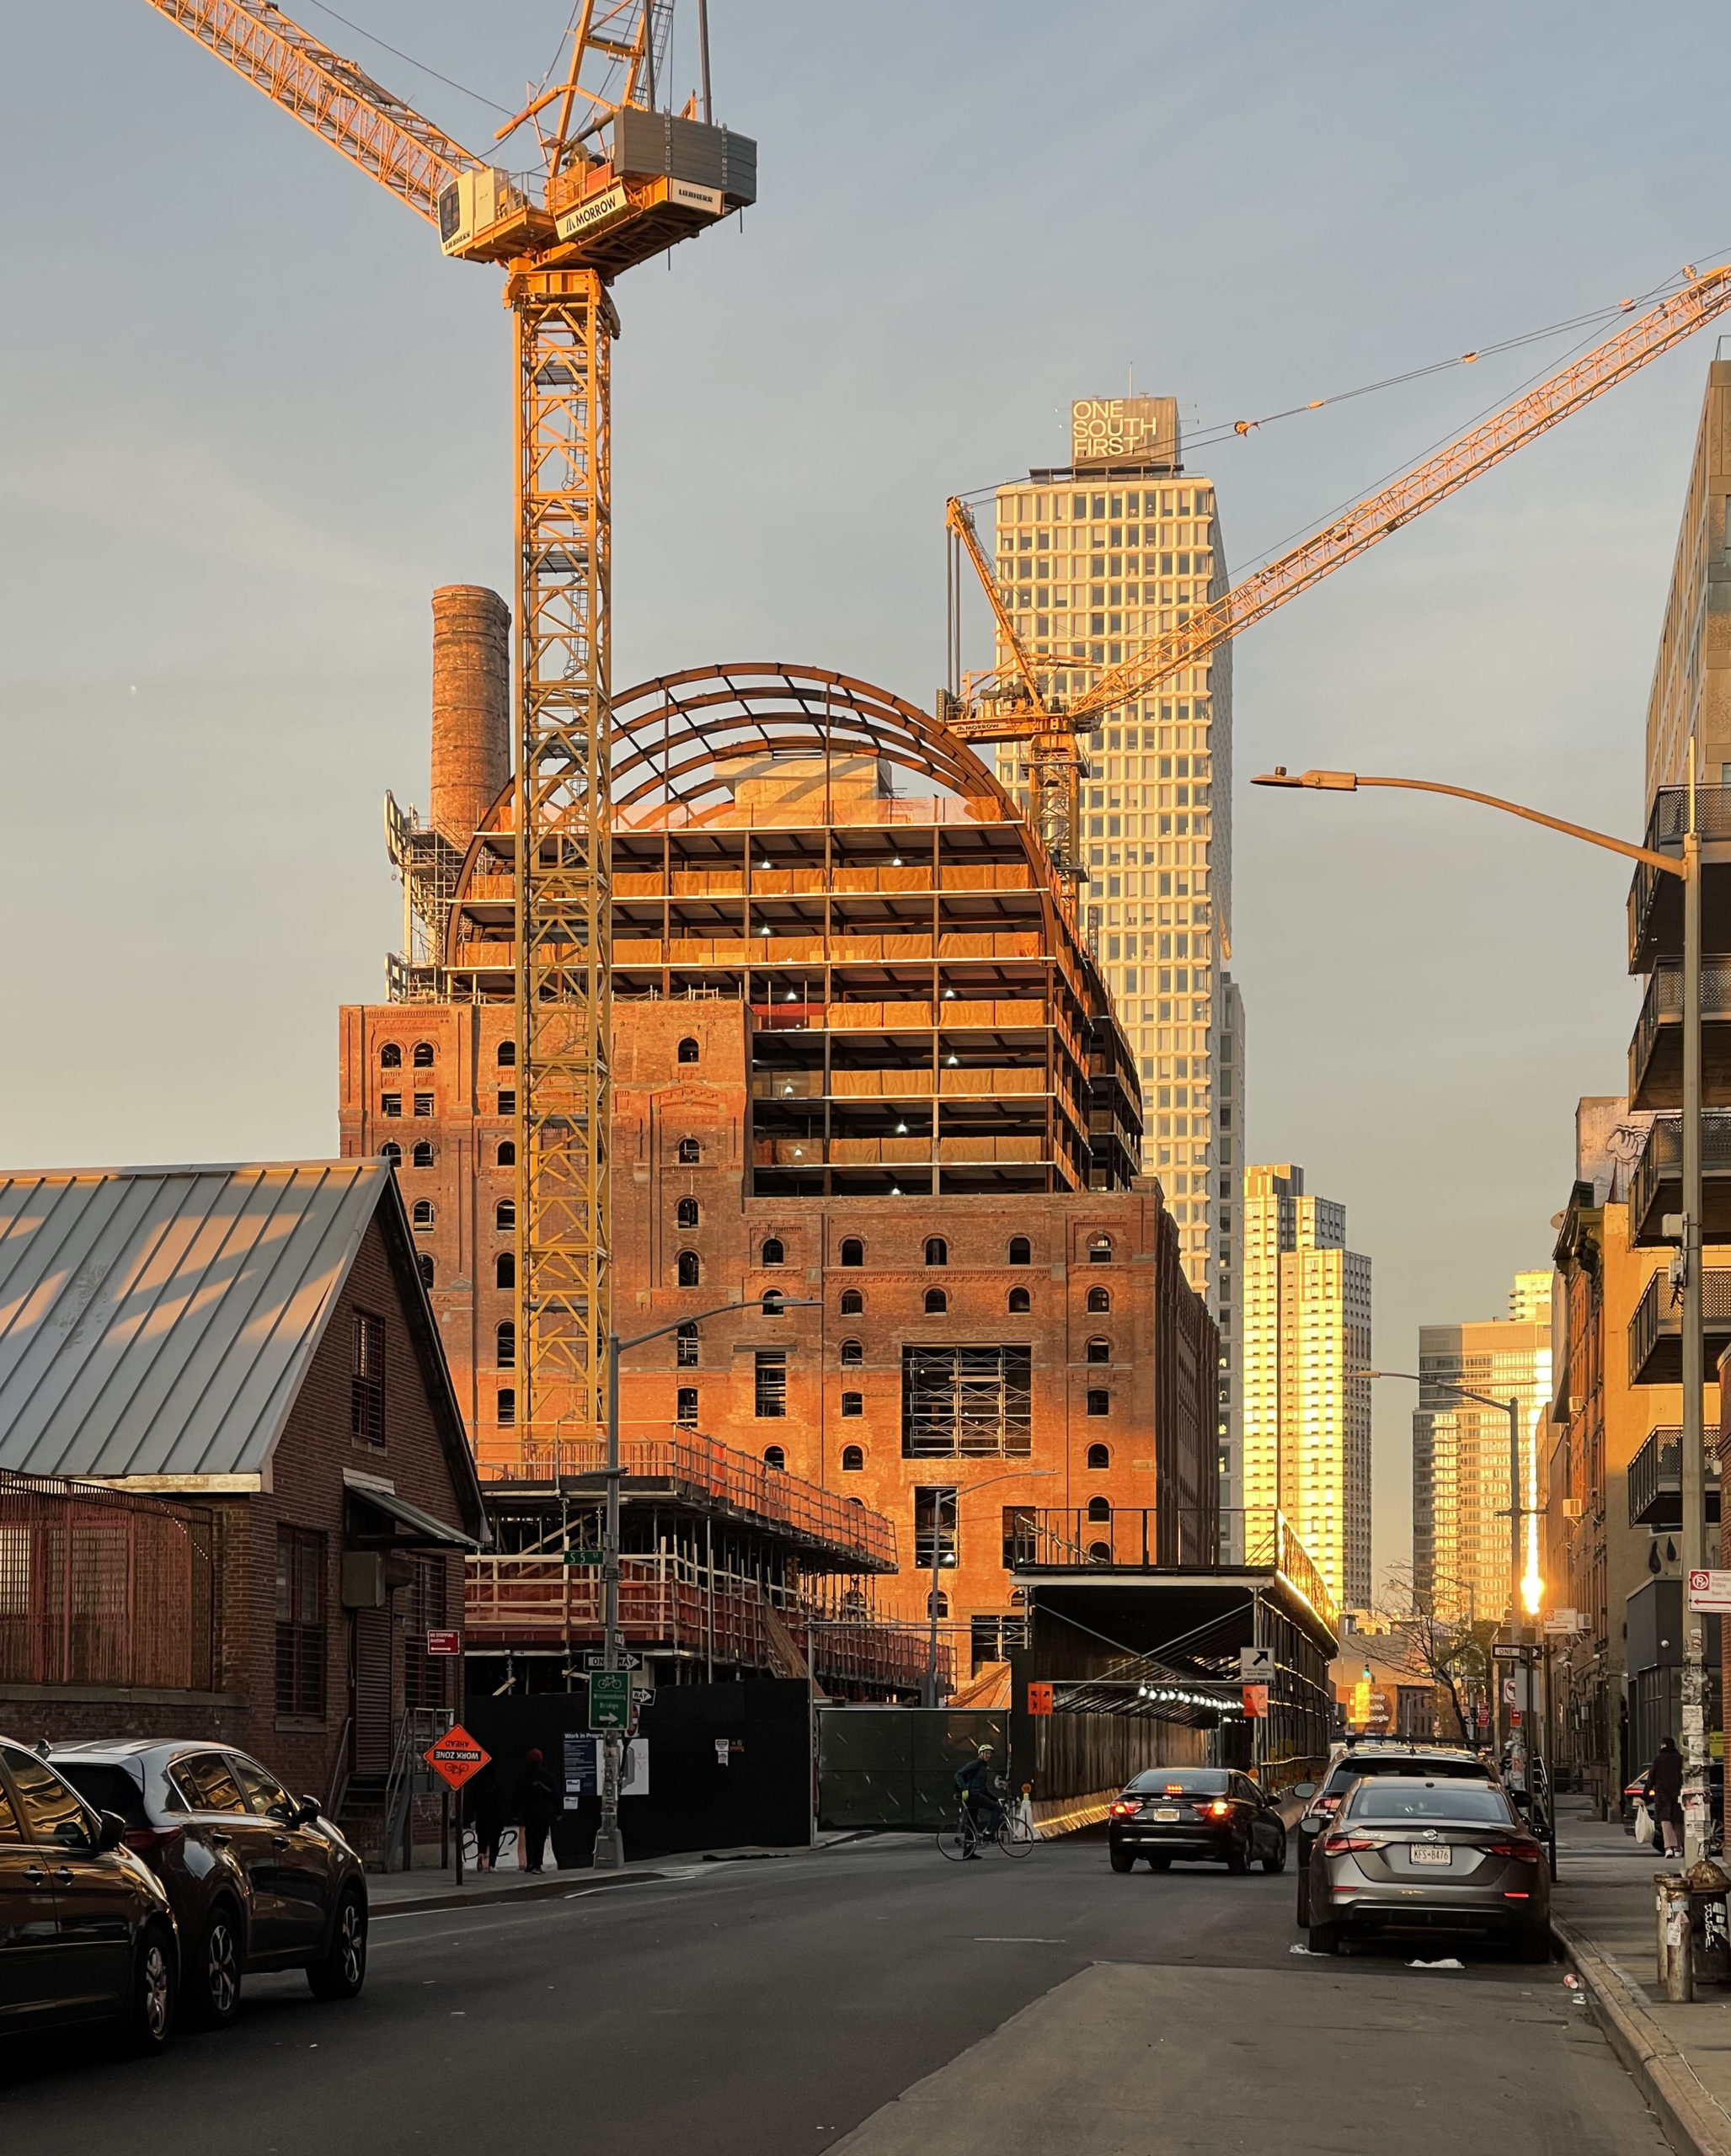
The Refinery at 292 Kent Avenue. Photo by Michael Young
Total floor area filed by borough
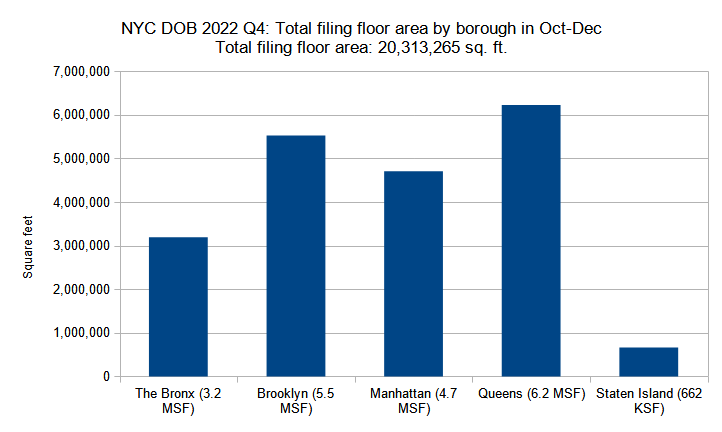
Combined floor area of new construction permits filed per borough in New York City in the fourth quarter (October through December) of 2022. Data source: the NYC Department of Buildings. Data aggregation and graphics credit: Vitali Ogorodnikov
The total square footage for new building permit filings effectively doubled between the third and fourth quarter of 2022, surging from 10.6 million square feet in Q3 to 20.3 million square feet in Q4. As such, every borough saw multi-million square footage increases between the two quarters.
For the Bronx, the total square footage filed for between the two quarters has increased from 1.7 million square feet in Q3 to 3.2 million square feet in Q4; for Brooklyn from 2.9 million square feet in Q3 to 5.5 million square feet in Q4; for Manhattan from 1.6 million square feet in Q3 to 4.7 million square feet in Q4; for Queens from 3.6 million square feet in Q3 to 6.2 million square feet in Q4. Only Staten Island’s square footage remained similar, sliding from 685 million square feet in Q3 down to 662 million square feet in Q4.
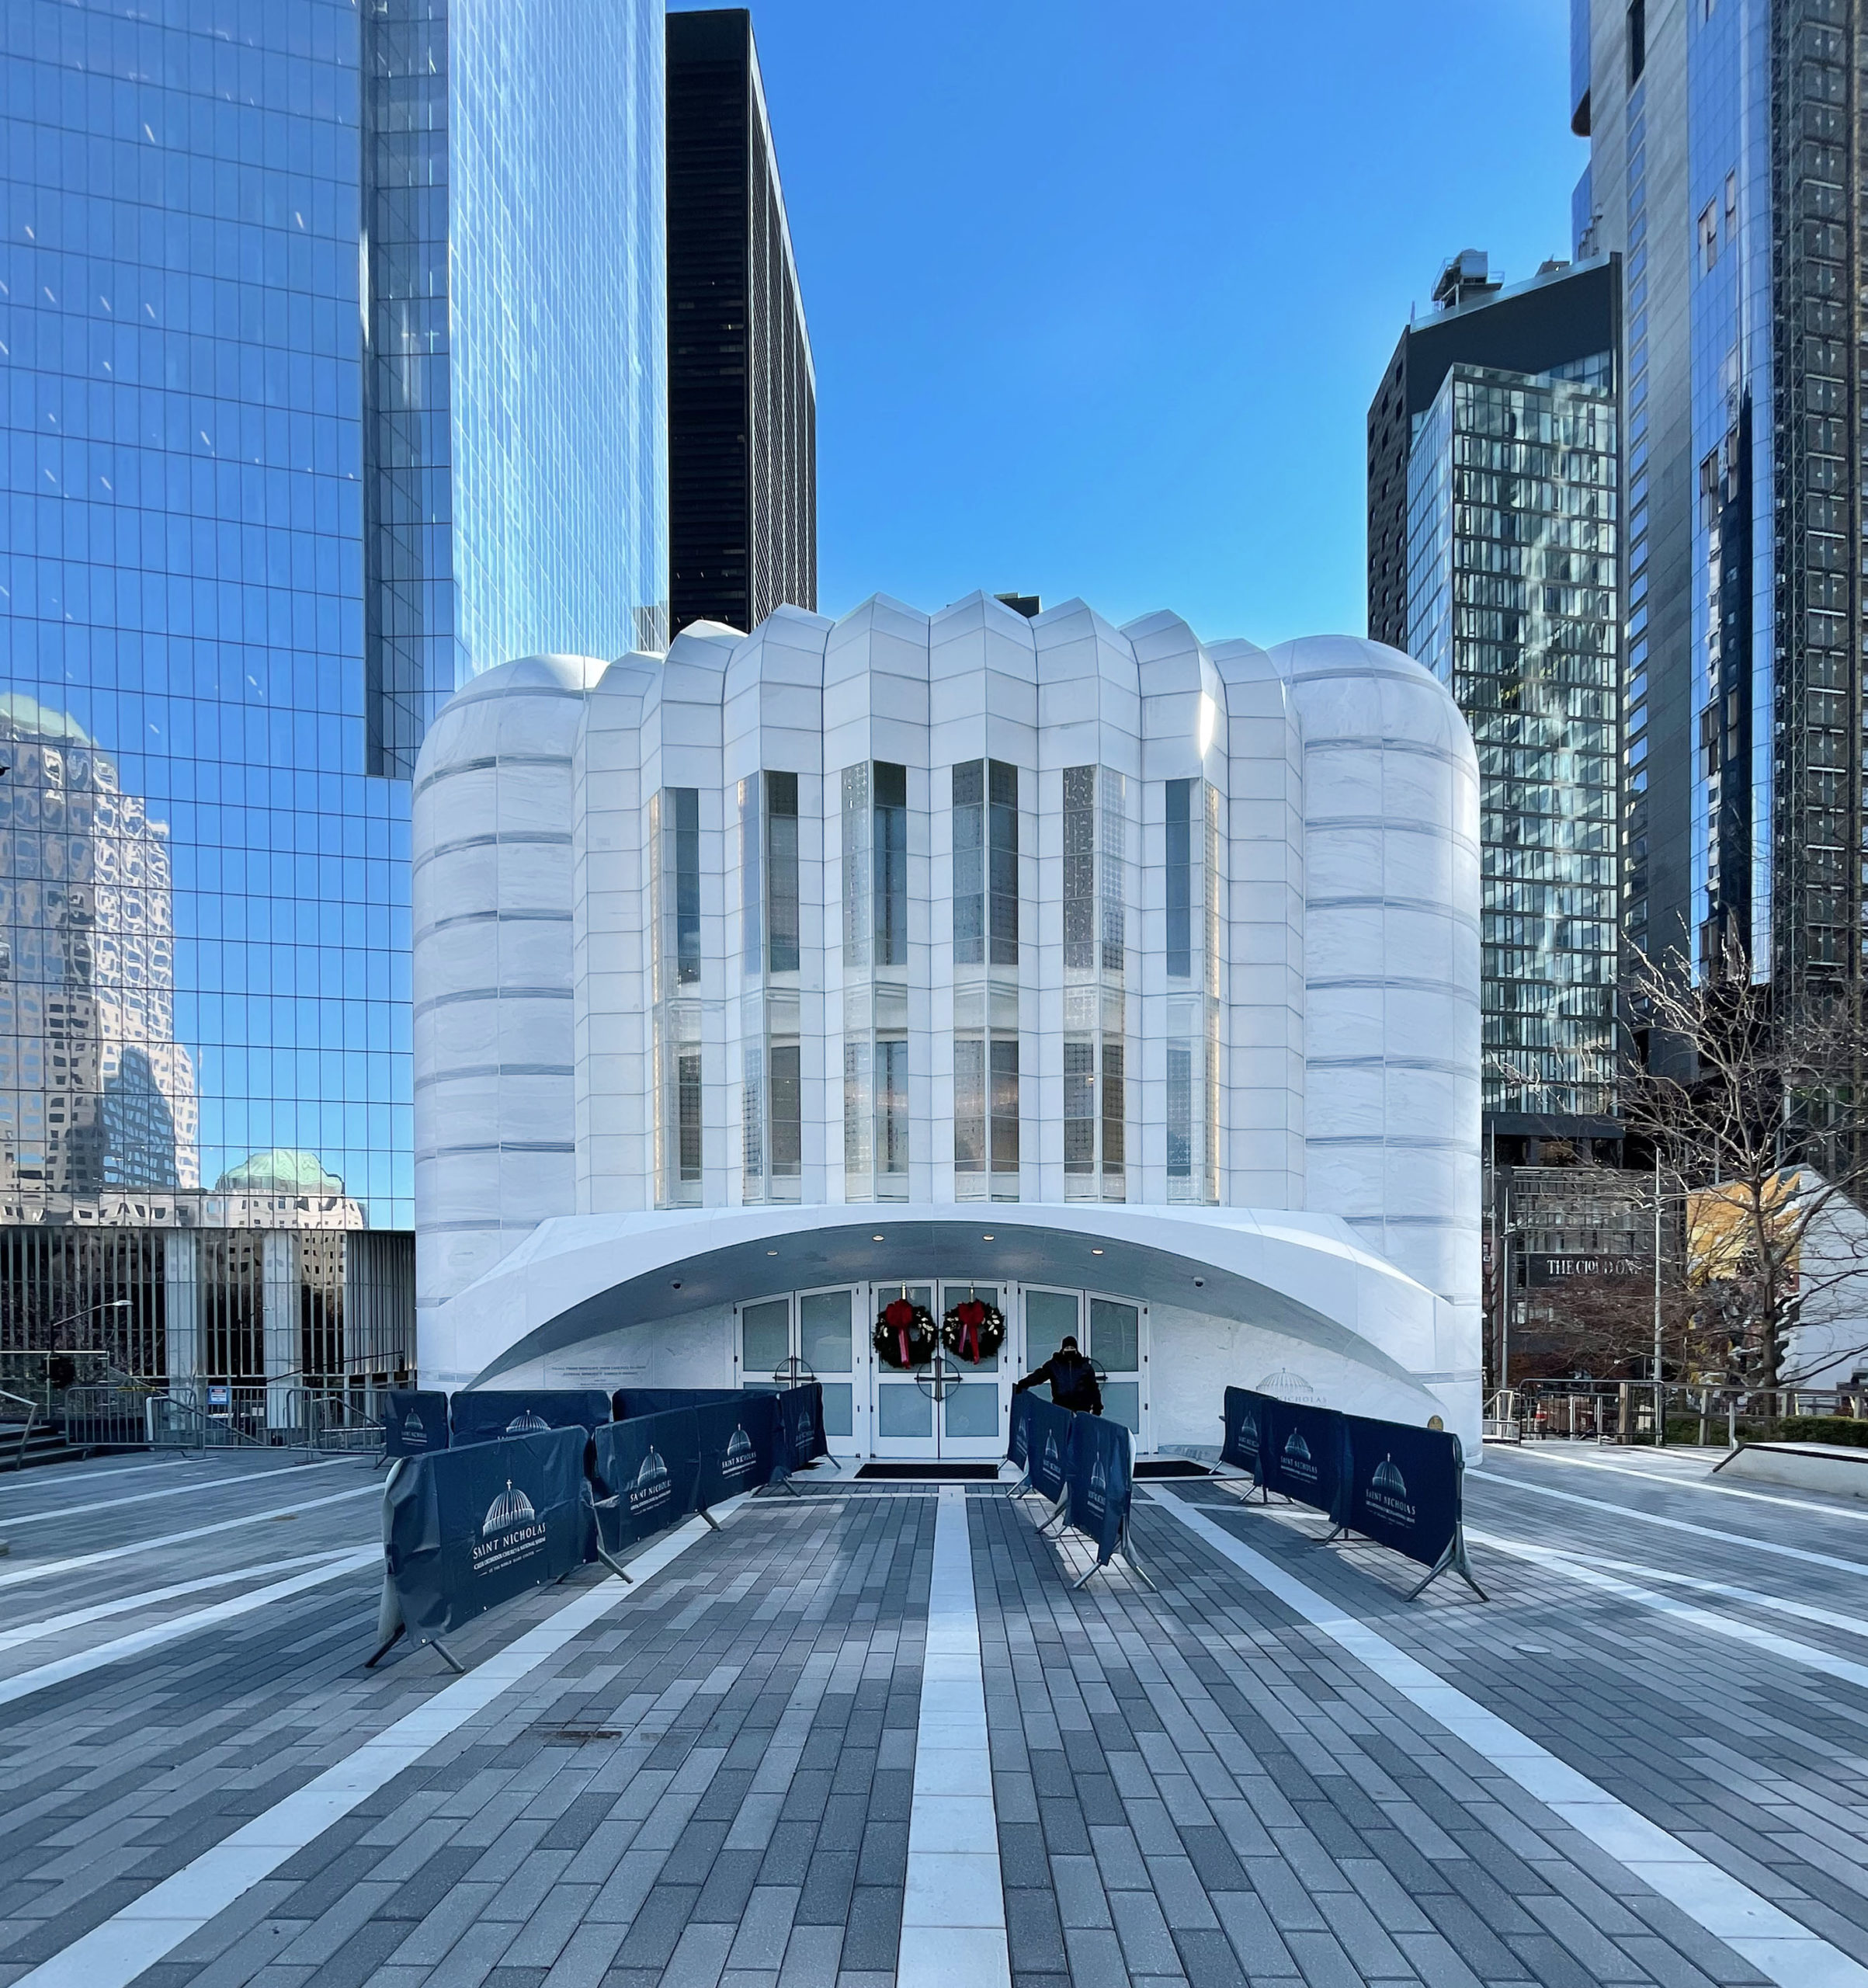
St. Nicholas Greek Orthodox Church. Photo by Michael Young
Average floor area per permit filing by borough
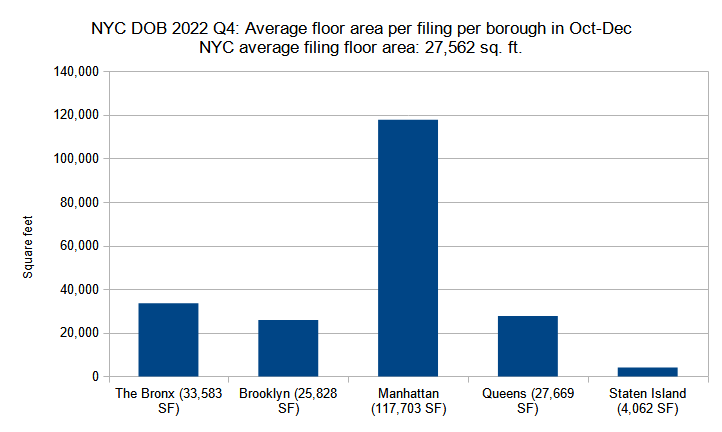
Average floor area per new construction permit per borough filed in New York City in the fourth quarter (October through December) of 2022. Data source: the NYC Department of Buildings. Data aggregation and graphics credit: Vitali Ogorodnikov
In terms of the square footage of the average new building filing between the third and the fourth quarters of 2022, Manhattan remained an absolute leader, with an average that once again eclipses those of the rest of the boroughs combined. Its average square footage per filing has remained very similar, rising from 115,744 in Q3 to 117,703 in Q4. This area is roughly equivalent to a building with 115 to 150 apartments.
By contrast, although still much smaller as a whole, the rest of the boroughs saw considerable increases in averages. Between the two quarters, the figure for the Bronx rose from 21,860 to 33,583 square feet; for Brooklyn from 15,048 to 25,828 square feet; for Queens from 13,640 to 27,669 square feet; and for Staten Island from 3,156 square feet in Q3 to 4,062 square feet in Q4, where most filings account for single- to two-family homes and garages.

The Diagrid Club. Photo by Michael Young
Permits listed by floor area per filing
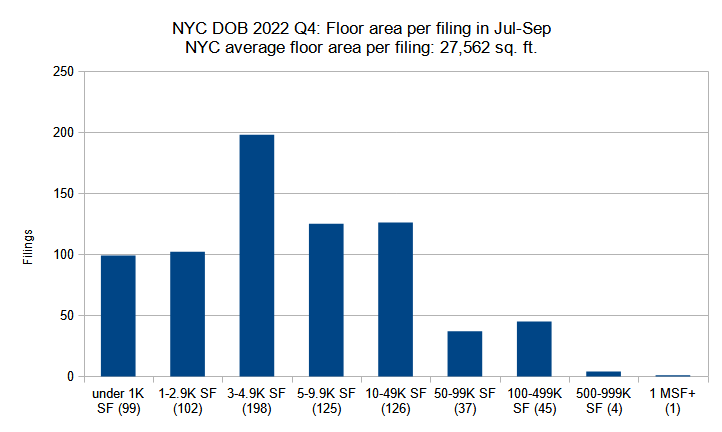
New construction permits filed in New York City in the fourth quarter (October through December) of 2022 grouped by total floor area. Data source: the NYC Department of Buildings. Data aggregation and graphics credit: Vitali Ogorodnikov
In an earlier chart, we illustrated how the floor and unit counts for average new building filings between the third and the fourth quarters of 2022 have dropped for the smaller-scale categories and risen for their larger-scale counterparts. The principle generally remains true for our third chart of the type, which tallies new building filings by square footage.
Between the third and fourth quarters, the total filing counts have dropped for buildings measuring under 10,000 square feet (although the count has remained very similar in the 3,000- to 5,000-square-foot category, still the largest in either quarter), and risen in every category of 10,000 square feet and above. After failing to chart in the third quarter, the category with buildings measuring 1,000 square feet and above has again appeared, with a single entry.
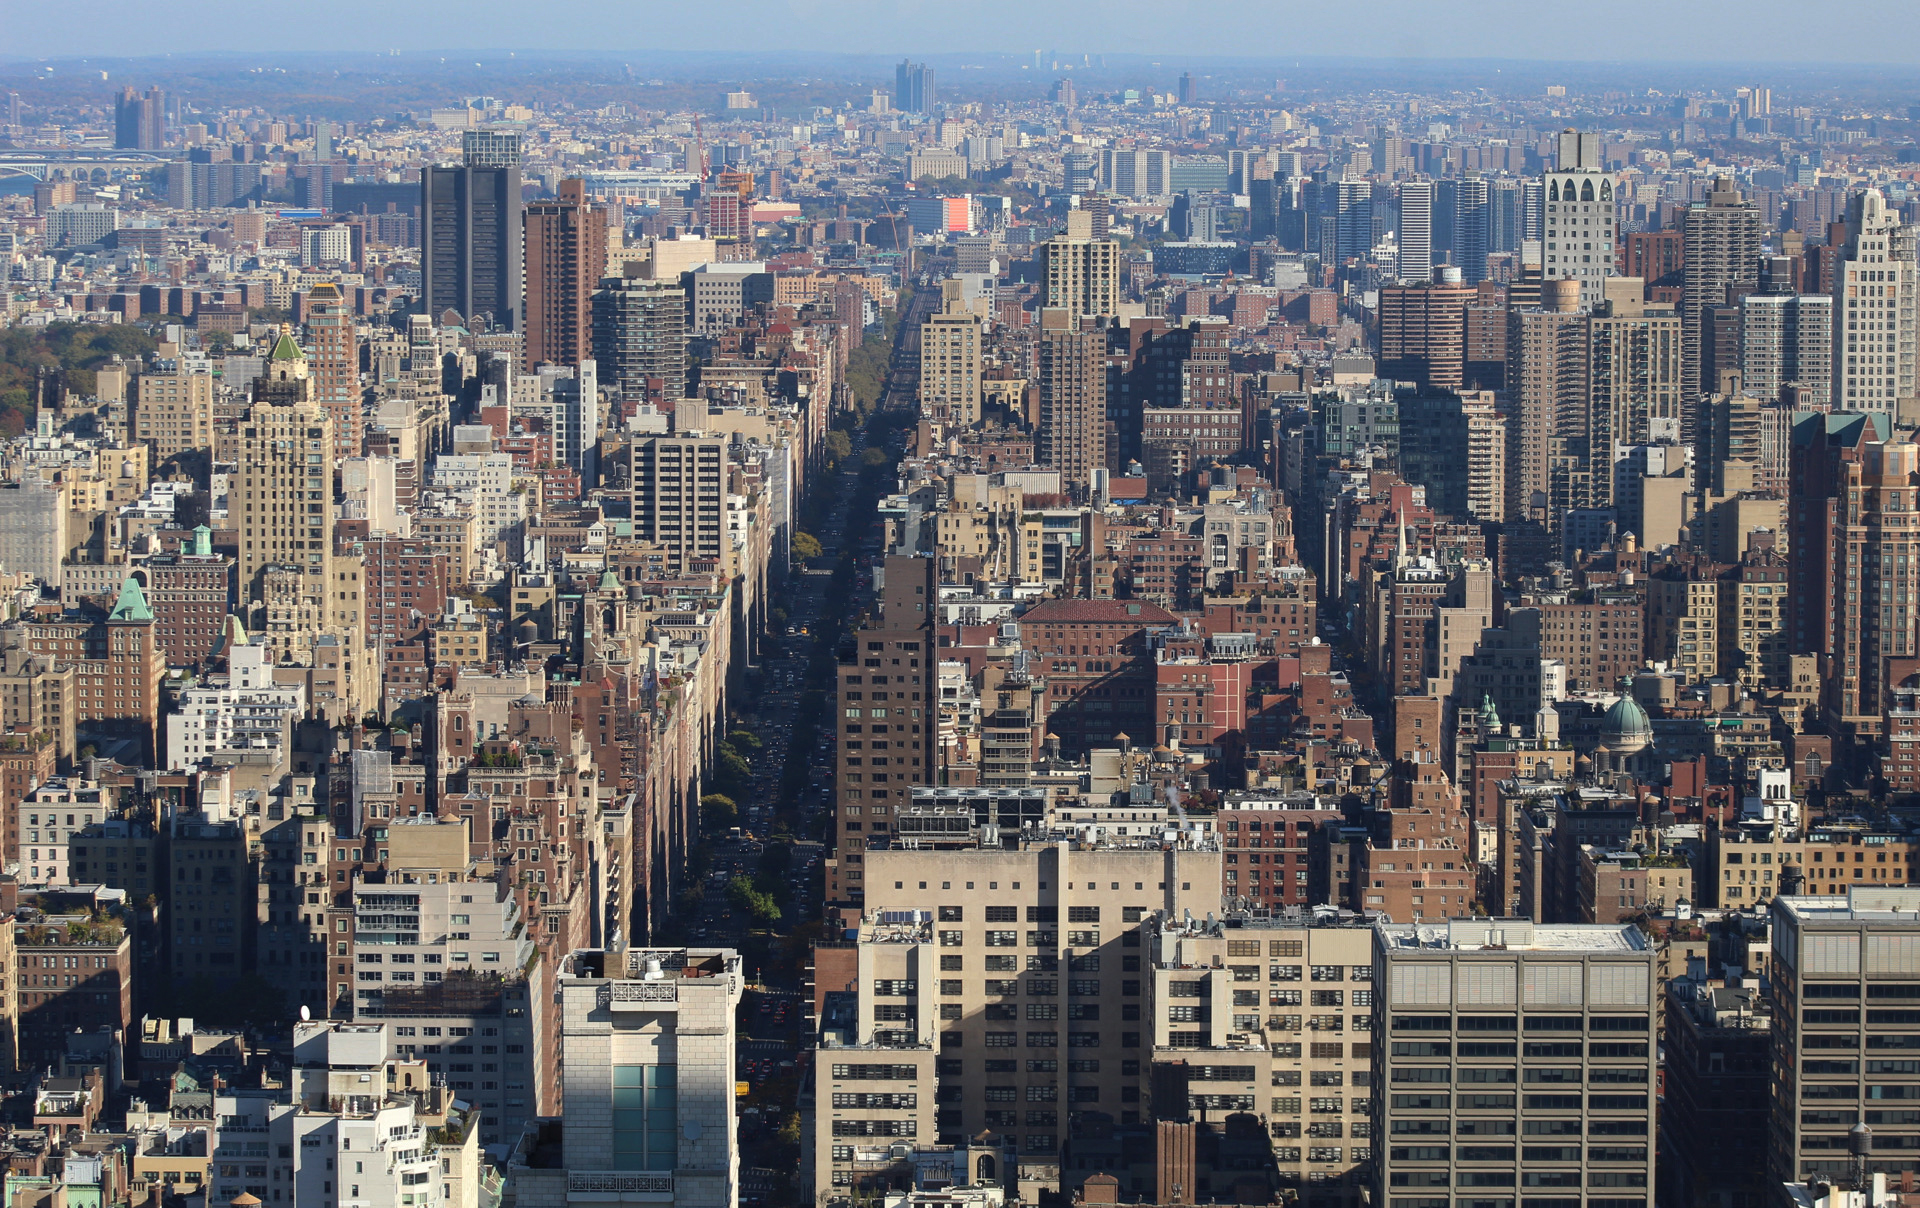
Photo by Michael Young
Subscribe to YIMBY’s daily e-mail
![]()
Follow YIMBYgram for real-time photo updates
Like YIMBY on Facebook
Follow YIMBY’s Twitter for the latest in YIMBYnews
Impressive, especially given the expiration of 421-a.
It’s simply not enough new housing. There is a housing crisis in the City right now as people move back from the pandemic. Greedy landlords are doubling the rent in many cases. There are thousands of apartments that should be legally rent stabilized but aren’t because many renters are unaware of the law their landlord violates.
There are so many housing issues that our city leaders refuse to address because it’s easier to do nothing.
I think the “doubling of rent” story is usually an exaggerated instance due to people who took advantage of rent reductions resulting from vacancies in 2020. Those who maintained their apartments in Manhattan throughout the pandemic and did not see a significant rent reduction are seeing increases in line with inflation (read: ~5-10%).
People who moved from eastern Queens to Manhattan in 2020 due to asking rents which were 30% below pre-pandemic era levels are now seeing the rubber band adjustment and calling foul.
I am not trying to imply that there are not greedy landlords out there, but rather that the last few years has been extremely volatile; both with rental demand and building operating costs. Both of these have strong impacts to overall rent levels. I suspect the latter issue is only going to get worse as Local Law 97 really comes into force over the next couple of years.
Re. Michael Young’s great view looking SW down Park Avenue (the 5th image): Amazing progress on the steel at J. Morgan Chase’s incredible supertall at 270! Looking forward to your next overview of the same. Thank you!