
New construction permit numbers are in for the fourth quarter of 2023, and the figures are encouraging. From October through December, New York’s developers filed permits for 1,521 new buildings, the highest quarterly tally for the 2020s decade so far. The figure represents a 54-percent increase from the third-quarter permit count of 986. The total filed for floor area also increased significantly, rising from 18.3 million square feet in Q3 to 23.1 million square feet in Q4 (a 26-percent increase), as did the number of filed for residential and hotel units, which grew from 14,010 in Q3 to 16,396 in Q4 (a 17-percent increase). The charts and analyses below offer a detailed breakdown of the fourth quarter’s permit filings. The full list of quarterly filings, with detailed information on every project, is available with a subscription to YIMBY’s Building Wire.
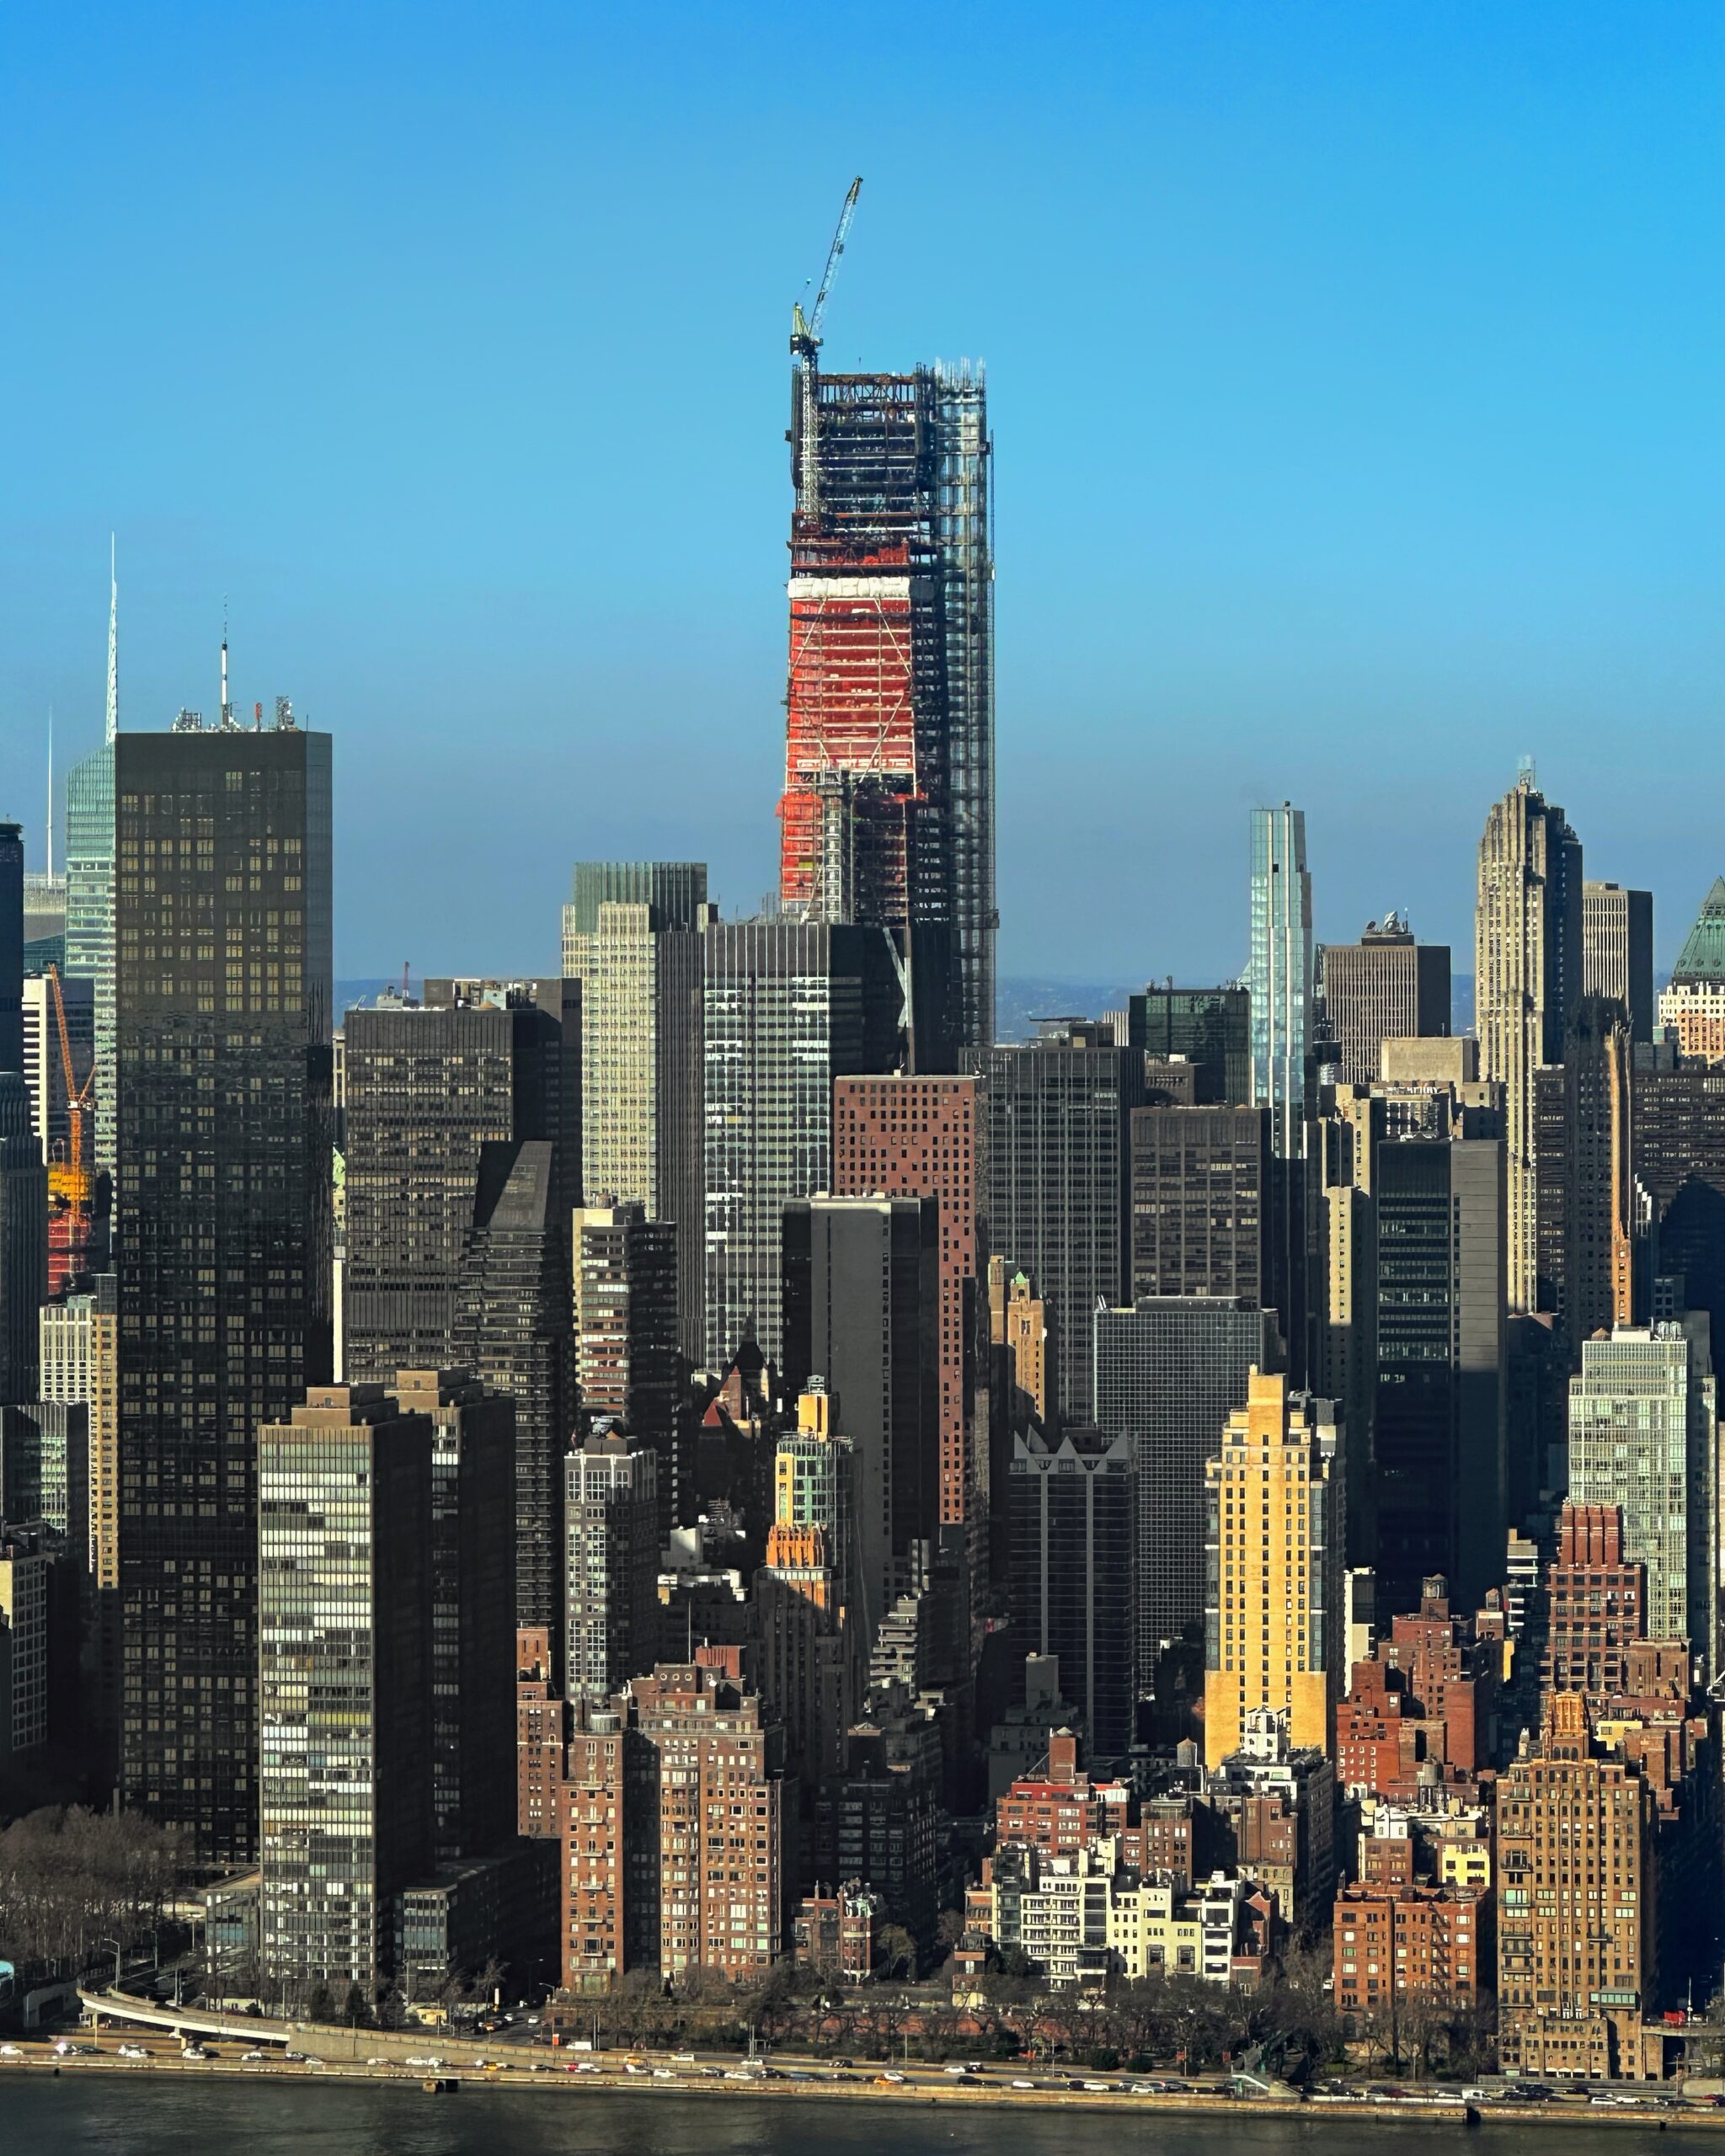
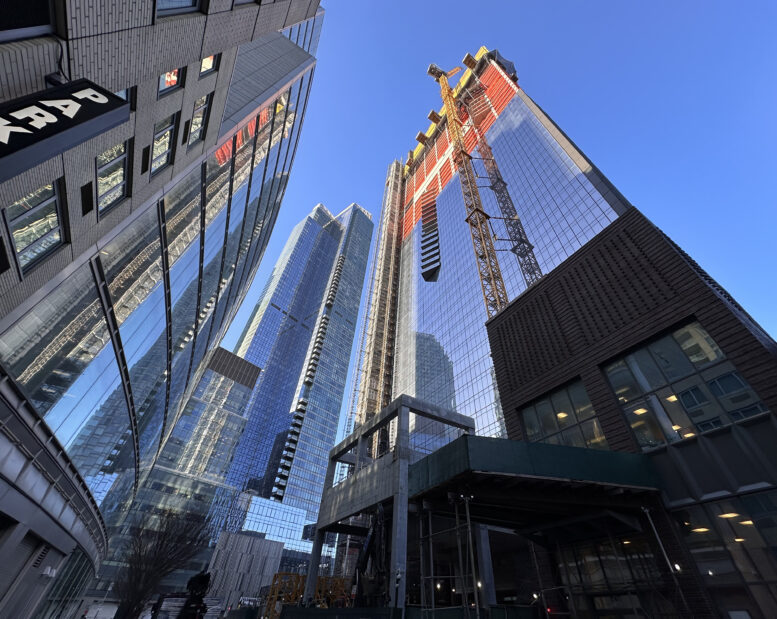
Photo by Michael Young
Number of permit filings per month
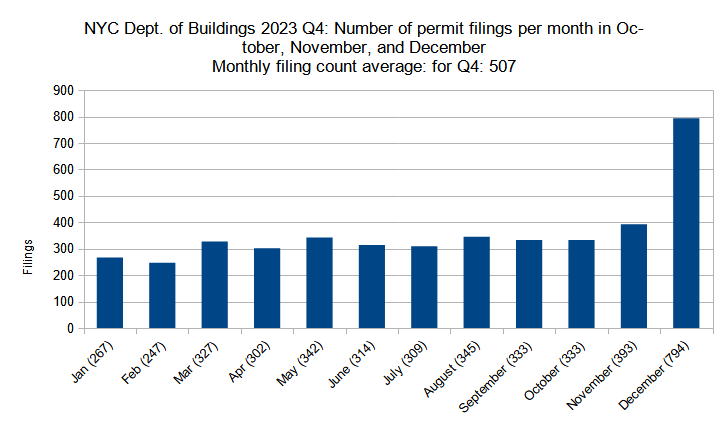
Number of new construction permits filed per month in New York City in Q1 through Q4 (January through December) 2023. Data source: the Department of Buildings. Data aggregation and graphics credit: Vitali Ogorodnikov
Since YIMBY began tracking permit filing counts in 2020, monthly figures have seen a gradual upward trend. Monthly permit filing counts rose from 148 in 2020 to 168 in 2021 and 269 in 2022. In the third quarter of 2023, August set the decade’s monthly record with 345 permit filings, only to be beat by unprecedented figures in the fourth quarter. November saw the filing of 393 new building permits, surpassing the August total by nearly 50. December, however, more than doubled the previous figure with an incredible total of 794 filings, by far the largest monthly increase during the 2020s so far both in terms of relative and absolute numbers.
In all, the 1,521 new building permits filed in the fourth quarter of 2023 represent an approximate doubling of standard quarterly figures for the 2020s and almost match the entire total of 1,774 filings in 2020. Moreover, the year’s monthly figures continue to display a long-sustained upward trend, which remains highly promising for the city’s construction industry whether or not the record-setting December figure will be sustained in the coming months.
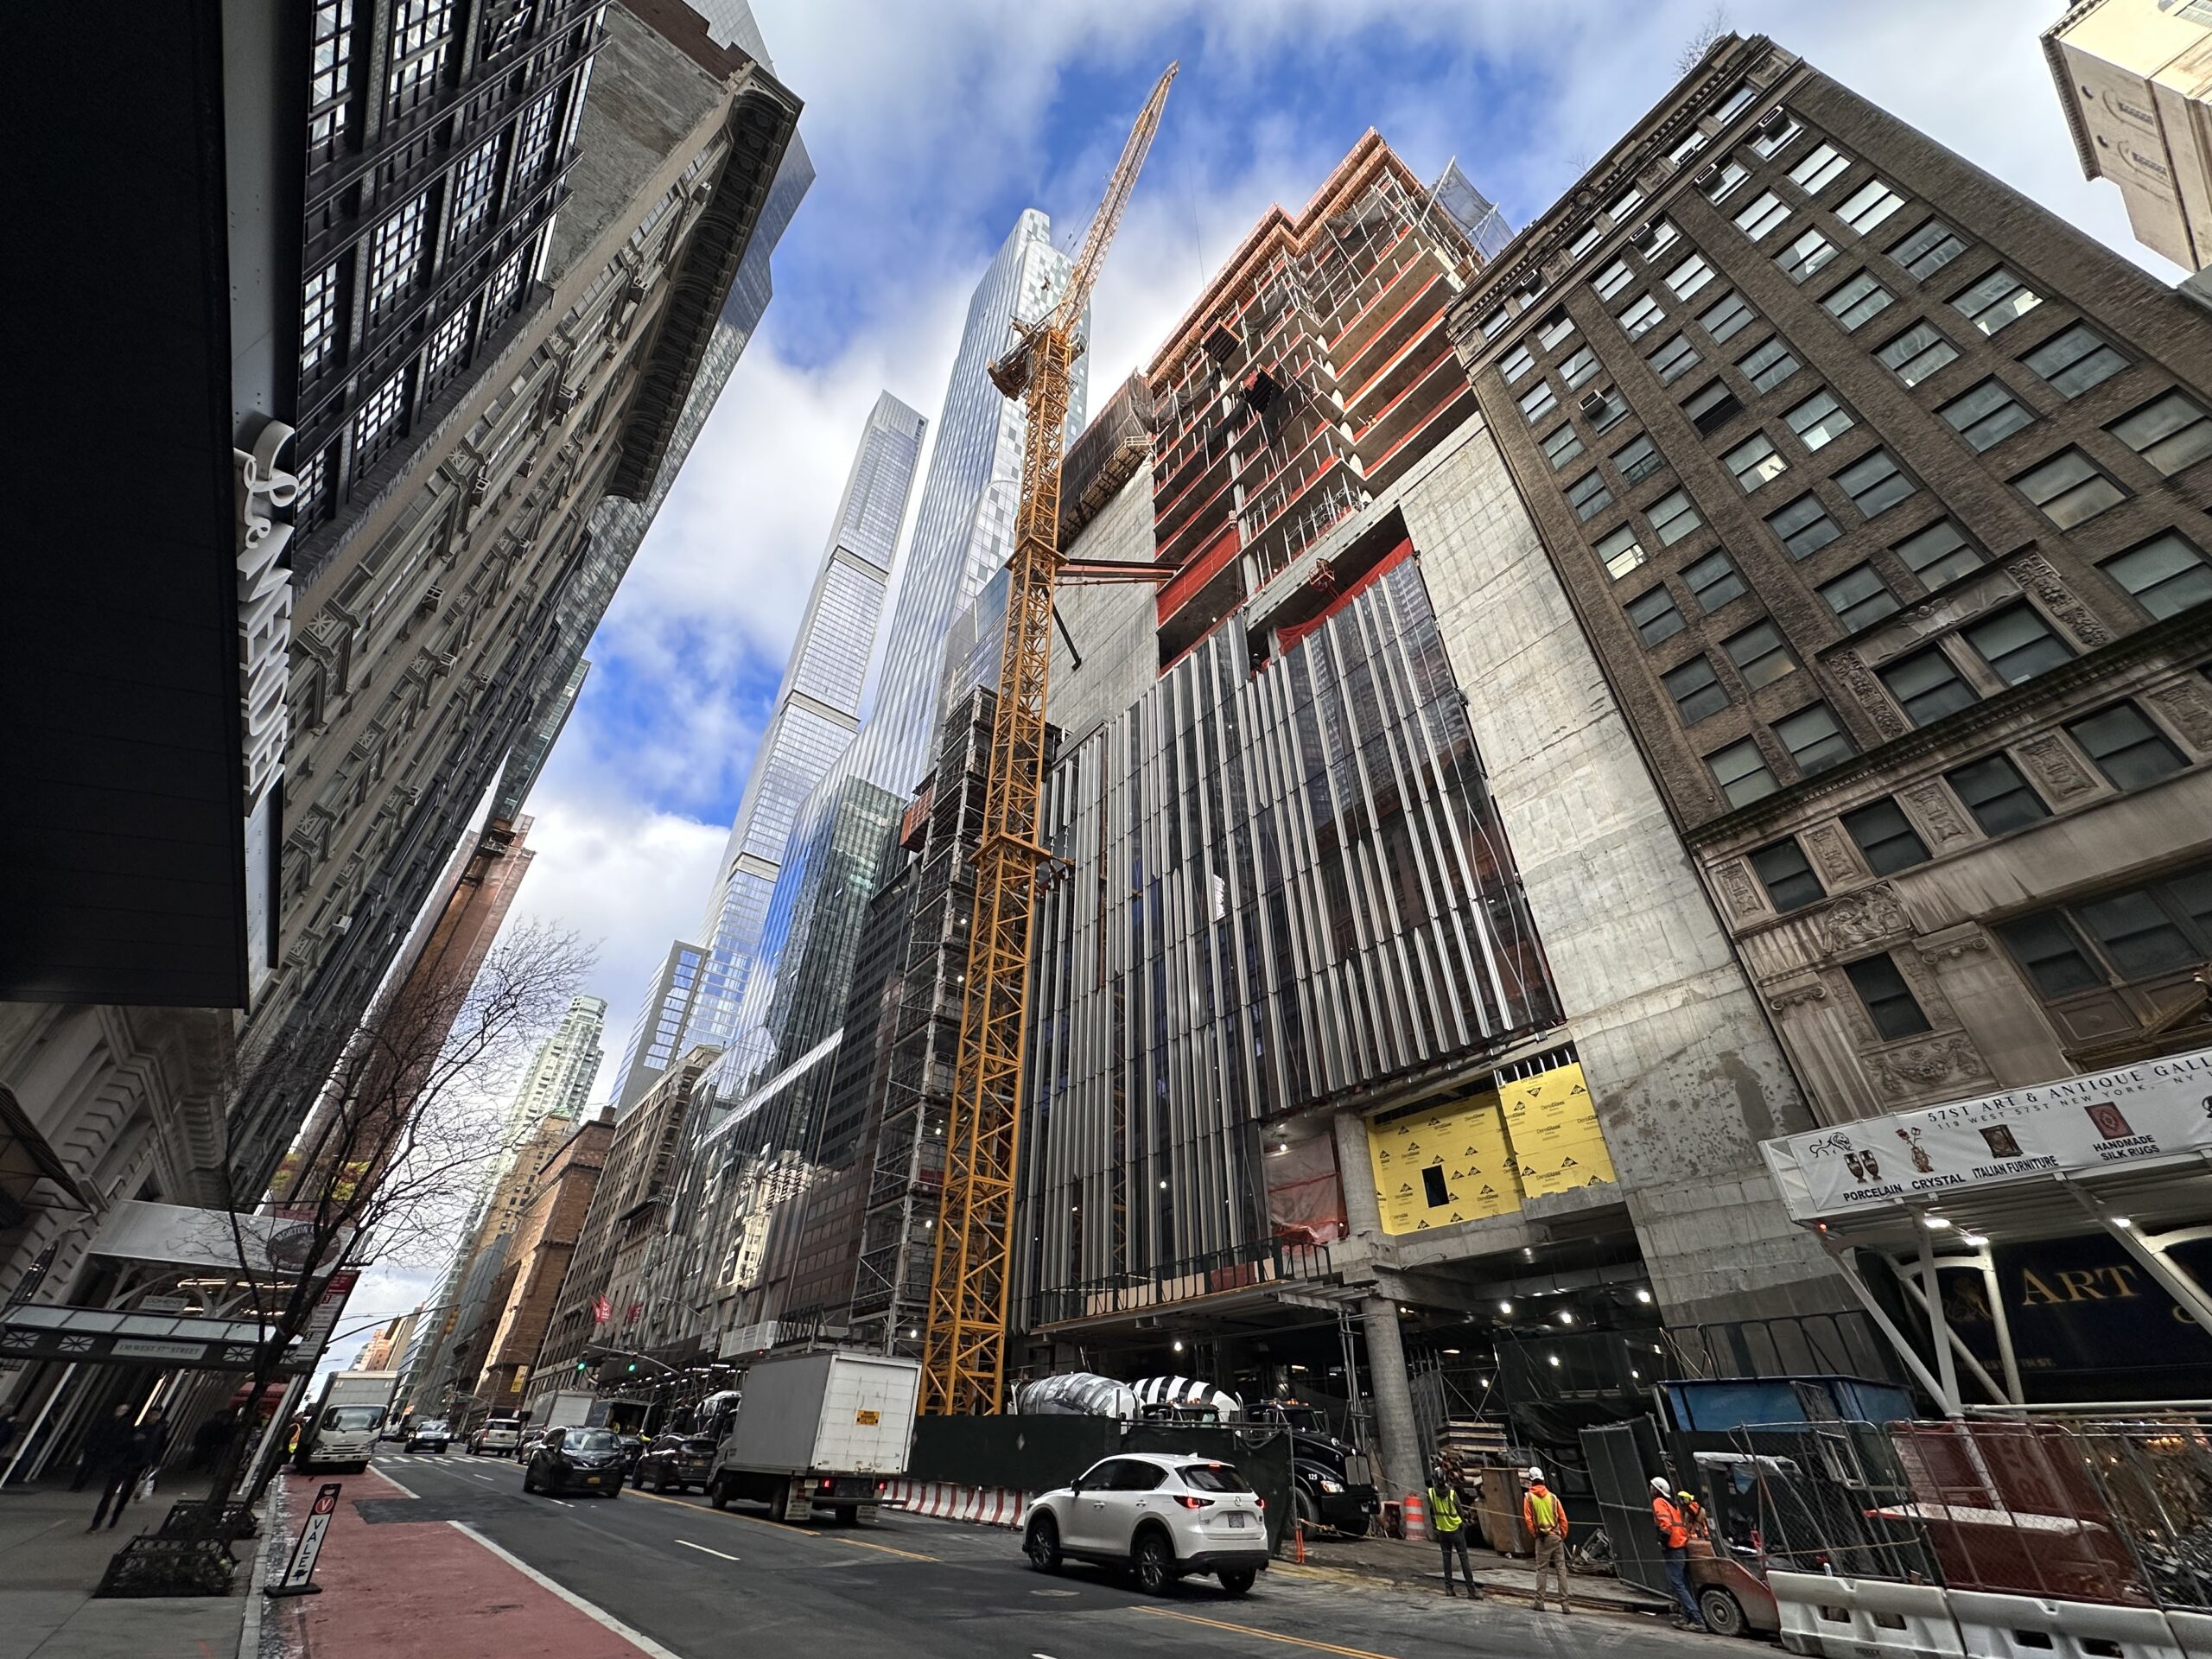
Photo by Michael Young
Number of permit filings by borough
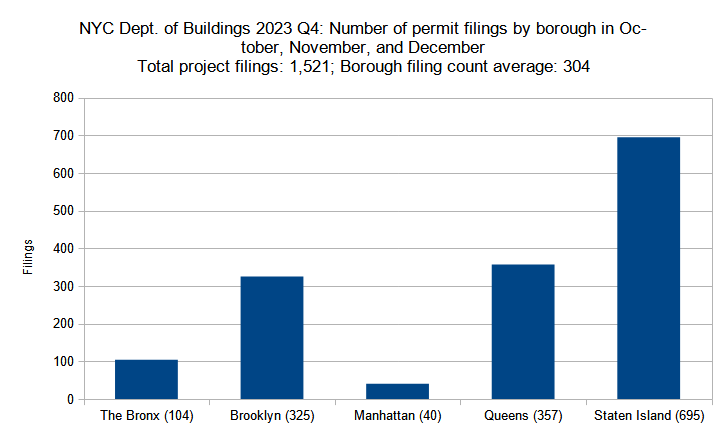
Number of new construction permits filed per borough in New York City in Q4 (October through December) 2023. Data source: the Department of Buildings. Data aggregation and graphics credit: Vitali Ogorodnikov
With a 54-percent increase in permit filings between the two quarters (986 in Q3 versus 1,521 in Q4), an across-the-board increase for filing counts in most boroughs is to be expected.
Below is the breakdown of borough statistic changes between the year’s second and third quarters:
- The Bronx: 6-percent decrease (111 to 104 permits)
- Brooklyn: 11-percent increase (293 to 325)
- Manhattan: 74-percent increase (23 to 40)
- Queens: 2-percent increase (350 to 357)
- Staten Island: 234-percent increase (208 to 695)
In the fourth quarter of 2023, only The Bronx observed a slight dip, lowering from 111 to 104 permits between the two quarters. Queens saw a slight increase, notching up from 350 to 357. Brooklyn and Manhattan saw higher relative growth, rising from 293 to 325 and 23 to 40 permits, respectively. The greatest surprise came from Staten Island, which more than tripled its third-quarter total of 208 permit filings to a total of 695 filings in Q4.
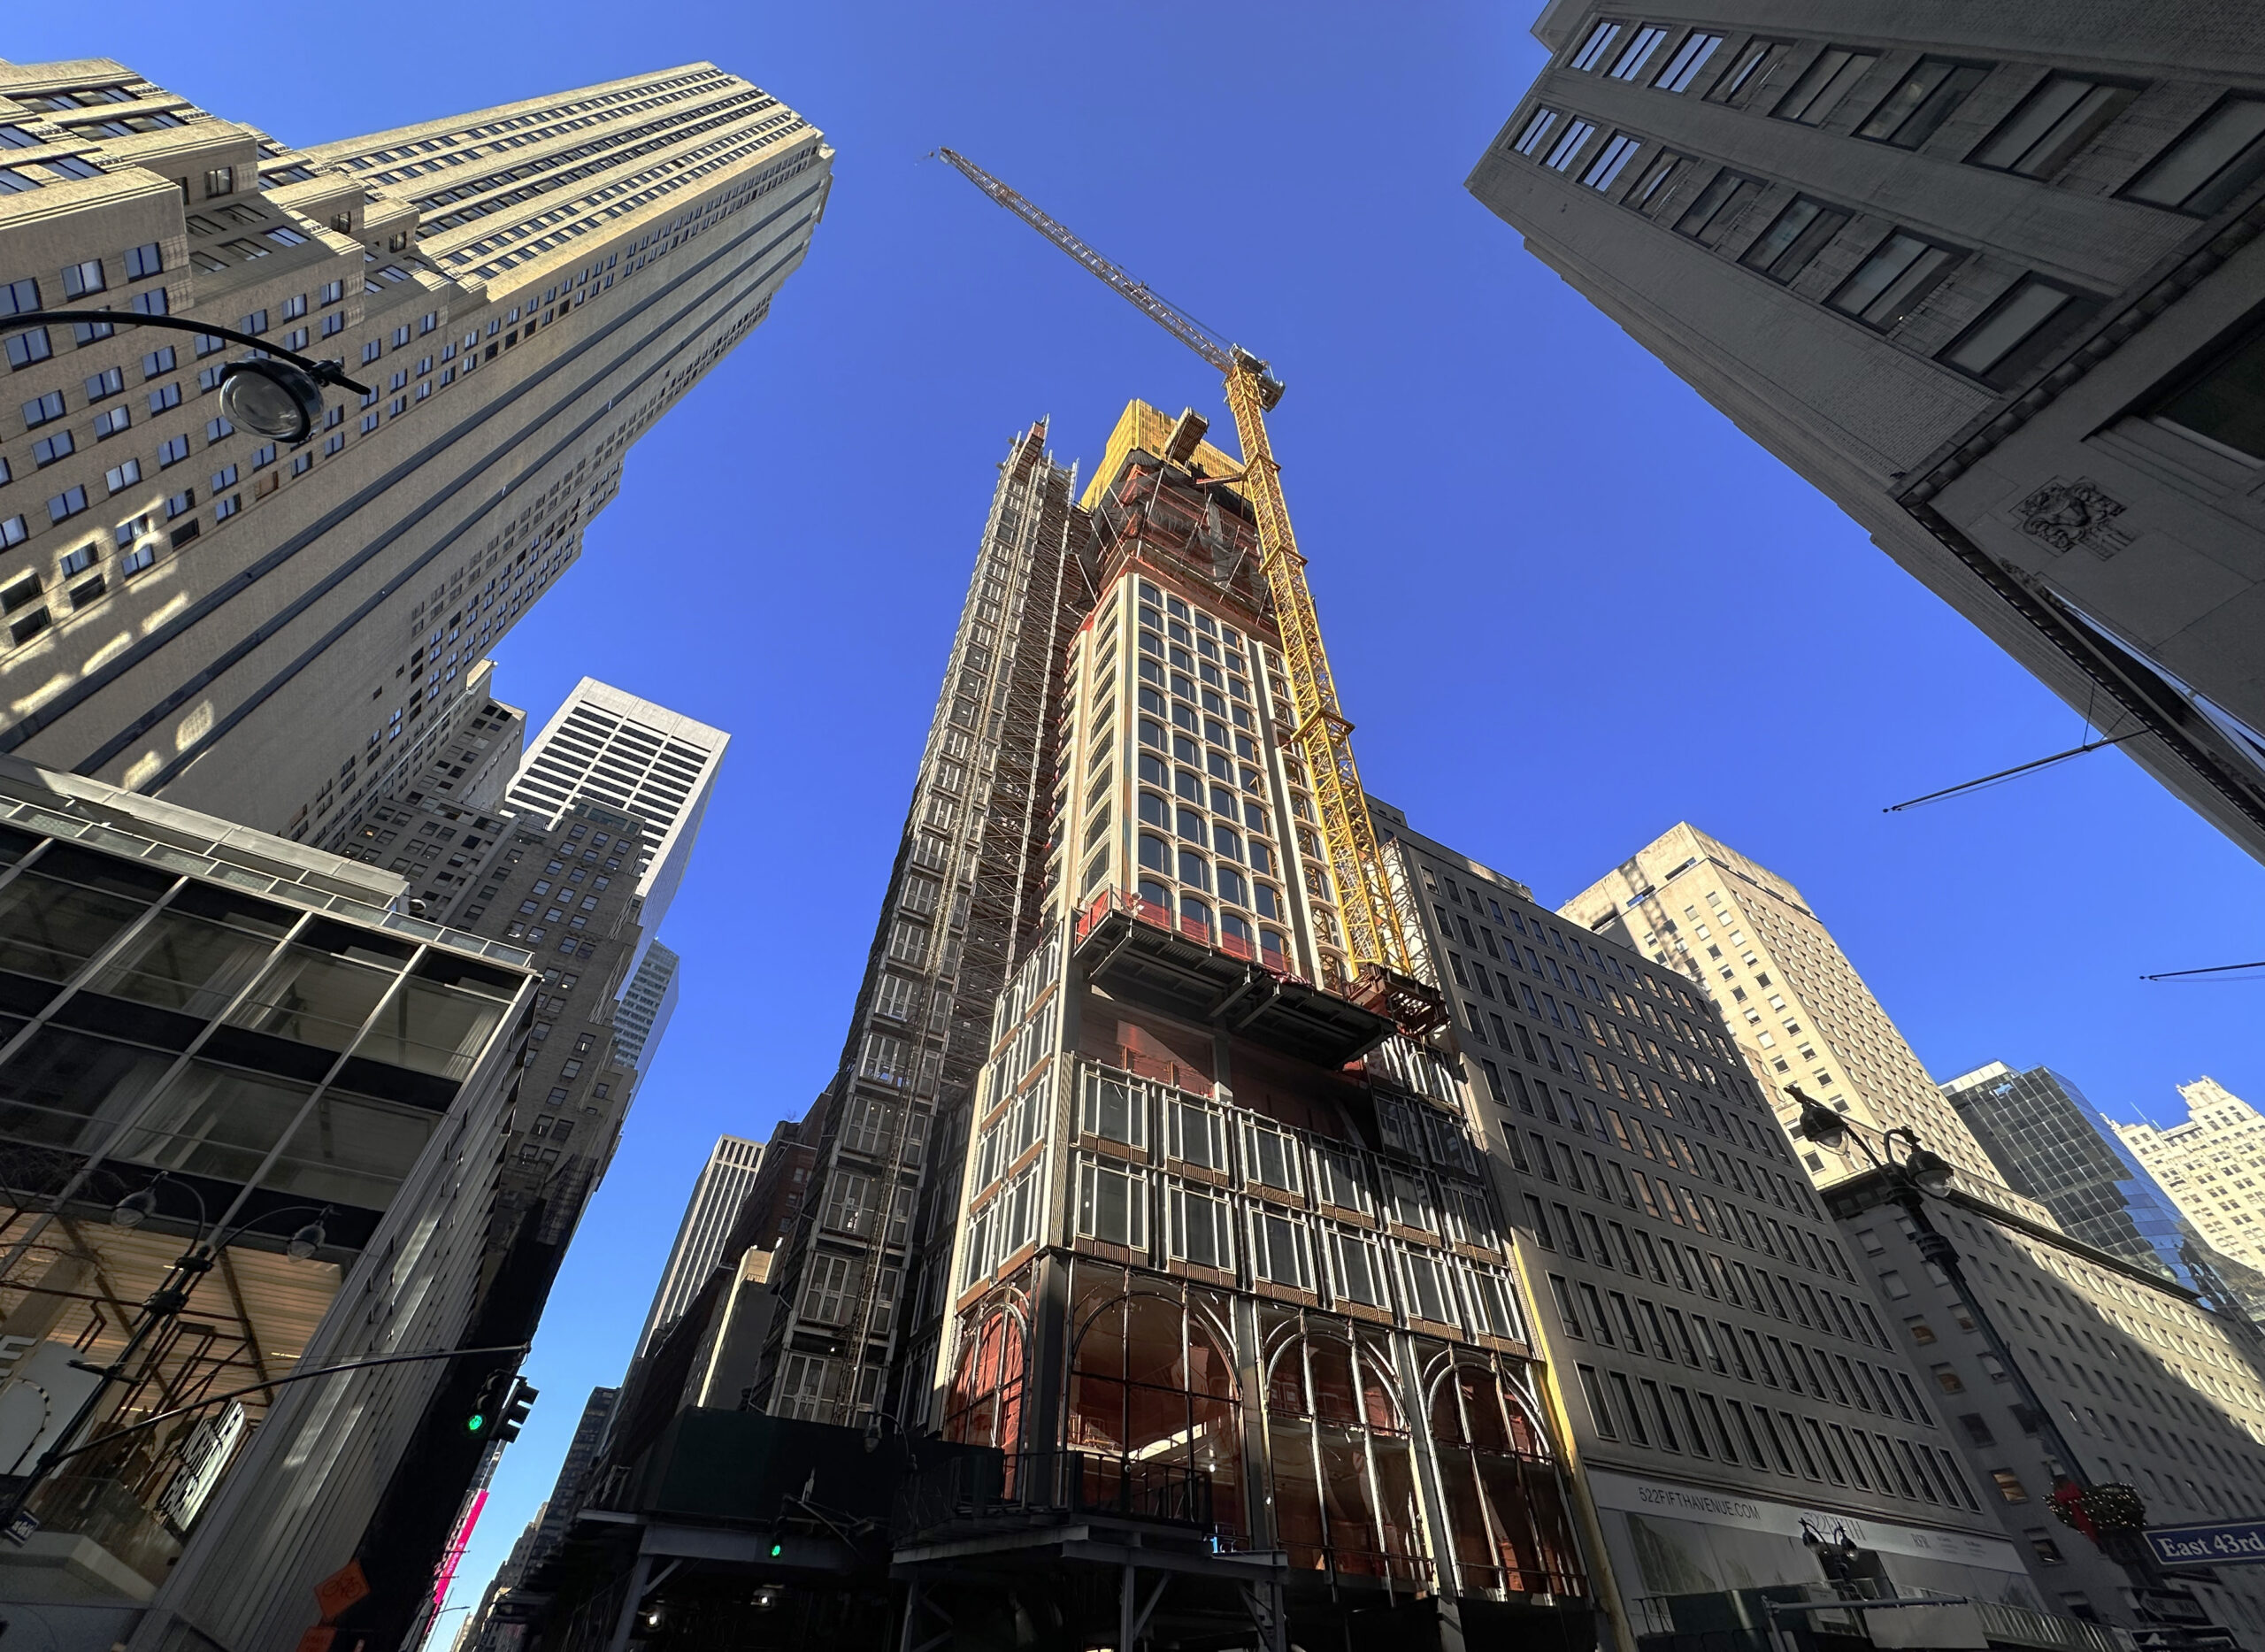
Photo by Michael Young
Permits listed by unit count per filing
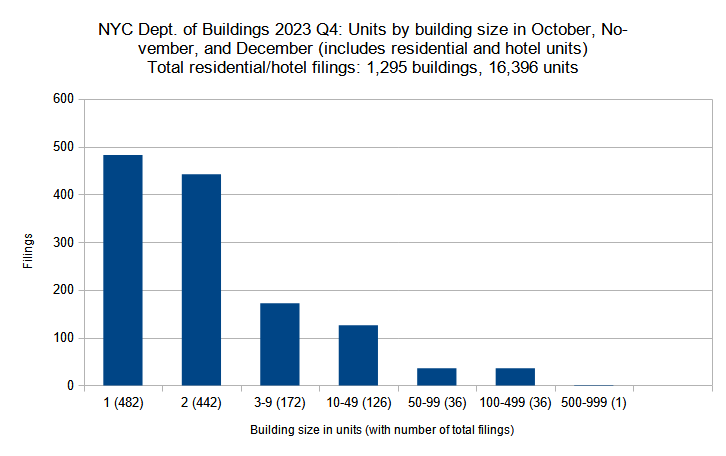
New residential and hotel construction permits filed in New York City in Q4 (October through December) 2023 grouped by unit count per filling. Data source: the Department of Buildings. Data aggregation and graphics credit: Vitali Ogorodnikov
The significant inter-quarter growth in permit filing counts in the second half of 2023 translates into substantial increases in almost every residential building size category, many growing by double-digit and some by triple-digit percentages.
Below, filing size categories are compared between the two quarters individually:
- Single-family: 139-percent increase (202 to 482 filings)
- Two-family: 66-percent increase (266 to 442)
- Three to nine units: 22-percent increase (141 to 172)
- Ten to 49 units: 5-percent increase (120 to 126)
- 50 to 99 units: 6-percent increase (34 to 36)
- 100 to 499 units: 13-percent increase (32 to 36)
- 500 to 999 units: 50-percent decrease (2 to 1)
The greatest increases were observed in single- and two-family filings, which rose by 139 and 66 percent, respectively, with each registering well over 400 filings in Q4. The only decrease was observed in the largest category, where permits for buildings with 500 to 999 units dipped from two in Q3 to one in Q4.
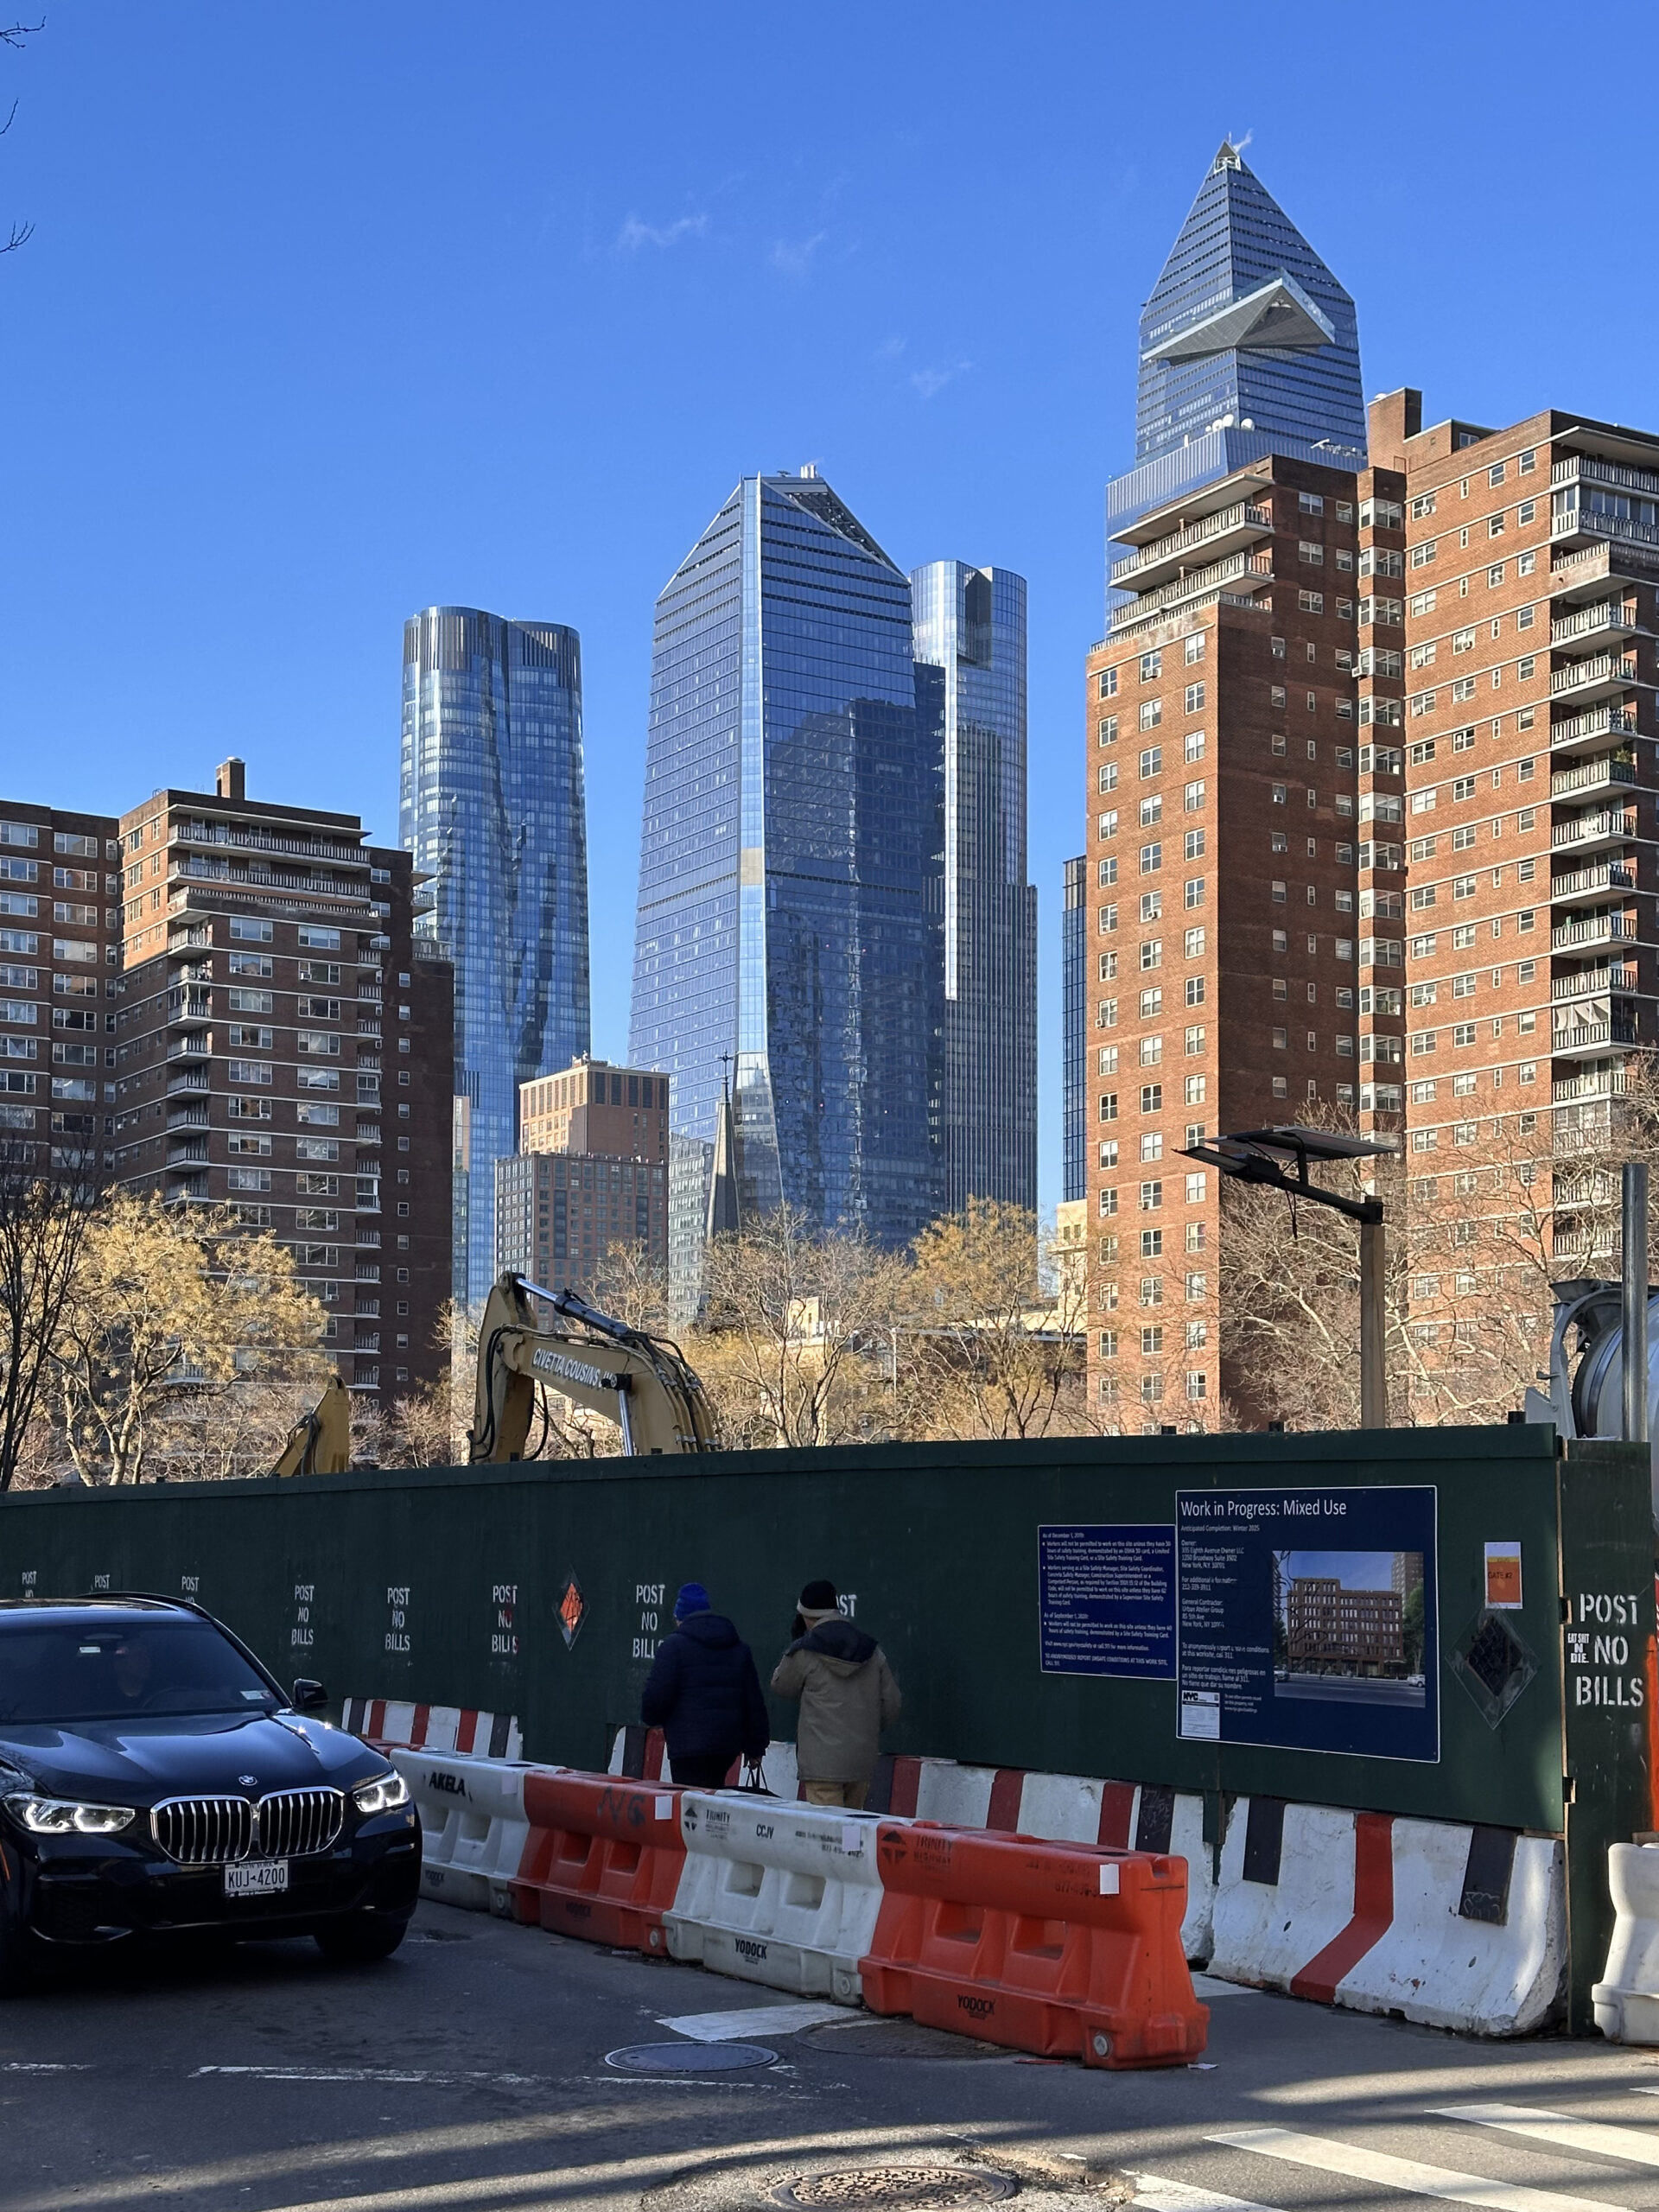
Photo by Michael Young
Residential and hotel units filed per borough
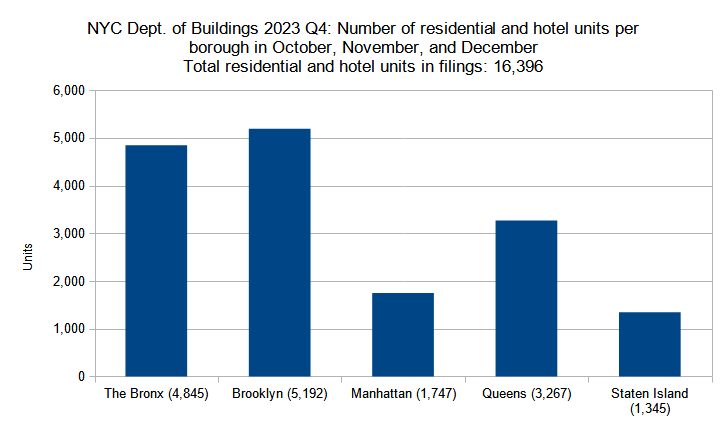
Number of residential and hotel units in new construction permits filed per borough in New York City in Q4 (October through December) 2023. Data source: the Department of Buildings. Data aggregation and graphics credit: Vitali Ogorodnikov
While the total number of permit filings between the third and fourth quarters of 2023 jumped by 54 percent, the number of filings for residential and hotel units rose at a more 17-percent clip, from 14,010 in Q3 to 16,396 in Q4 (which still makes for the highest quarterly figure of the year). Given an overall similarity in unit filing volume between the third and fourth quarters, a certain variation between the boroughs, rather than general sustained increases, is to be expected.
Below is a by-borough comparison between the two quarters:
- The Bronx: 58-percent increase (3,063 to 4,845 residential and hotel units)
- Brooklyn: 1-percent increase (5,147 to 5,192)
- Manhattan: 13-percent decrease (2,001 to 1,747)
- Queens: 6-percent decrease (3,466 to 3,267)
- Staten Island: 304-percent increase (333 to 1,345)
In the fourth quarter of the year, three boroughs registered increases and two saw decreases for total unit filings. A dramatic uptick was observed in The Bronx, which registered dramatic 58-percent growth with 1,782 more units filed for in Q4 than Q3. While The Bronx registered the highest total increase of any borough, Staten Island saw the largest relative growth, quadrupling its filed unit count from 333 in Q3 to 1,345 in Q4.
Photo by Michael Young
Permits listed by average unit count per filing
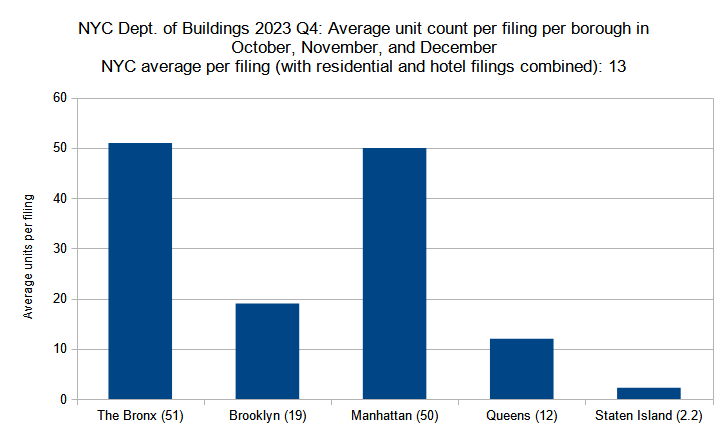
Average unit count (residential and hotel) per new construction permit per borough filed in New York City in Q4 (October through December) 2023. Data source: the Department of Buildings. Data aggregation and graphics credit: Vitali Ogorodnikov
Over the last two quarters of 2023, the total number of new building permit filings rose by 54 percent, yet the number of filed residential and hotel units increased more gradually, notching up 17 percent. These numbers imply that the average residential filing in Q4 has fewer units than its counterpart in the previous quarter, with the average residential/hotel filing shrinking from 18 units in Q3 to 13 units in Q4.
Below is a by-borough comparison between the two quarters:
- The Bronx: 59-percent increase (32 to 51 residential and hotel units)
- Brooklyn: 10-percent decrease (21 to 19)
- Manhattan: 50-percent decrease (100 to 50)
- Queens: 8-percent decrease (13 to 12)
- Staten Island: 5-percent increase (2.1 to 2.2)
Three of the five boroughs showed decreases in average unit counts, with the total for Manhattan plummeting by half, from 100 to 50 average units per filing from Q3 to Q4. Staten Island saw a very modest five percent growth, increasing from 2.1 to 2.2 units per average filing. Only The Bronx registered a significant increase, with an average filing growing in size by 59 percent from 32 units in Q3 to 51 units in Q4.
Photo by Michael Young
Permit filings by floor count category
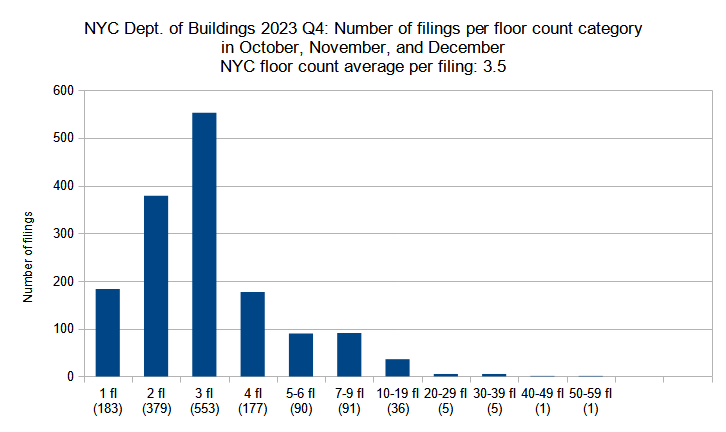
New construction permits filed in New York City in Q4 (October through December) 2023 grouped by floor count. Data source: the Department of Buildings. Data aggregation and graphics credit: Vitali Ogorodnikov
A significant gain in total new building permit filings between the third and fourth quarters of 2023 translates into increases in almost every building floor-count category. In the 11 floor-count groupings categorized by YIMBY, seven have shown double- and triple-digit percentage growth, three categories registered no change, and only one noted a decrease in filing numbers.
Below is a comparison per floor-count category between the two quarters:
- Single-story: 31-percent increase (140 to 183 permits)
- Two-story: 45-percent increase (262 to 379)
- Three-story: 109-percent increase (264 to 553)
- Four-story: 54-percent increase (115 to 177)
- Five to six floors: 23-percent increase (74 to 90)
- Seven to nine floors: no change (91)
- Ten to 19 floors: 16-percent increase (31 to 36)
- 20 to 29 floors: 29-percent decrease (7 to 5)
- 30 to 39 floors: 400-percent increase (1 to 5)
- 40 to 49 floors: no change (1)
- 50 to 59 floors: no change (1)
The fourth quarter of 2023 registered new building filings for 48 high-rise buildings (ten stories and above), of which seven are planned to rise over 30 stories, as well as 358 mid-rise buildings (four to nine stories). If built side by side, these buildings would comprise a neighborhood that would rival the central business districts of many mid-sized American cities. However, the greatest growth between the two quarters took place in low-rise categories, with two- and three-story filing counts increasing by 117 and 289, respectively.
Notably, the top six of the ten tallest permit filings by floor count in the fourth quarter of 2023 are found outside of Manhattan’s primary skyscraper districts in Downtown and Midtown. The top three are situated in the emerging high-rise neighborhoods of Downtown Brooklyn and Long Island City in Brooklyn and Queens; the following three filings are found on Manhattan’s Upper East Side; the next three are situated in Midtown; and the tenth entrant is in the Highbridge section of The Bronx.
Below are the top ten filings in Q4, in order:
- 589 Fulton Street in Downtown Brooklyn (52 floors)
- 26-38 Jackson Avenue in Long Island City, Queens (49 floors)
- 95 Rockwell Place in Downtown Brooklyn (38 floors)
- 255 East 77th Street on the Upper East Side of Manhattan (33 floors)
- 250 East 83rd Street on the Upper East Side of Manhattan (32 floors)
- 1026 Third Avenue on the Upper East Side of Manhattan (31 floors)
- 4 East 49th Street in Midtown Manhattan (31 floors)
- 401 East 51st Street in Midtown Manhattan (28 floors)
- Rolex Headquarters at 665 5th Avenue in Midtown Manhattan (28 floors)
- 1387 University Avenue in Highbridge, The Bronx (26 floors)
Photo by Michael Young
Average number of floors per filing per borough
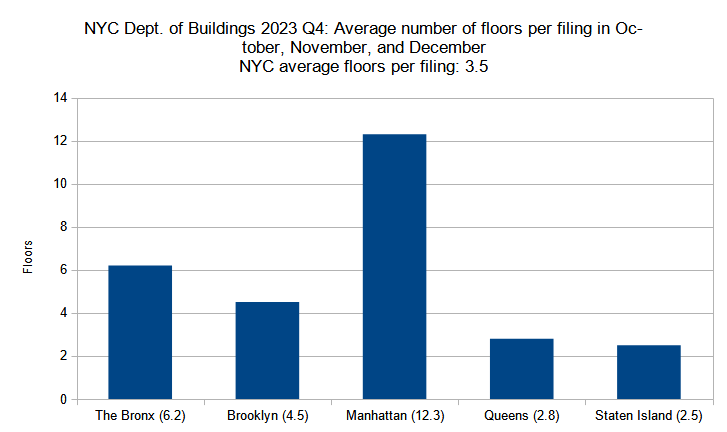
Average number of floors per new construction permit per borough filed in New York City in Q4 (October through December) 2023. Data source: the Department of Buildings. Data aggregation and graphics credit: Vitali Ogorodnikov
As noted in the previous analyses, new building permit filings became more numerous yet slightly smaller in scale between the third and fourth quarters of 2023. During this period, the average filing floor count dipped slightly, from 3.8 in Q3 to 3.6 in Q4. As such, the variability rate has also remained relatively constant between individual boroughs.
Below is the by-borough comparison between the two quarters:
- The Bronx: 22-percent increase (5.1 to 6.2 floors)
- Brooklyn: 2-percent increase (4.4 to 4.5)
- Manhattan: 17-percent decrease (14.8 to 12.3)
- Queens: 3-percent decrease (2.9 to 2.8)
- Staten Island: 4-percent increase (2.4 to 2.5)
Between Q3 and Q4, three boroughs (The Bronx, Brooklyn, and Staten Island) noted permit filing floor count gains, while two (Manhattan and Queens) registered decreases. Most of the changes were minimal, growing or shrinking by less than five percent. The only notable increase was observed in The Bronx, where the average floor count per filing grew by 22 percent from 5.1 in Q3 to 6.2 in Q4. A similar degree of decrease was observed in Manhattan, where the average filing shrunk by 17 percent from 14.8 in Q3 to 12.3 in Q4.
The following are the permit filings in each borough with the highest floor counts:
- The Bronx: 1387 University Avenue in Highbridge (26 floors)
- Brooklyn: 589 Fulton Street in Downtown Brooklyn (52 floors)
- Manhattan: 255 East 77th Street on the Upper East Side (33 floors)
- Queens: 26-38 Jackson Avenue in Long Island City (49 floors)
- Staten Island: 178 Richmond Terrace in St. George (16 floors)
Photo by Michael Young
Permits listed by floor area per filing
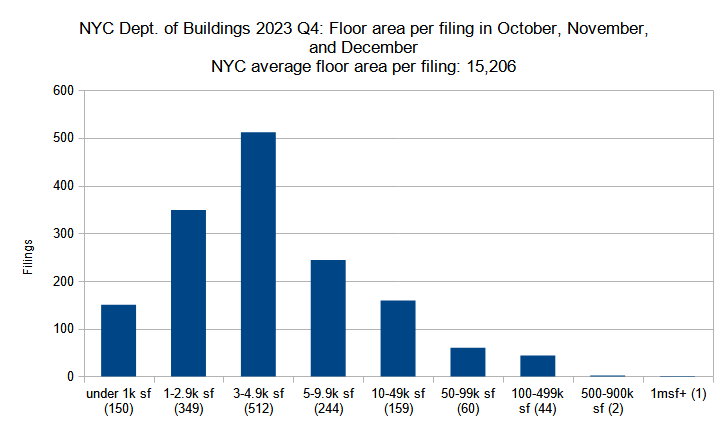
New construction permits filed in New York City in Q4 (October through December) 2023 grouped by total floor area. Data source: the Department of Buildings. Data aggregation and graphics credit: Vitali Ogorodnikov
The significant overall increase of permit filings between the last two quarters of 2023 means that permit filing counts increased concurrently in almost every floor area size category. Of the eight floor-area size categories tracked by YIMBY, increases were noted in six groups, ranging from three percent for filings measuring 10,000 to 49,999 square feet to 107 percent for filings spanning 1,000 to 2,999 square feet. The 100,000 to 499,999-square-foot category noted a statistically negligible drop of 2 percent, and the 500,000-square-foot-plus group saw no change from the previous quarter.
Below is a breakdown by floor area category:
- Under 1,000 square feet: 32-percent increase (114 to 150 permits)
- 1,000 to 2,999 SF: 107-percent increase (169 to 349)
- 3,000 to 4,999 SF: 74-percent increase (295 to 512)
- 5,000 to 9,999 SF: 43-percent increase (171 to 244)
- 10,000 to 49,999 SF: 3-percent increase (155 to 159)
- 50,000 to 99,999 SF: 58-percent increase (38 to 60)
- 100,000 to 499,999 SF: 2-percent decrease (45 to 44)
- 500,000 to 999,999 SF; none in the previous quarter (2 in Q4)
Of the top five largest (by floor area) new building filings in the fourth quarter of 2023, none were found in Manhattan’s central business districts. Within the top five, the only Manhattan filing is found in Inwood, the northernmost neighborhood on the island. The rest of the filings are found in Brooklyn, Queens, and The Bronx.
Below are the top five fourth-quarter construction permit filings by floor area, in order:
- 275 Atlantic Avenue in Downtown Brooklyn (1,008,700 square feet)
- 589 Fulton Street in Downtown Brooklyn (597,824 square feet)
- 407 West 206th Street in Inwood, Manhattan (537,702 square feet)
- 44-01 Northern Boulevard in Astoria, Queens (427,832 square feet)
- 38 Bruckner Boulevard in Mott Haven, The Bronx (422,740 square feet)
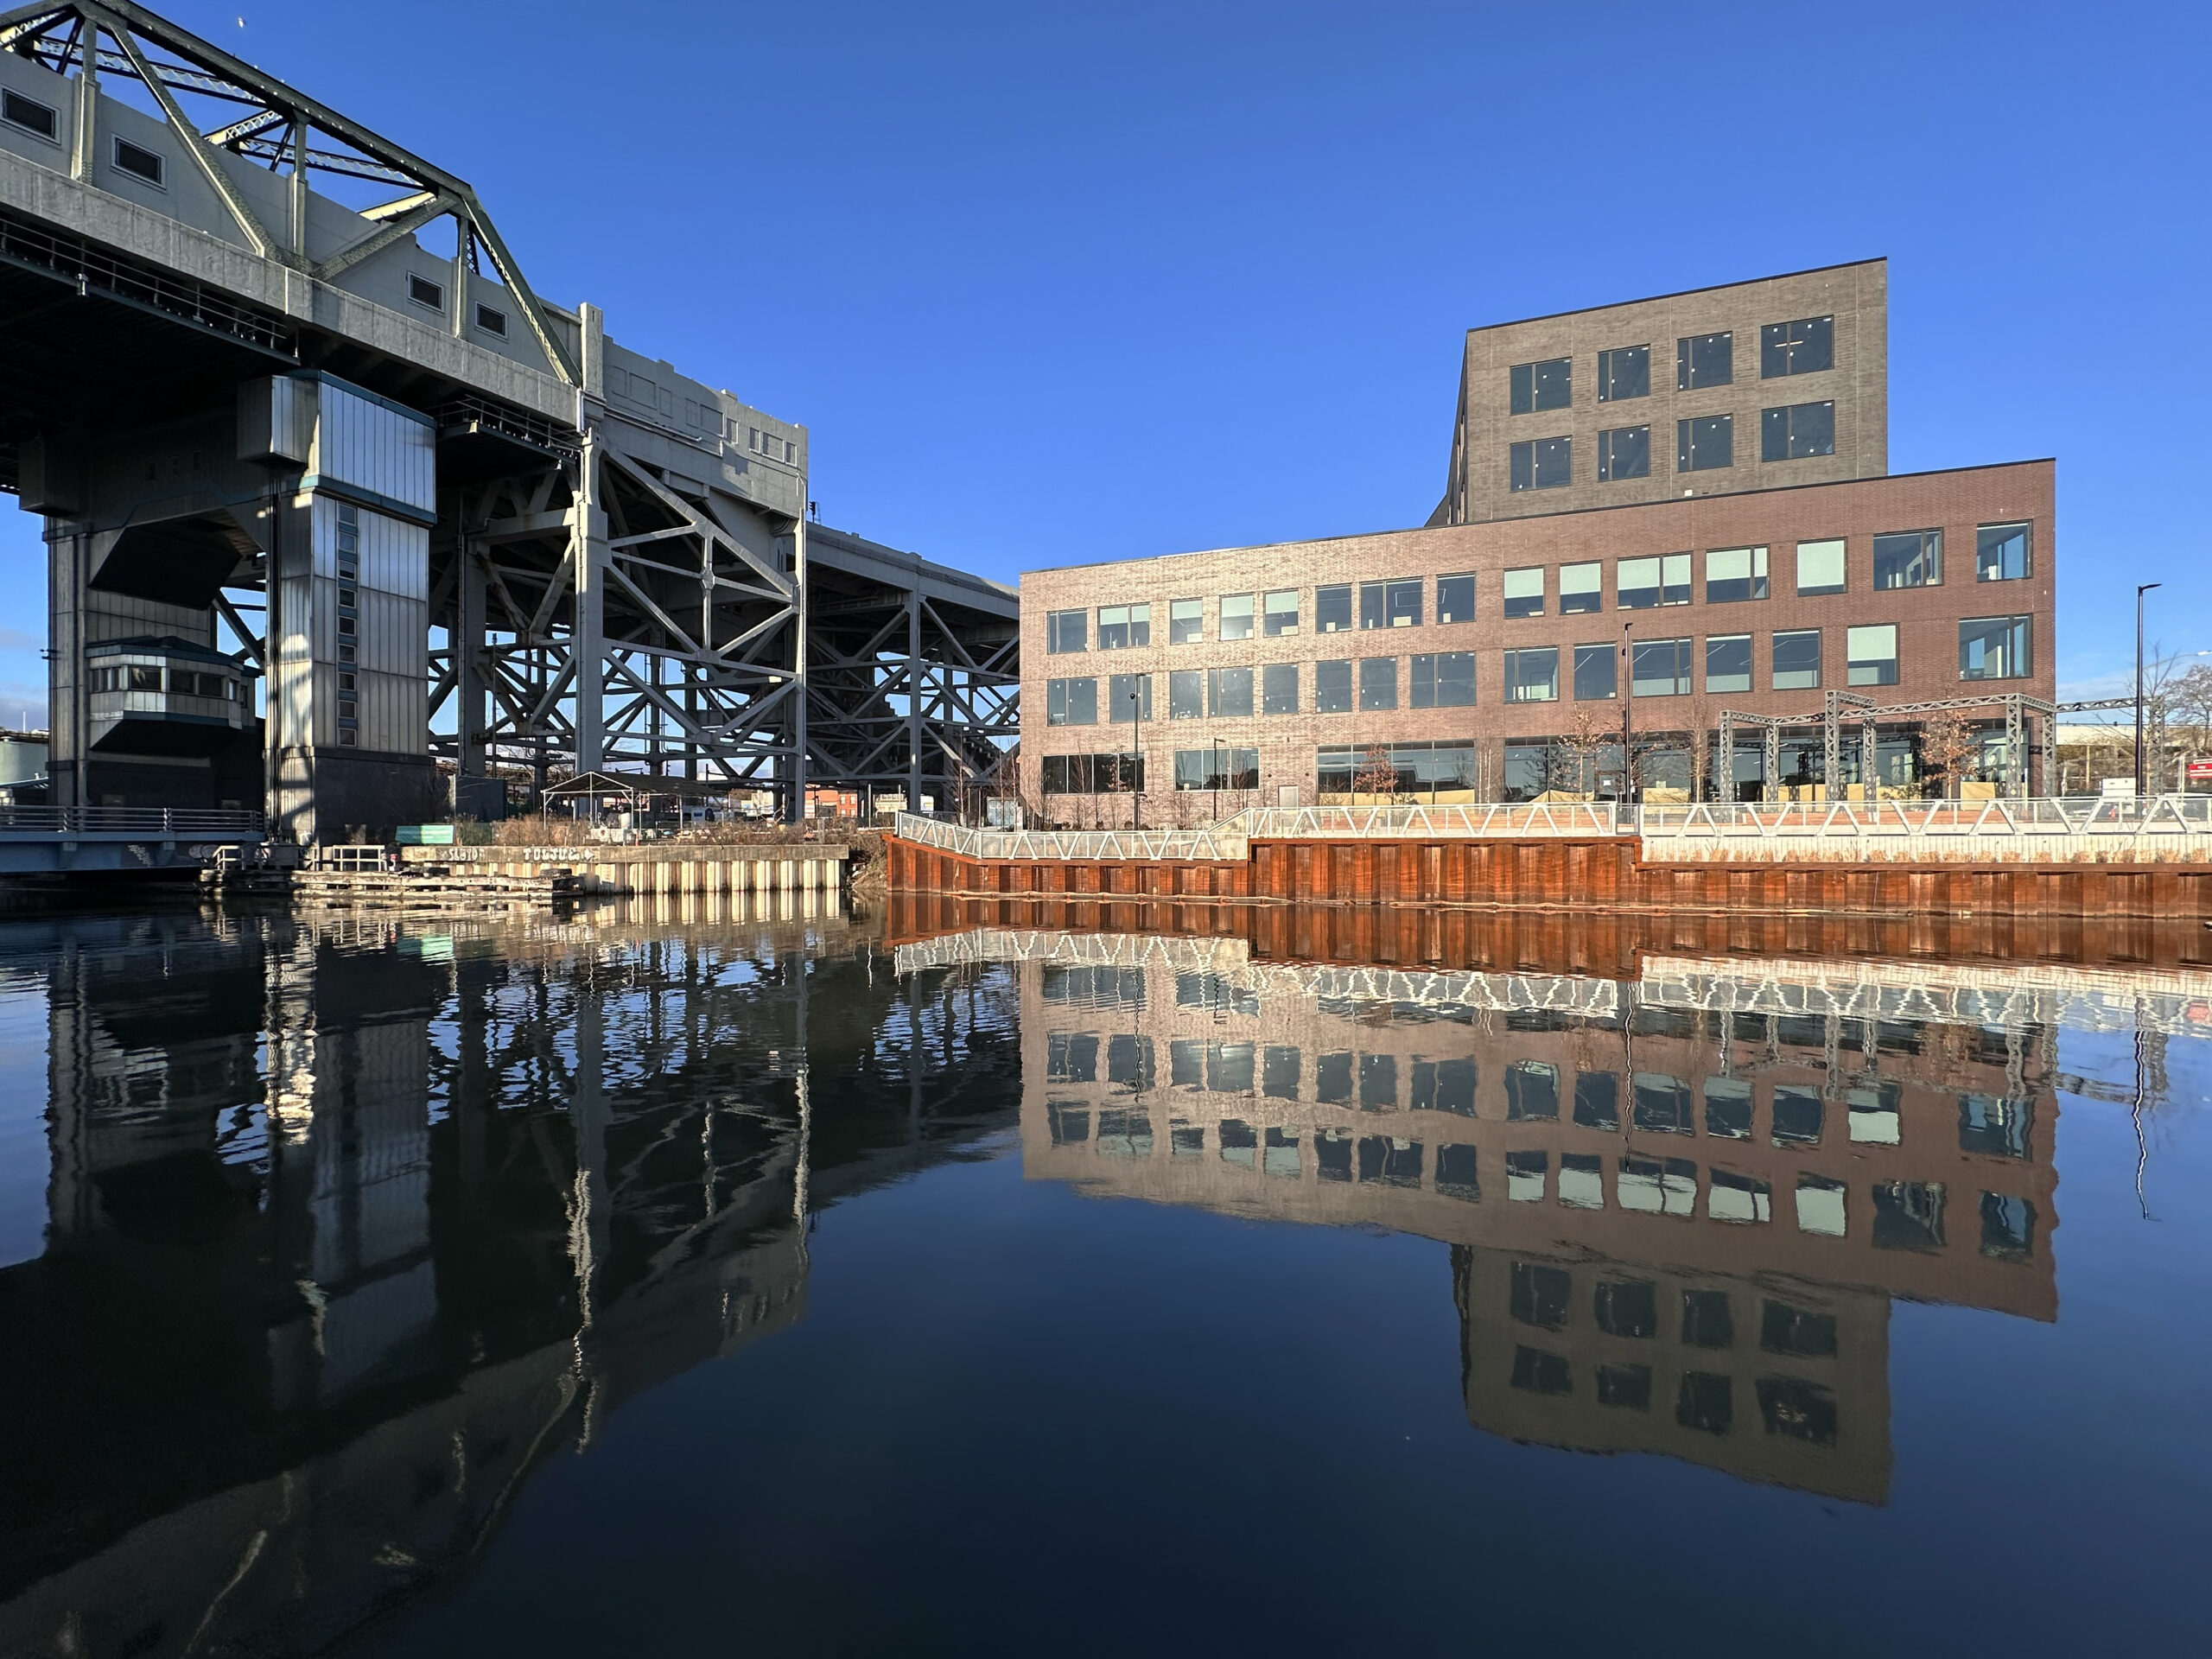
Photo by Michael Young
Total floor area filed by borough
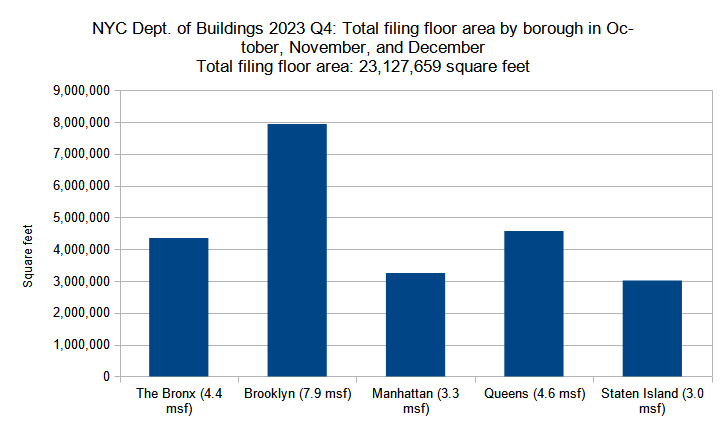
Combined floor area of new construction permits filed per borough in New York City in Q4 (October through December) 2023. Data source: the Department of Buildings. Data aggregation and graphics credit: Vitali Ogorodnikov
The fourth quarter of 2023 saw a 26-percent growth in total filed-for floor area from the previous quarter, increasing from 18.3 million square feet in Q3 to 23.1 million square feet in Q4. Concurrently, four out of five boroughs registered increases. Staten Island showed the largest gain, more than doubling its square footage from 1.2 million square feet in Q3 to 3 million square feet in Q4. Queens was the only borough to post a comparative decrease, notching down by 6 percent from 4.9 million square feet in Q3 to 4.6 million square feet in Q4.
Below are the square footage totals per borough compared between the two quarters:
- The Bronx: 47-percent increase (3.0 to 4.4 million square feet)
- Brooklyn: 16-percent increase (6.8 to 7.9 MSF)
- Manhattan: 32-percent increase (2.5 to 3.3 MSF)
- Queens: 6-percent decrease (4.9 to 4.6 MSF)
- Staten Island: 150-percent increase (1.2 to 3.0 MSF)
The following are the permit filings in each borough with the largest floor area:
- The Bronx: 38 Bruckner Boulevard in Mott Haven (422,740 square feet)
- Brooklyn: 275 Atlantic Avenue in Downtown Brooklyn (1,008,700 square feet)
- Manhattan: 407 West 206th Street in Inwood (537,702 square feet)
- Queens: 44-01 Northern Boulevard in Astoria (427,832 square feet)
- Staten Island: 178 Richmond Terrace in St. George (401,291 square feet)
In every borough, the largest filing represents around one-sixth to one-eighth of the total filed-for floor area in the fourth quarter.
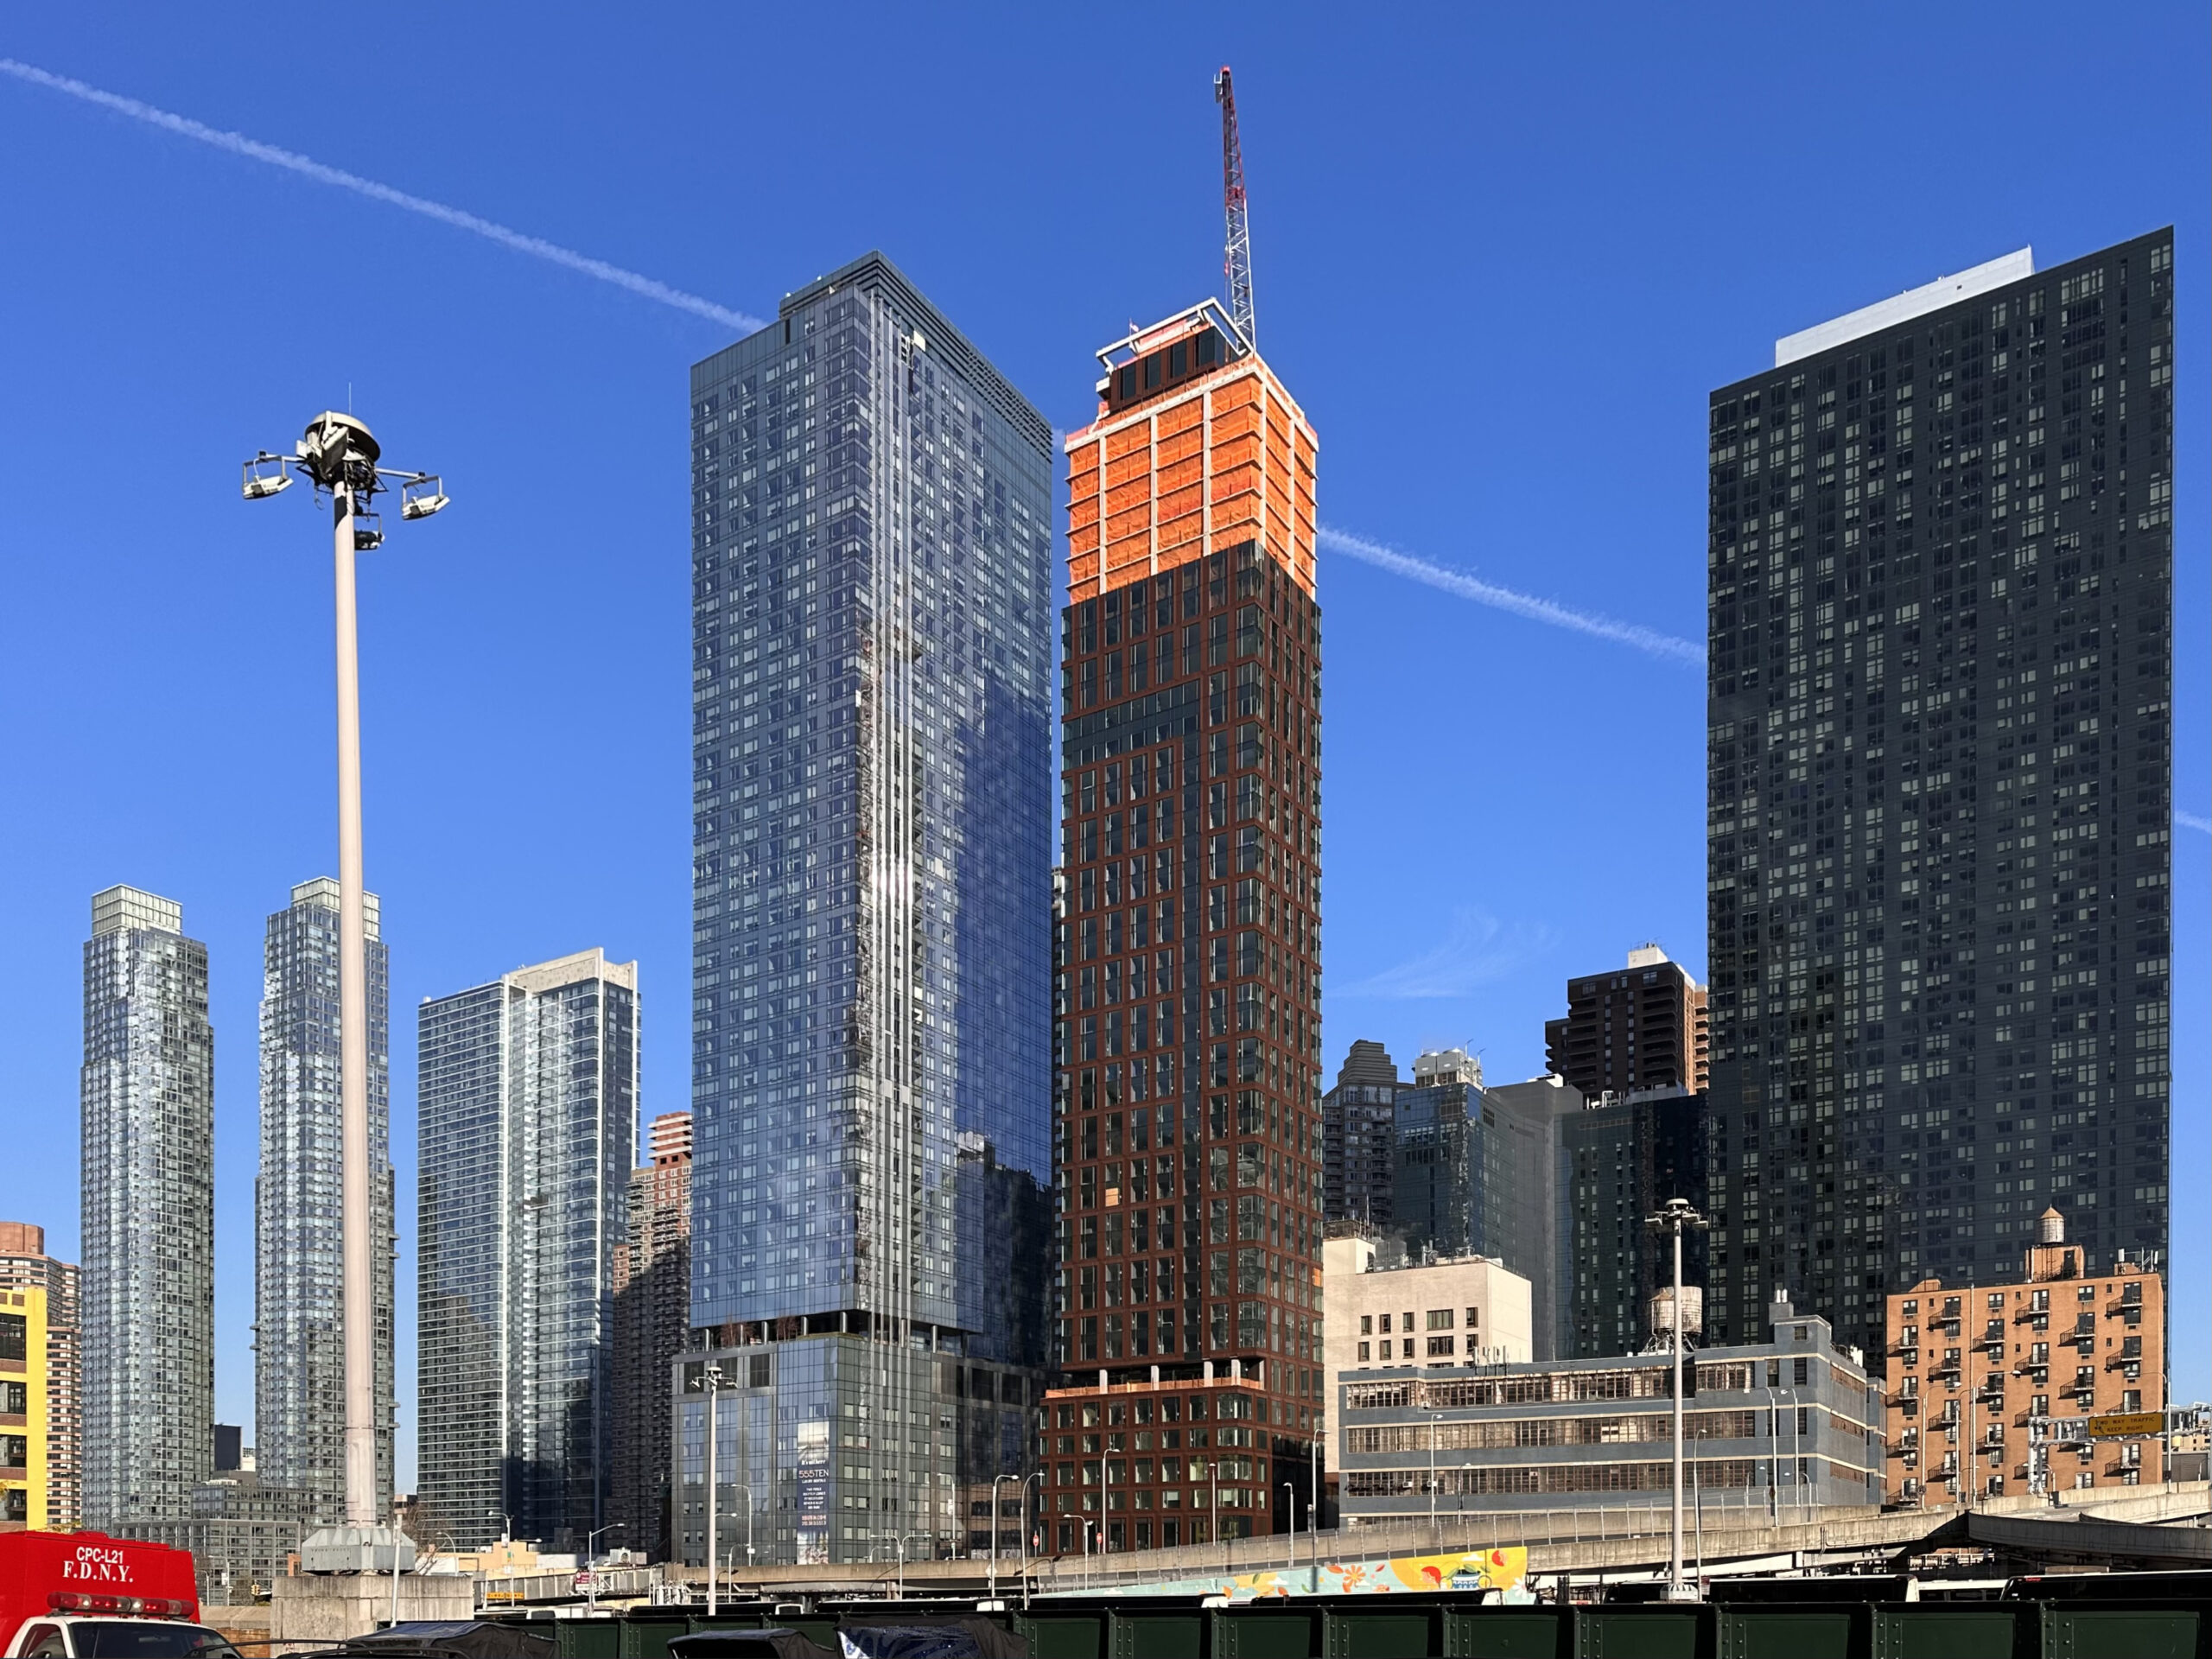
Photo by Michael Young
Average floor area per permit filing by borough
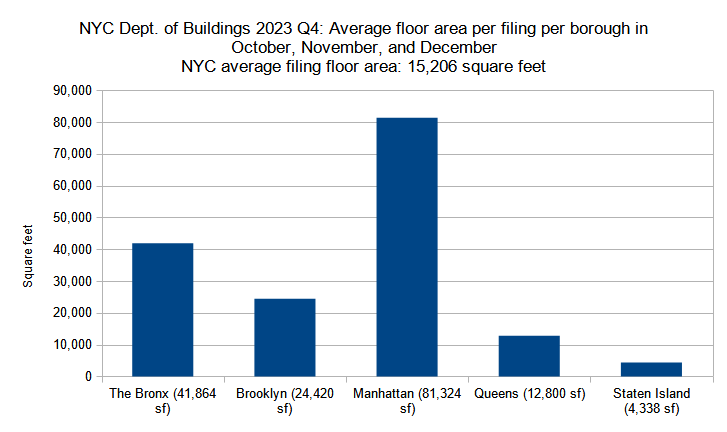
Average floor area per new construction permit per borough filed in New York City in Q4 (October through December) 2023. Data source: the Department of Buildings. Data aggregation and graphics credit: Vitali Ogorodnikov
Between the third and fourth quarters of 2023, the 54-percent growth rate of filing numbers outpaced the 26-percent growth of the total floor area, suggesting that the average filing size decreased slightly between the two quarters. Indeed, the size of the average filing dipped by 18 percent, decreasing from 18,546 square feet in Q3 to 15,206 square feet in Q4.
Below is the quarterly comparison for the boroughs:
- The Bronx: 56-percent increase (26,758 to 41,864 square feet)
- Brooklyn: 5-percent increase (23,329 to 24,420)
- Manhattan: 16-percent decrease (96,814 to 81,324)
- Queens: 8-percent decrease (13,876 to 12,800)
- Staten Island: 26-percent decrease (5,891 to 4,338)
Between Q3 and Q4 2023, The Bronx and Brooklyn posted increases in average square footage per filing, while the other three noted decreases. The largest gain was observed in The Bronx, which registered 56-percent growth, while the greatest decrease was observed in Staten Island, which dipped by 26 percent. While Manhattan registered a 16-percent decline, its average of 81,324 square feet per filing is still nearly double the size of the next-largest average filing of 41,864 in The Bronx, although the gap has closed significantly since the nearly quadruple difference between the averages for the two boroughs in the third quarter.
Photo by Michael Young

Photo by Michael Young
Subscribe to YIMBY’s daily e-mail
![]()
Follow YIMBYgram for real-time photo updates
Like YIMBY on Facebook
Follow YIMBY’s Twitter for the latest in YIMBYnews
ok so clearly, there was a huge batch of single/two family homes in staten island in december, highly likely they were filed by the same developer. wonder where on the island that new neighborhood is gonna be?
The better question is whether the small buildings represent newly created housing or just replacements of older and smaller homes. New filings don’t necessarily mean additional dwelling units.
Based on what I’m hearing and dealing with in the current market, I expect these numbers to drop quite significantly for Q1 2024. There is positive outlook for later in the year, but we need a new form of 421a to be passed, and interest rates need to continue to come down. Note also that many jobs may have started much earlier than 2023, so even though permit filings are high, that doesn’t necessarily correlate with current projects in design phases.
New York is Booming!
Mostly suburban housing in Staten Island, not very impressive.
This is great news. The trend to build more housing and apartments needs to continue. Also, there needs to be a mix of types of apartments in order to help address the housing crisis. Not all new apartments being constructed need to be luxury apartments. It is a good idea to build income restricted apartments, but there should also be a plan for non-luxury housing that doesn’t have income restrictions
I appreciate you, including the Michael Young photographs. I would also appreciate if you can identify what they are?
No doubt—mad love for Michael Young, but better captions, please, just for the quarterly editions!
The biggest building near me is a 40-something unit luxury that will replace three smaller buildings, now torn down, with over 60 units.
So the filling says 40-something units but it’s a reduction of the number of units in the neighborhood.
Filings for new units does not necessarily mean that additional housing opportunities are being created.