
New York YIMBY’s tally for the second quarter of 2026 shows that New York City’s developers have filed for a total of 903 new building permits with the Department of Buildings during the three-month period spanning April through June, easily surpassing the prior quarter’s total of 793 permits. An extensive data sheet with detailed information on each proposed project, including its technical statistics and development teams, is available with a subscription to YIMBY’s Building Wire. The proposed buildings, which range from supertall towers to single-car garages, comprise a combined 20.6 million square feet of floor area slated for residential, commercial, and other uses.
The 16,546 planned residential and hotel units (primarily residential) will help augment the city’s supply-strained, demand-stressed housing stock. Below we look at the numbers through a series of analyses that paint a nuanced picture of what the city’s builders had on their drawing boards during the year’s second quarter.
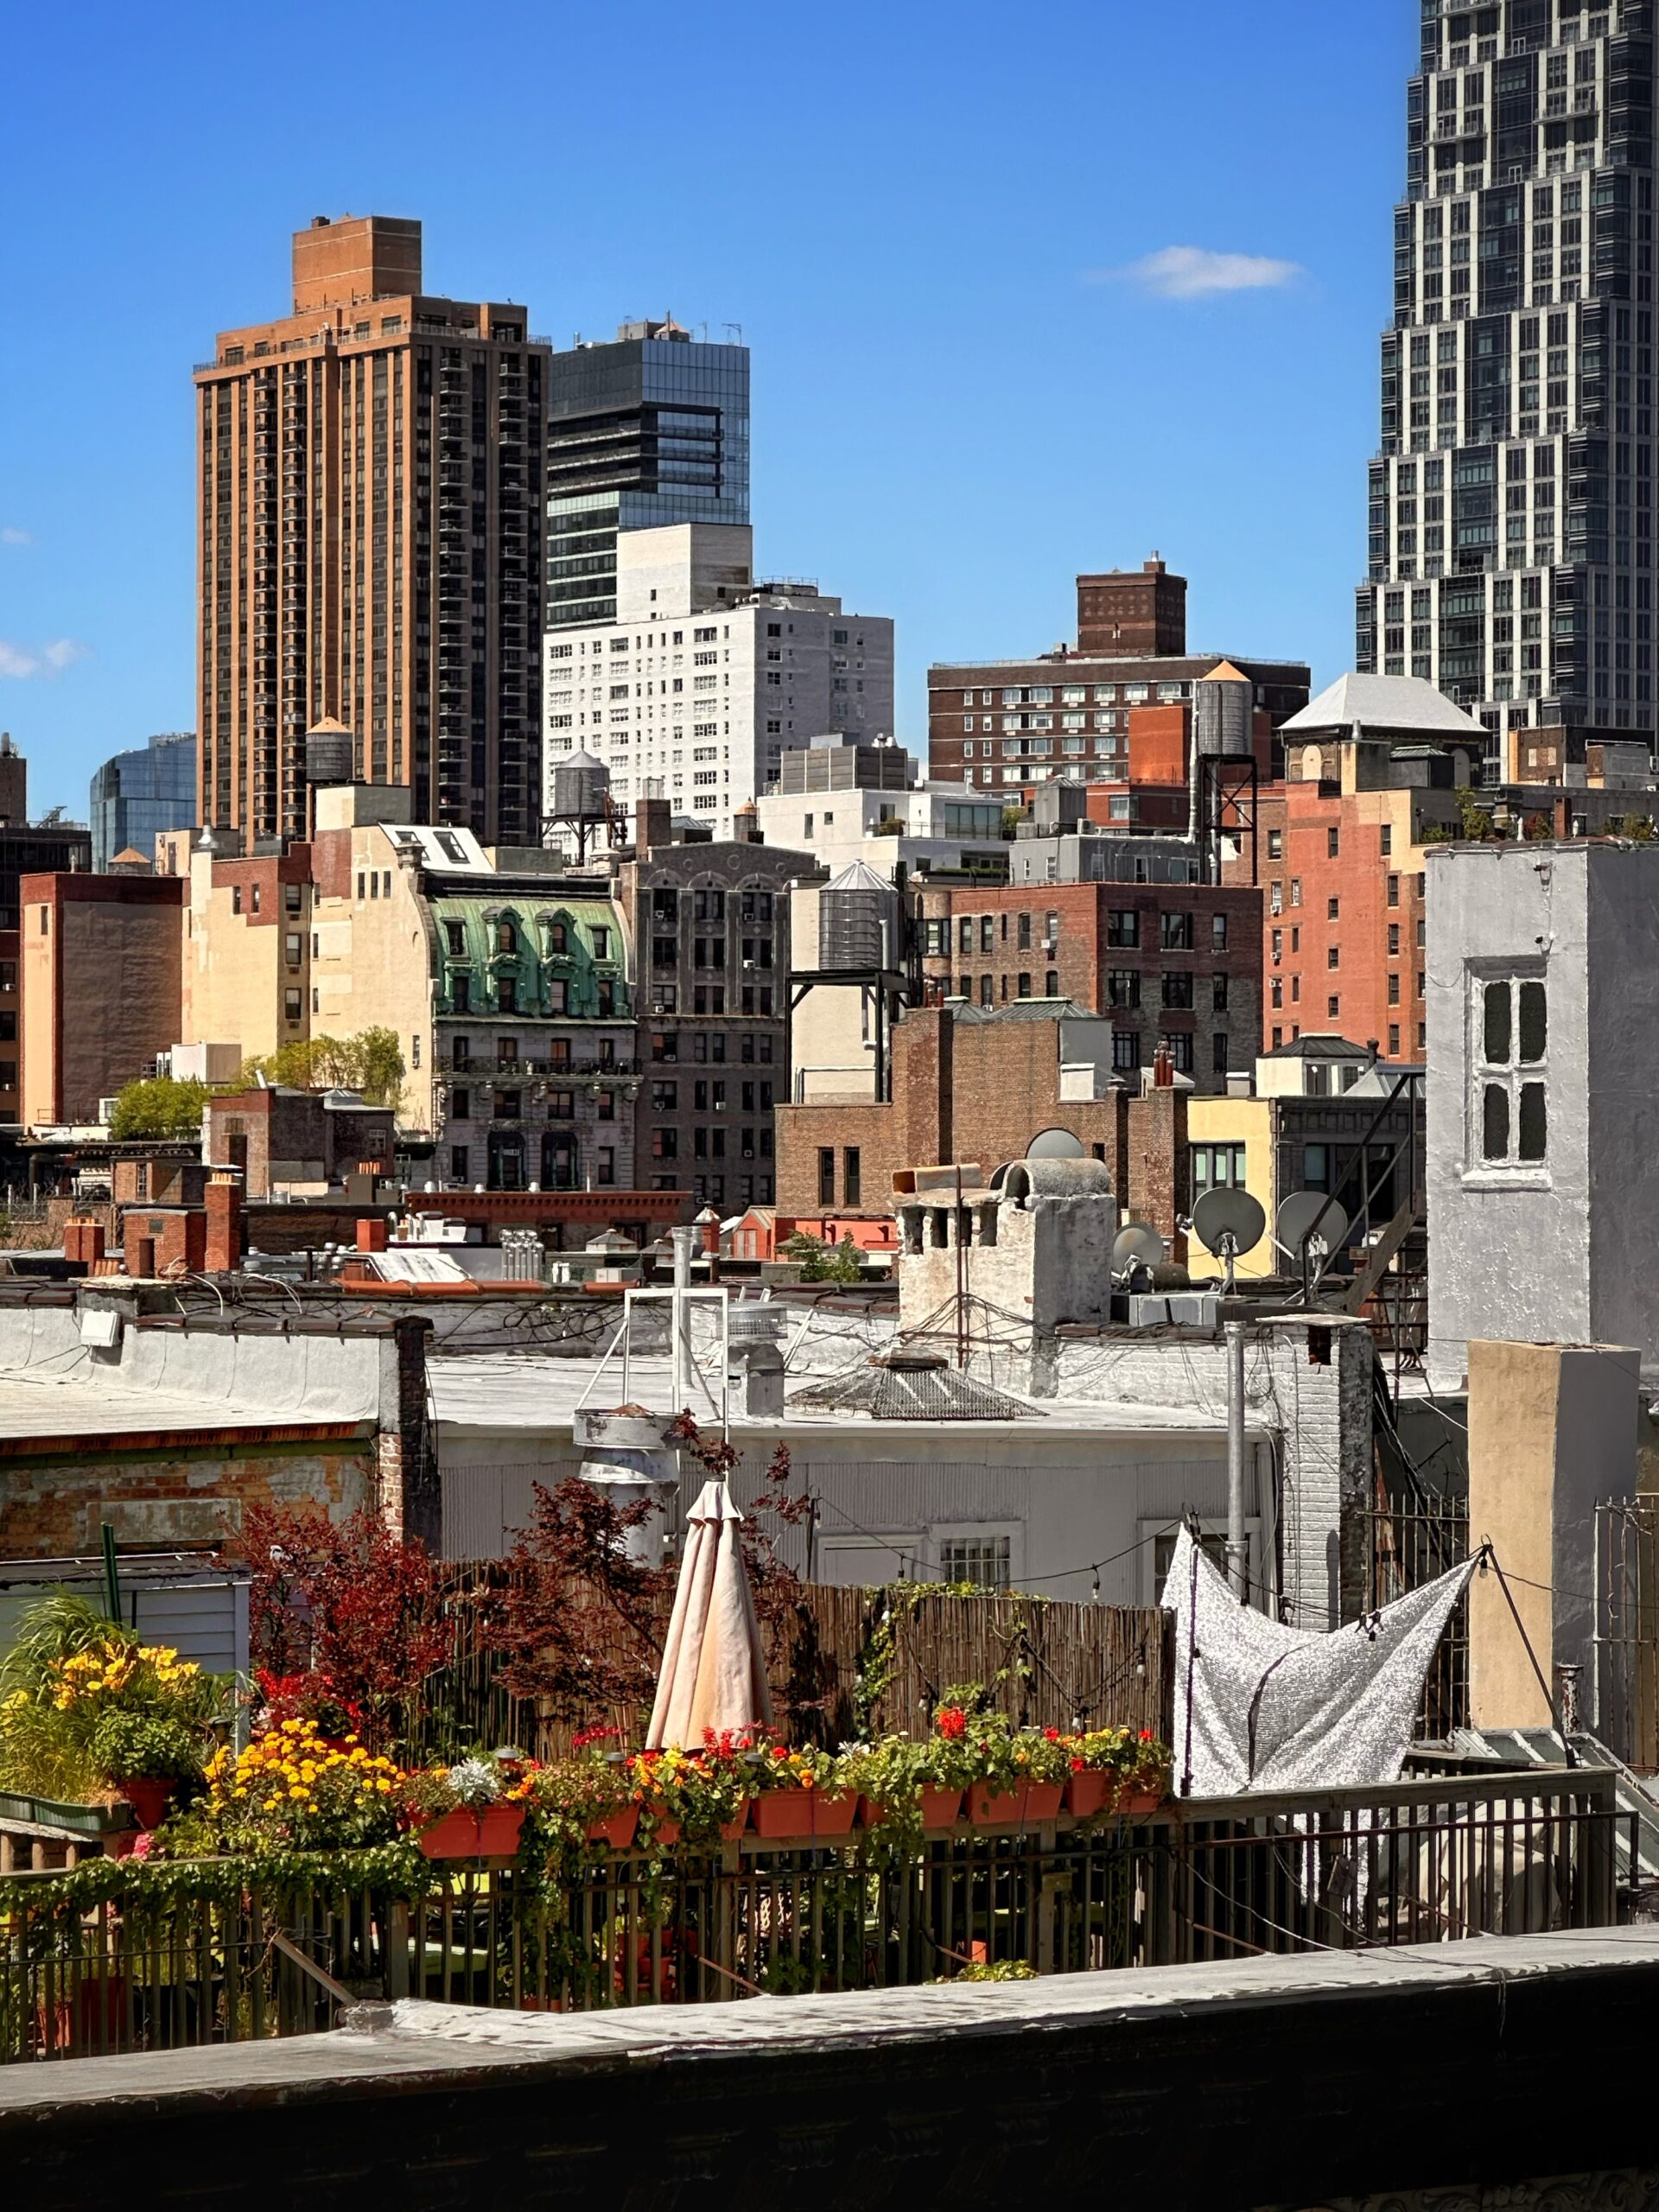
Upper West Side. Photo by Michael Young.
Number of permit filings per month
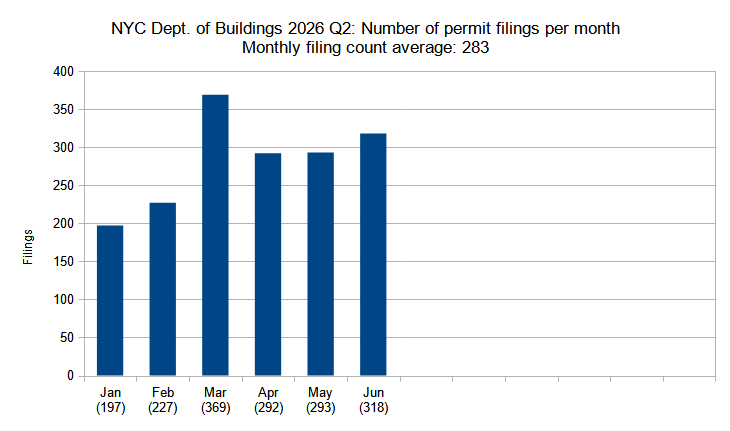
Number of new construction permits filed per month in New York City in the first two quarters (Q1 and Q2, January through June) of 2026. Data source: the Department of Buildings. Data aggregation and graphics credit: Vitali D. Ogorodnikov.
Below is the number of building permit filings per month in 2026:
- January – 197 permits
- February – 227 permits
- March – 369 permits
- April – 292 permits
- May – 293 permits
- June – 318 permits
In the second quarter of 2026, new building filing permit totals continued to follow the upward trajectory observed since the start of the year. Although the 318 permits registered in June, the highest monthly total for Q2, did not beat the year’s current record holder (March, with 369 permits), the monthly filing average of 283 permits in Q2 distinctly outperforms the preceding quarterly average of 264.
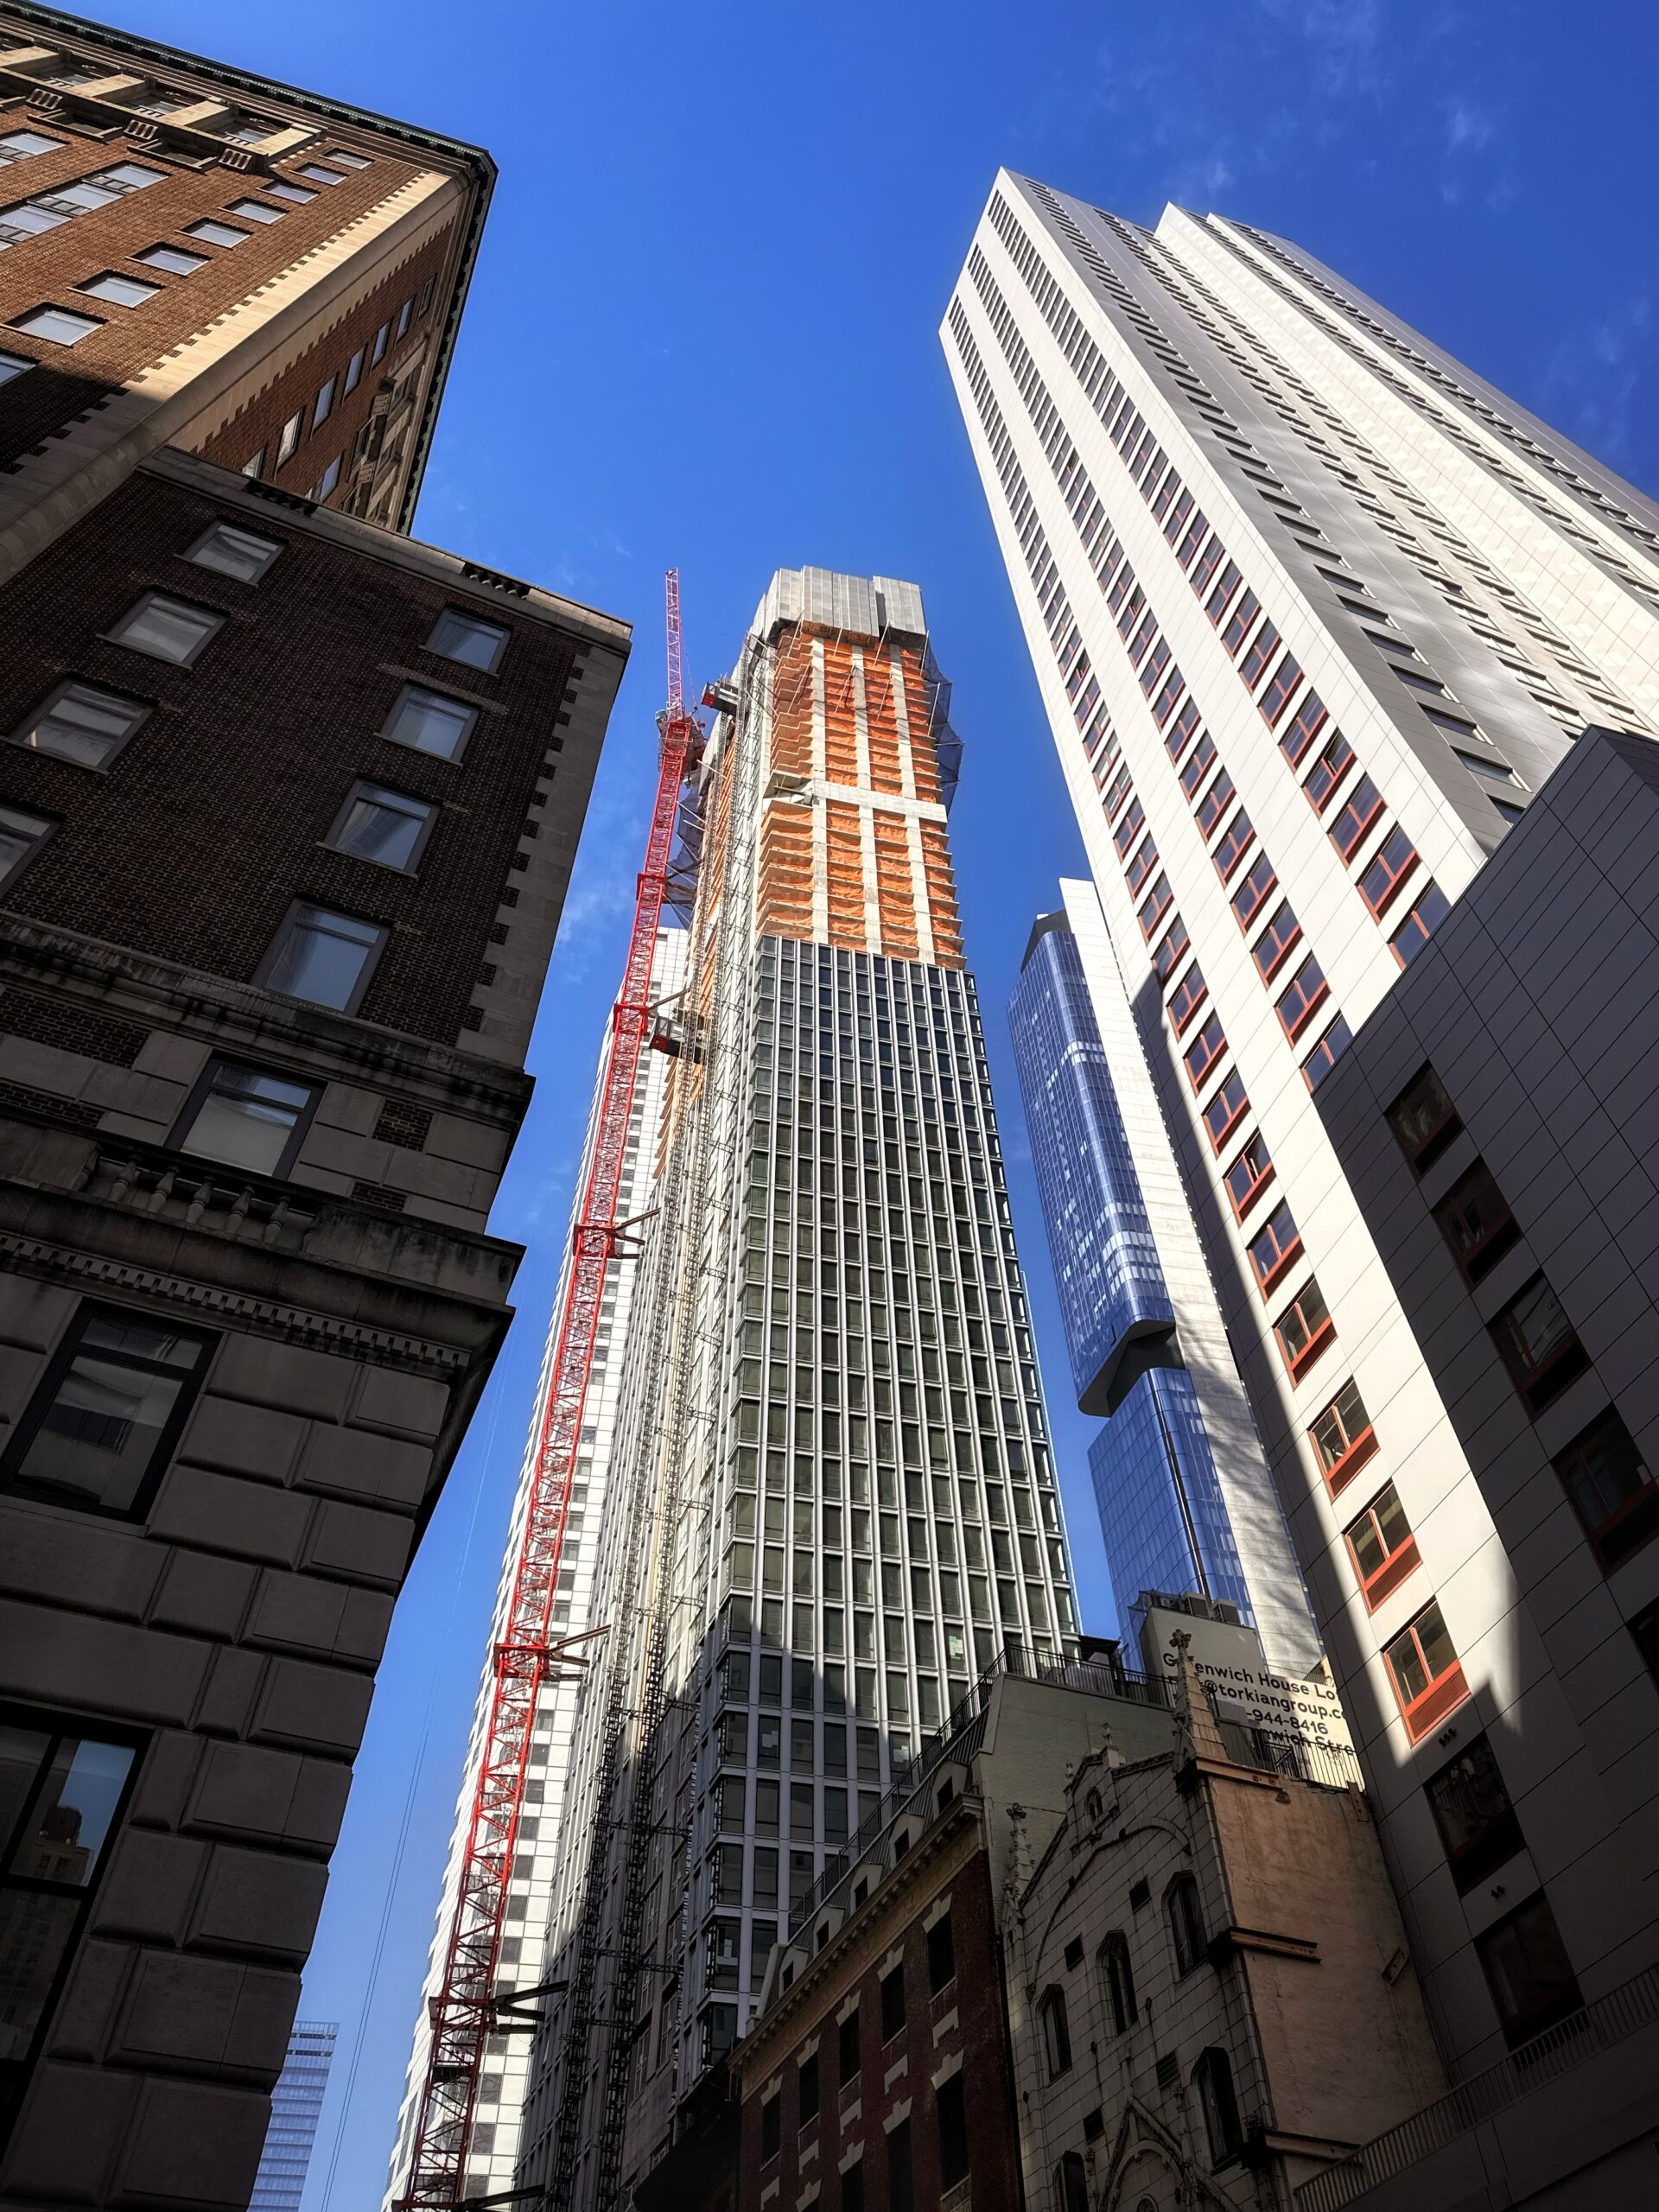
8 Carlisle Street. Photo by Michael Young.
Number of permit filings by borough
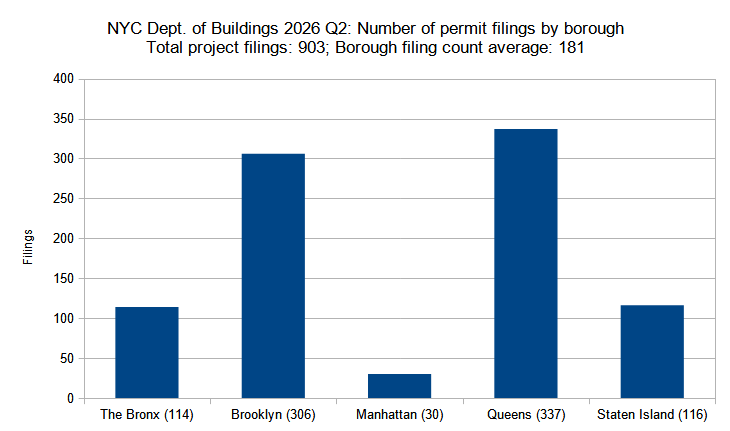
Number of new construction permits filed per borough in New York City in the second quarter (Q2) of 2026. Data source: the Department of Buildings. Data aggregation and graphics credit: Vitali D. Ogorodnikov.
Below is the number of new building permit filings per borough in Q2 2026 (with 903 total filings):
- The Bronx – 114 permits (13 percent of the quarterly total)
- Brooklyn – 306 permits (34 percent)
- Manhattan – 30 permits (3 percent)
- Queens – 337 permits (37 percent)
- Staten Island – 116 permits (13 percent)
Aside from a few notable exceptions, new building filing patterns have largely held steady between the first and second quarters of 2026 in most categories analyzed.
As in the prior quarter, Queens and Brooklyn still exhibit the highest permit filing totals, though Queens slightly edged out Brooklyn in the overall permit share in Q2. The city’s two largest boroughs, both by land area and population, each recorded an approximately 50-percent increase in permit filing totals during the period.
Meanwhile, The Bronx, Manhattan, and Staten Island all dropped in their relative share of the city’s total, each recording a lower total than that of Q1.
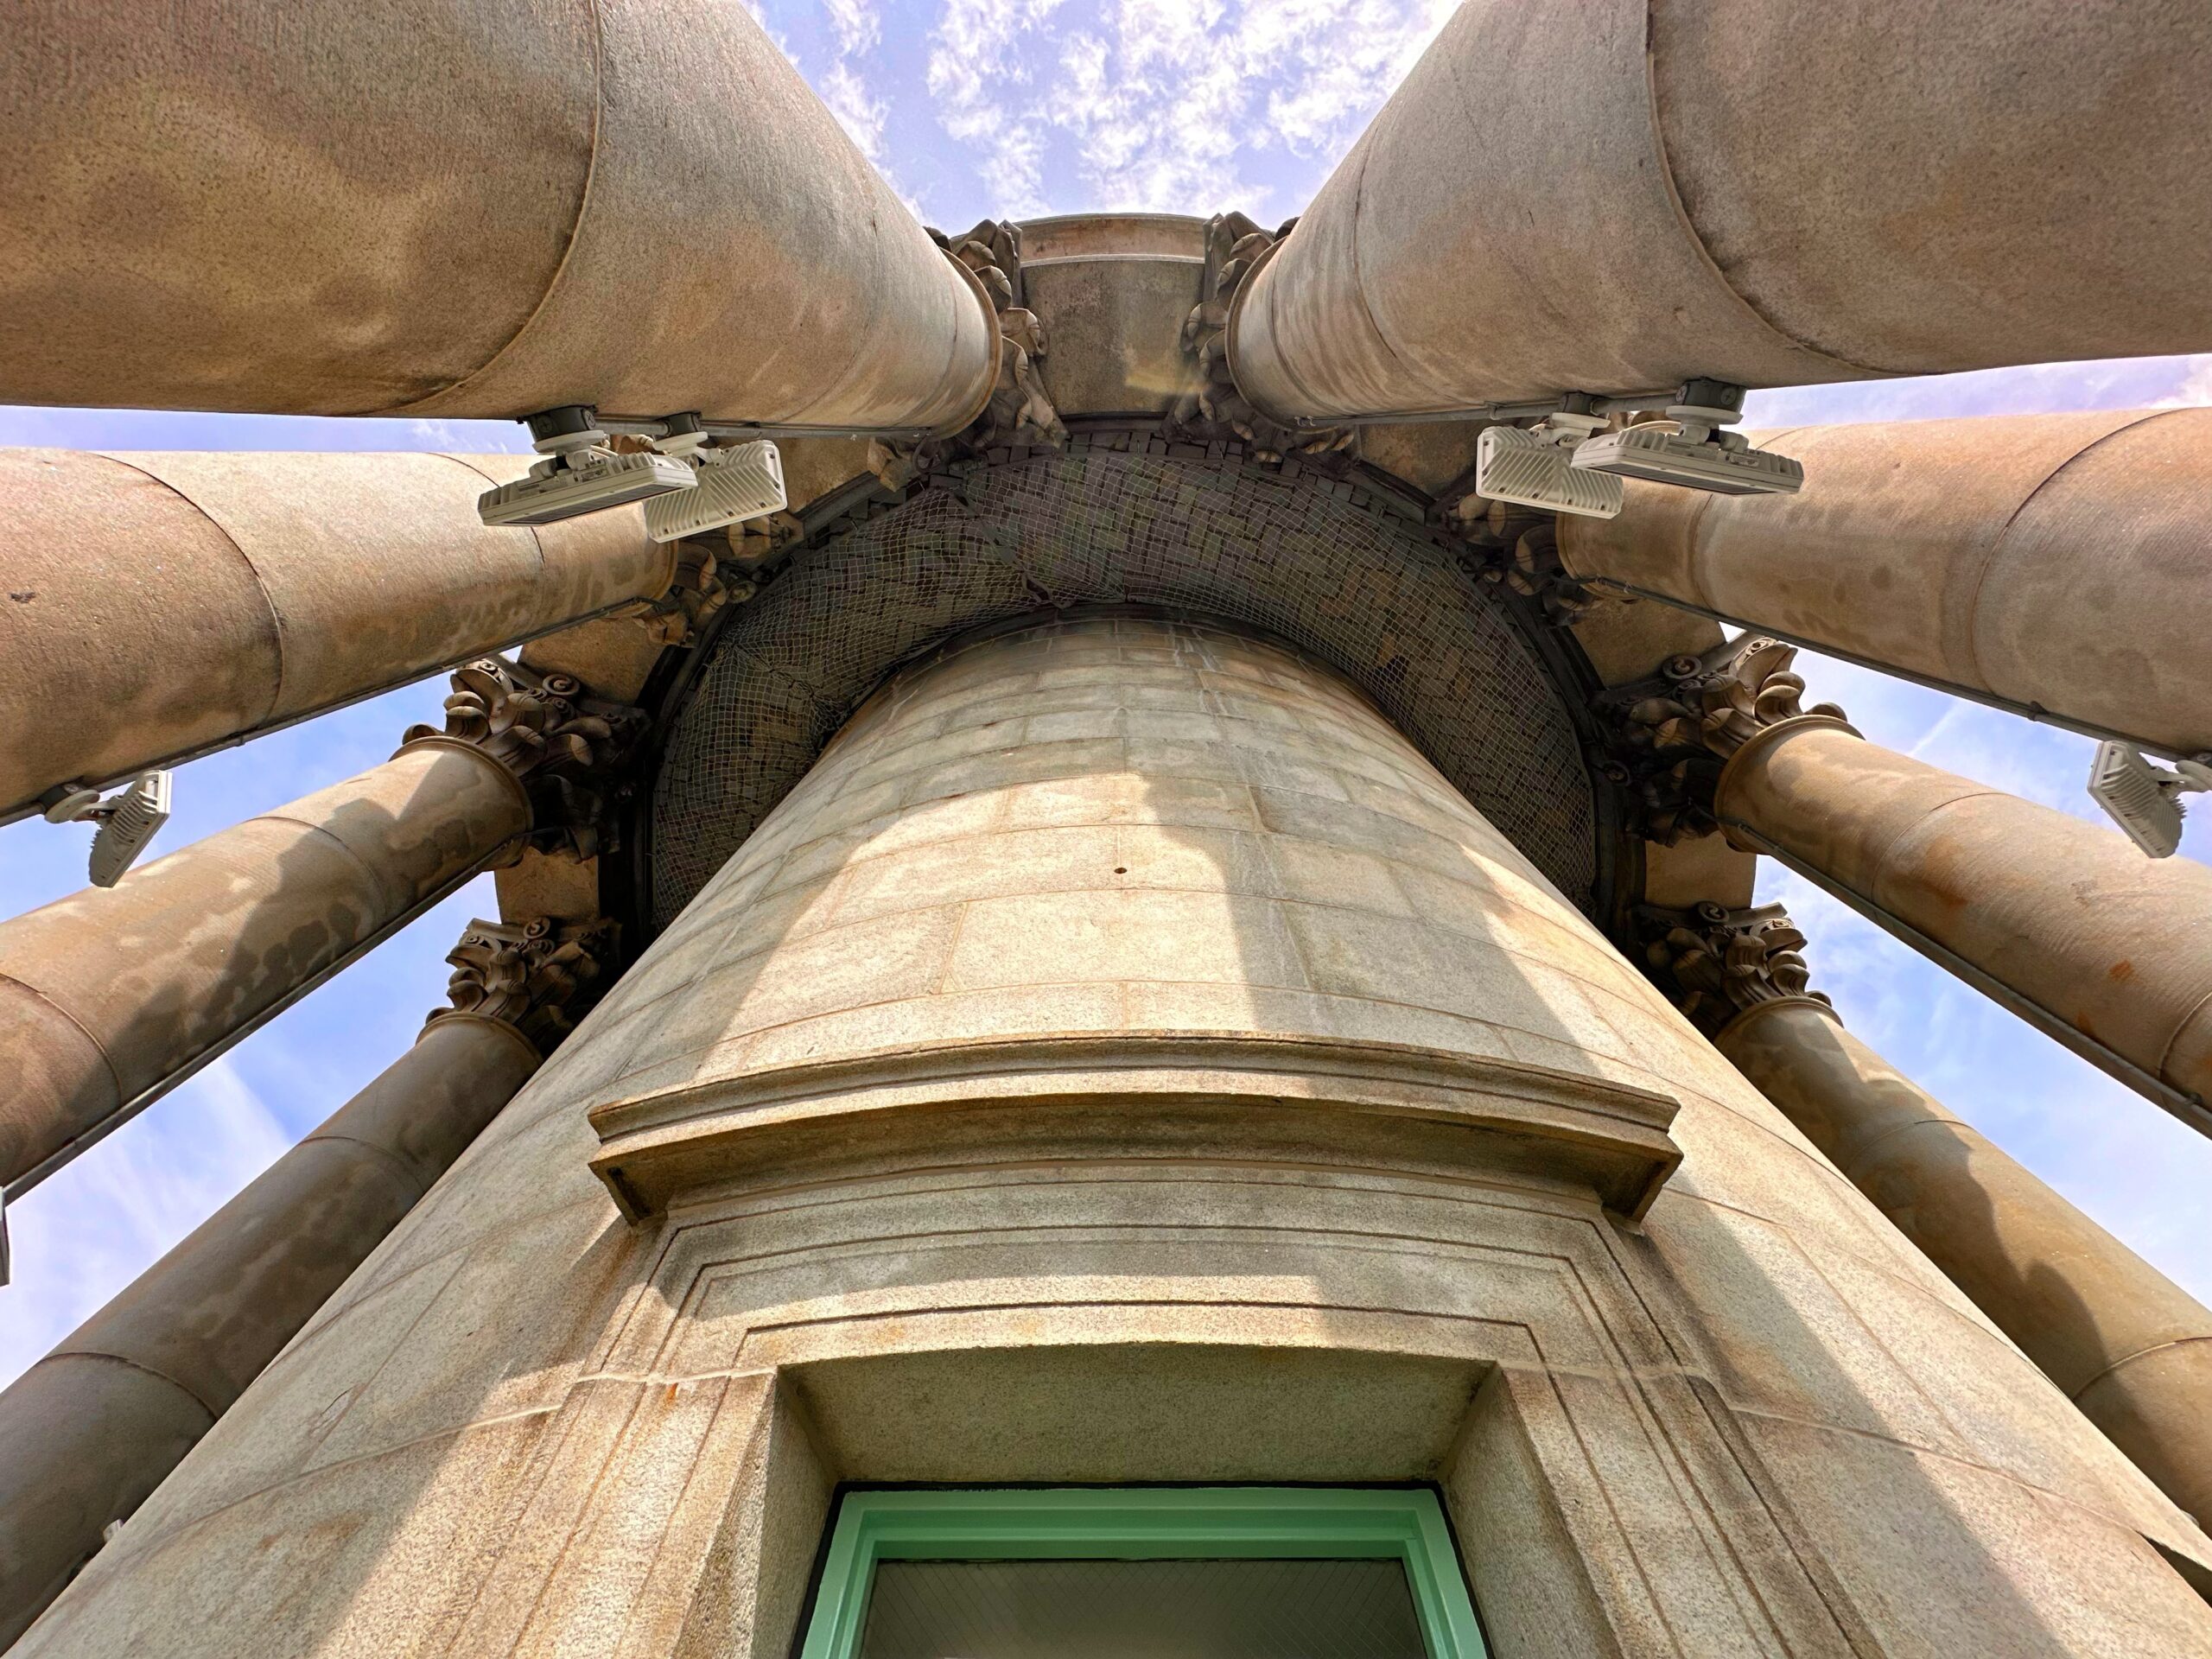
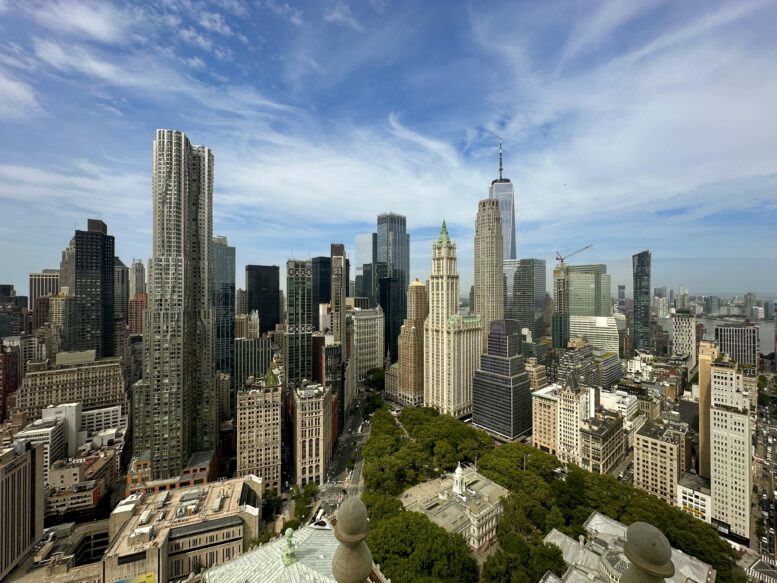
Looking up at the top of the cupola at 1 Centre Street. Photo by Michael Young.
Permits listed by unit count per filing
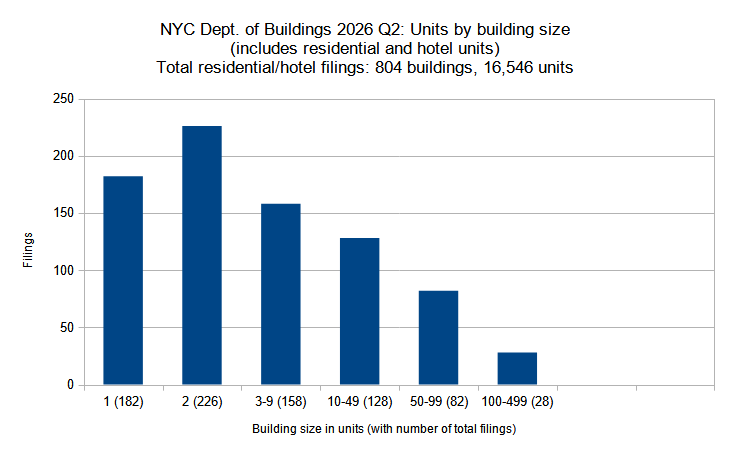
New residential and hotel construction permits filed in New York City in the second quarter (Q2) of 2026, grouped by unit count per filling. Data source: the Department of Buildings. Data aggregation and graphics credit: Vitali D. Ogorodnikov.
Below are filing size categories listed per type, with number of permits filed in Q2 2026 for each (804 total residential and hotel filings):
- Single-family – 182 permits (23 percent of quarterly total)
- Two-family – 226 permits (28 percent)
- Three to nine units – 158 permits (20 percent)
- Ten to 49 units – 128 permits (16 percent)
- 50 to 99 units – 82 permits (10 percent)
- 100 to 499 units – 28 permits (3 percent)
A trendline change between the first two quarters of 2026 may be noted in the overall unit count per filing: Compared to the prior quarter, residential and hotel filings in Q2 generally became smaller. The three categories with permit filings counting between one and nine units all noted considerable growth between the two quarters, while each of the categories with ten or more units noted permit filing decreases during the period.
Below are the top ten permit filings with the highest unit counts for the quarter:
- 35 Inspiration Lane in East New York, Brooklyn (460 units)
- 80 West 67th Street in Lincoln Square, Manhattan (430 units)
- 2366 Bedford Avenue in Flatbush, Brooklyn (354 units)
- 350 Grand Concourse in Mott Haven, The Bronx (304 units)
- 1185 River Avenue in West Concourse, The Bronx (292 units)
- 164-02 Jamaica Avenue in Jamaica, Queens (285 units)
- 162nd Street in Jamaica, Queens (227 units)
- 530 Utica Avenue in Prospect Lefferts Gardens, Brooklyn (224 units)
- 12040 Flatlands Avenue in East New York, Brooklyn (224 units)
- 12030 Flatlands Avenue in East New York, Brooklyn (206 units)
Of the top ten unit count filings for Q2, five are situated in Brooklyn, two in The Bronx and Queens each, and one in Manhattan. The latter accounts for the period’s second-highest unit-count filing, where the Upper West Side’s first supertall will rise at 80 West 67th Street. This trend contrasts sharply with the preceding quarter, where six out of ten of the largest unit-count filings were registered in Manhattan, with three more in Brooklyn and one in The Bronx.
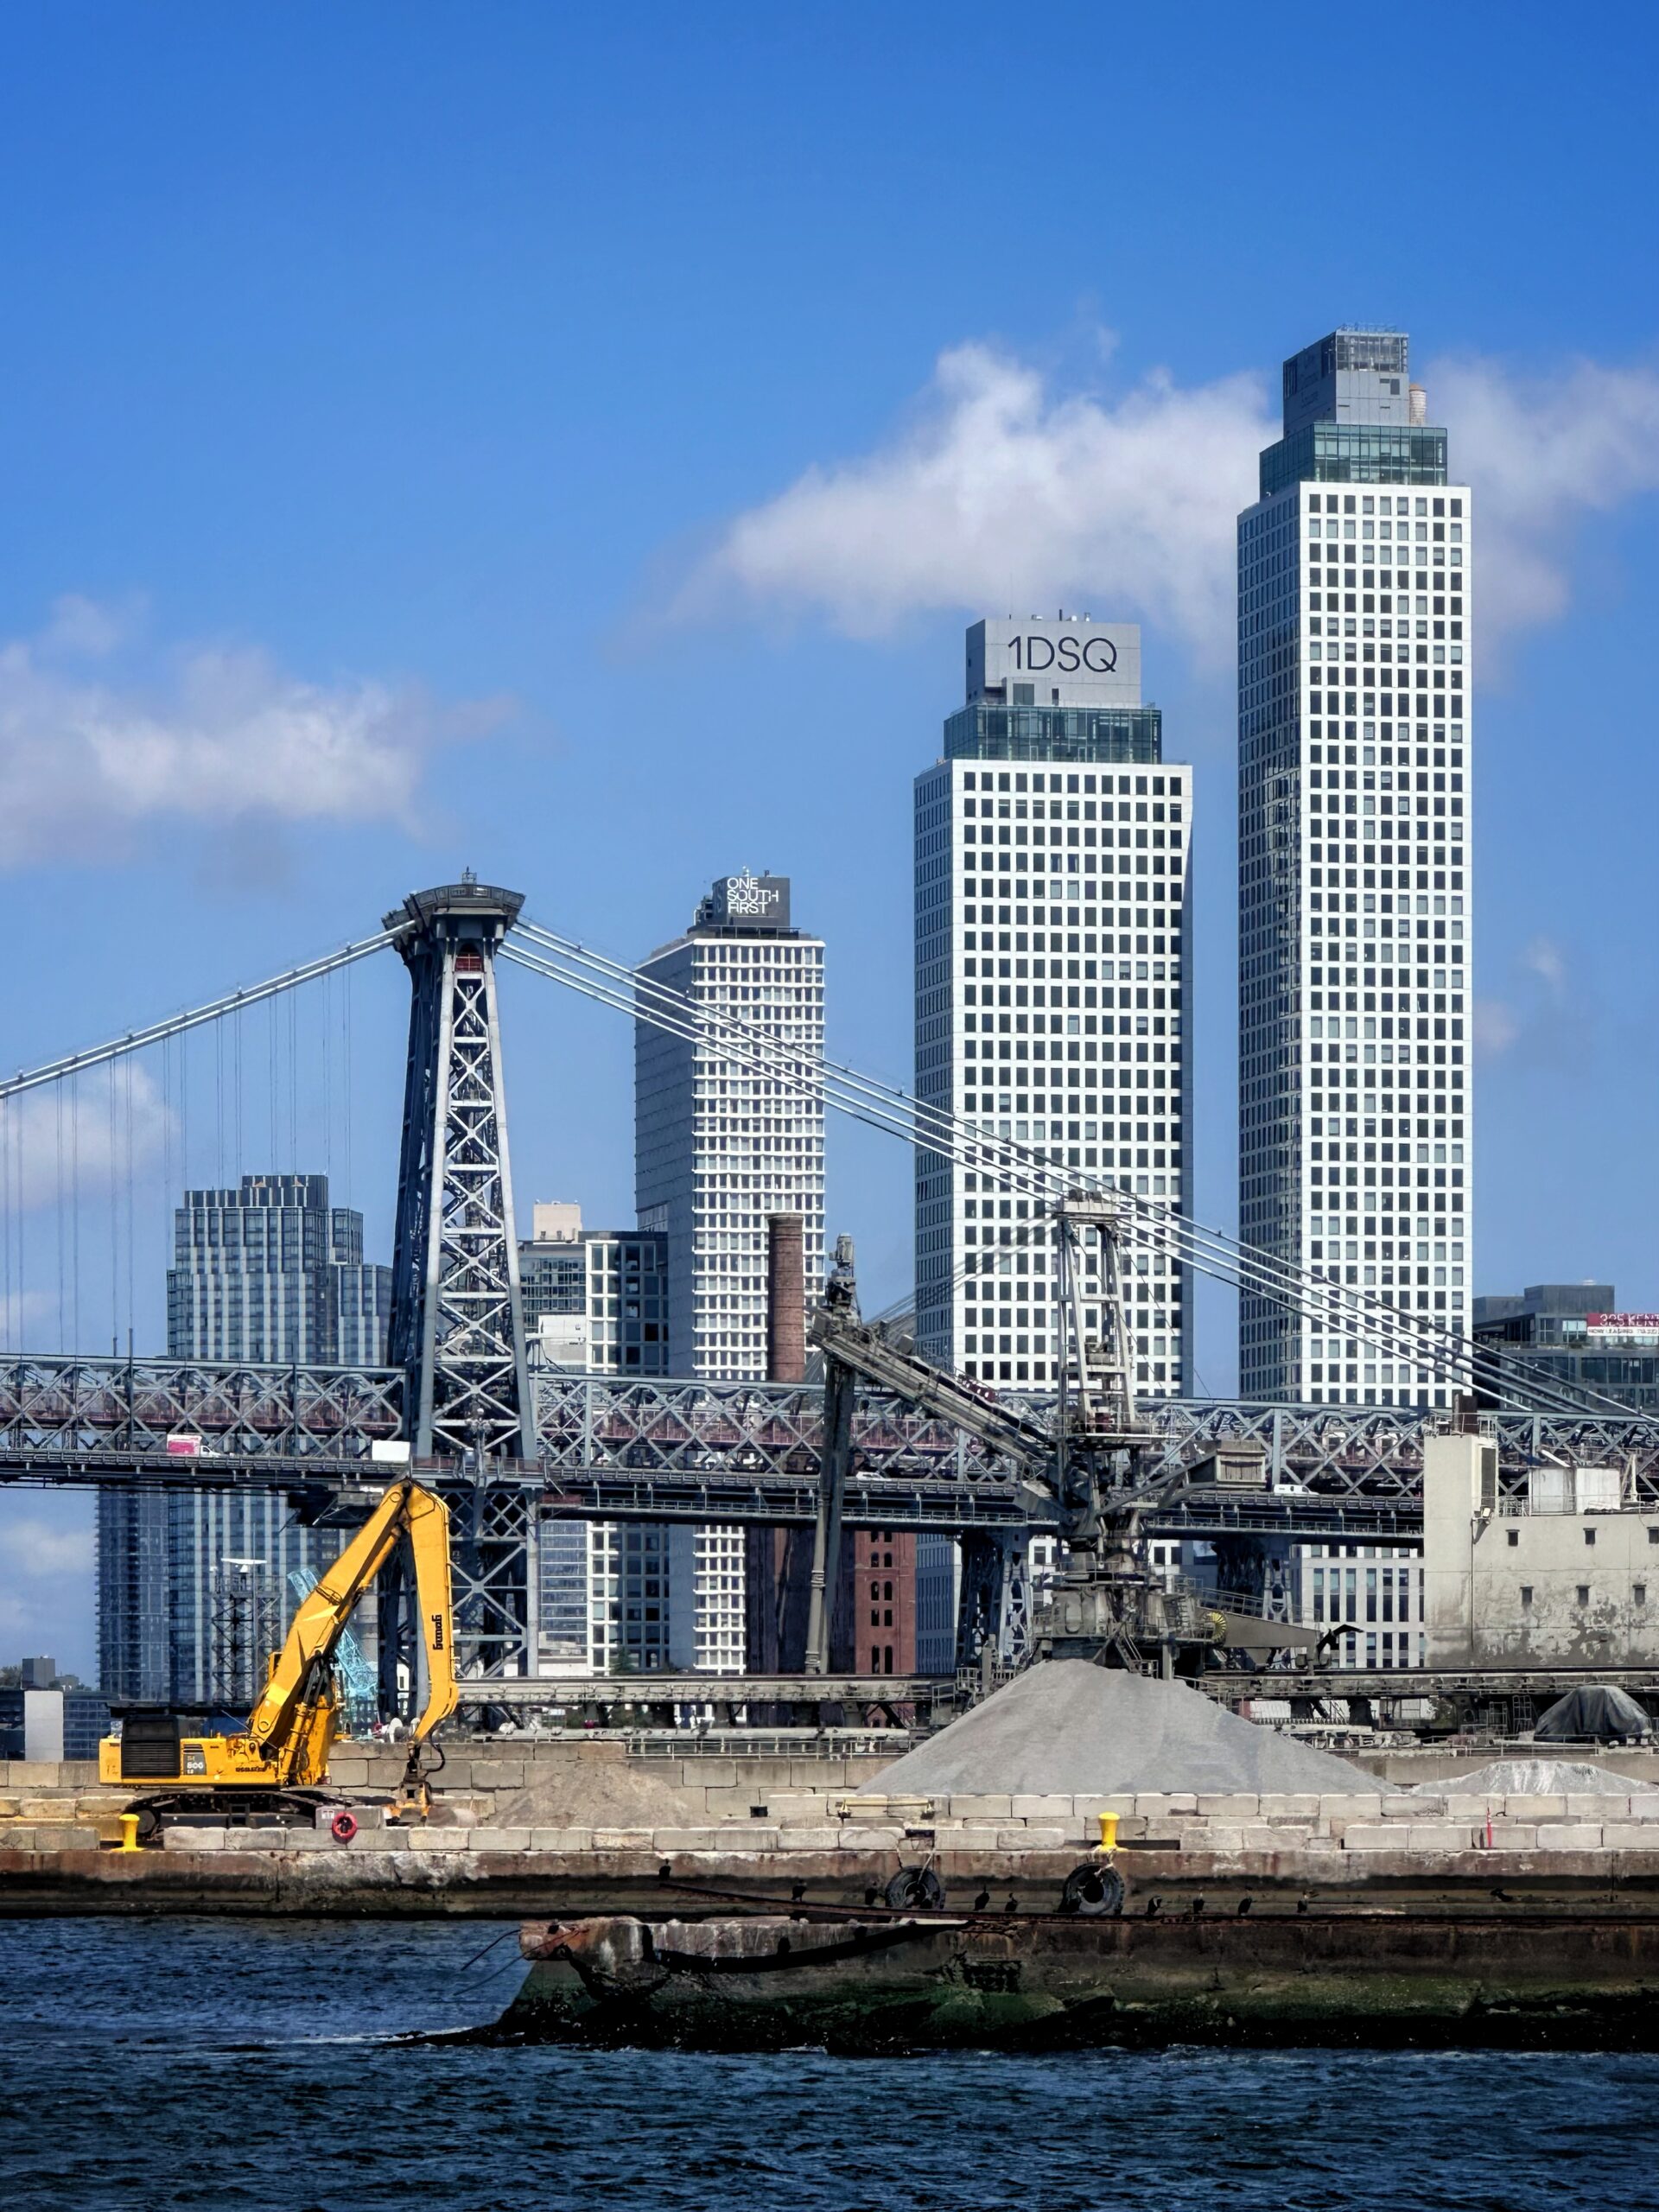
Williamsburg, Brooklyn. Photo by Michael Young.
Residential and hotel units filed per borough
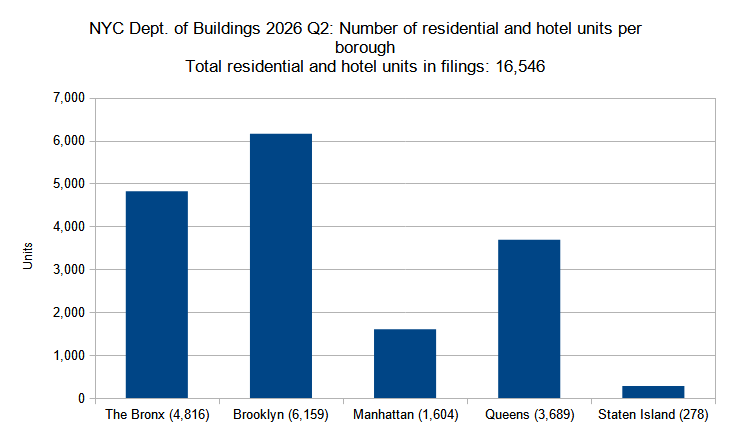
Number of residential and hotel units in new construction permits filed per borough in New York City in the second quarter (Q2) of 2026. Data source: the Department of Buildings. Data aggregation and graphics credit: Vitali Ogorodnikov
Below is the total number of residential and hotel units filed for in each borough in Q2 2026 (16,546 total unit filings):
- The Bronx – 4,816 residential and hotel units (29 percent of quarterly total)
- Brooklyn – 6,159 units (37 percent)
- Manhattan – 1,604 units (10 percent)
- Queens – 3,689 units (22 percent)
- Staten Island – 278 units (2 percent)
In the previous analysis we noted that of the top ten largest unit-count filings in the second quarter of 2026, only one was registered in Manhattan, versus six out of ten in the previous quarter. This sampling appears reflective of general quarterly unit count numbers plummeting for the borough during the period, dropping from more than 8,000 in Q1 to well under 2,000 in Q2.
Reflecting the overall lower number of newly filed units in the second quarter, each of the remaining four boroughs also saw a decrease in their overall tallies. Queens maintained the most stability, dipping from 3,916 units in Q1 to 3,689 units in Q2.
Below are the top permit filings with the highest unit counts for each borough in Q2 2026:
- The Bronx – 350 Grand Concourse in Mott Haven (304 units)
- Brooklyn – 35 Inspiration Lane in East New York (460 units)
- Manhattan – 80 West 67th Street in Lincoln Square (Upper West Side) (430 units)
- Queens – 164-02 Jamaica Avenue in Jamaica (285 units)
- Staten Island – 274 Victory Boulevard in Tompkinsville (75 units)
The notable unit count drop may be partially explained by an absence of extra-large residential proposals in Q2. None of the boroughs’ largest filings match the scale of those from the preceding quarter, such as the 1,458-unit proposal at 548 West 36th Street in Manhattan’s Hudson Yards, or Brooklyn’s 834-unit filing at 18 India Street in Greenpoint.
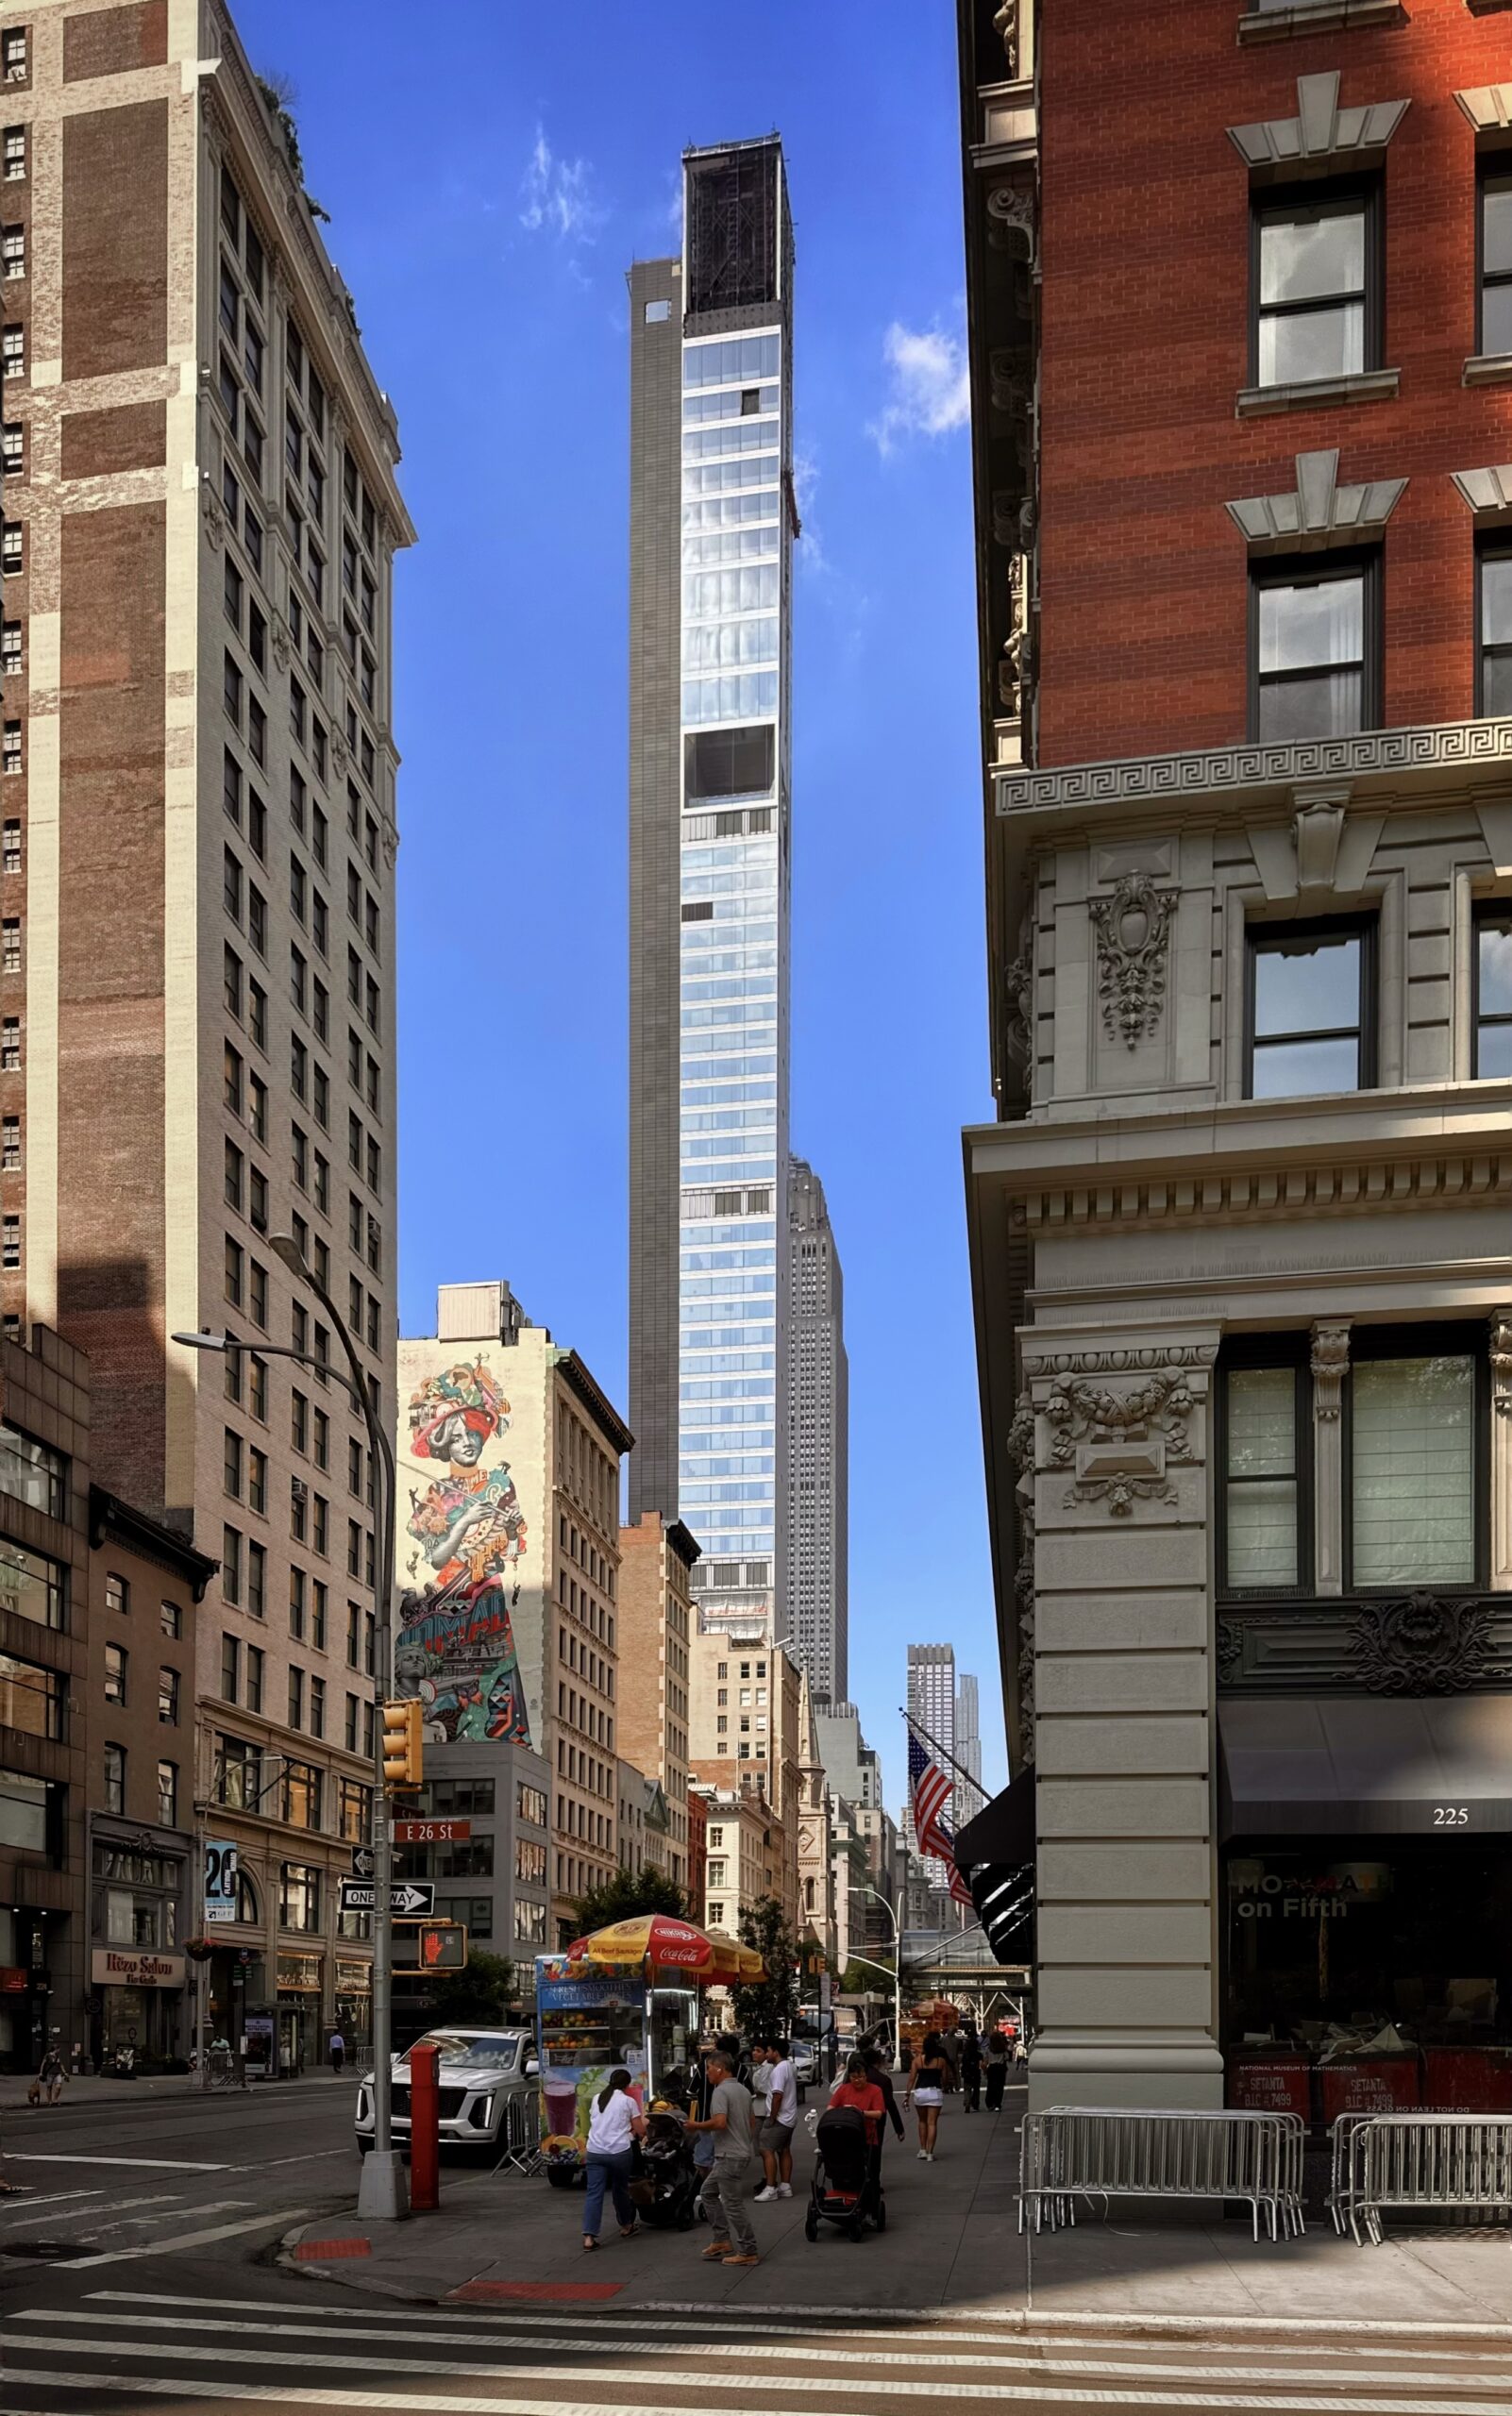
262 Fifth Avenue. Photo by Michael Young.
Permits listed by average unit count per filing
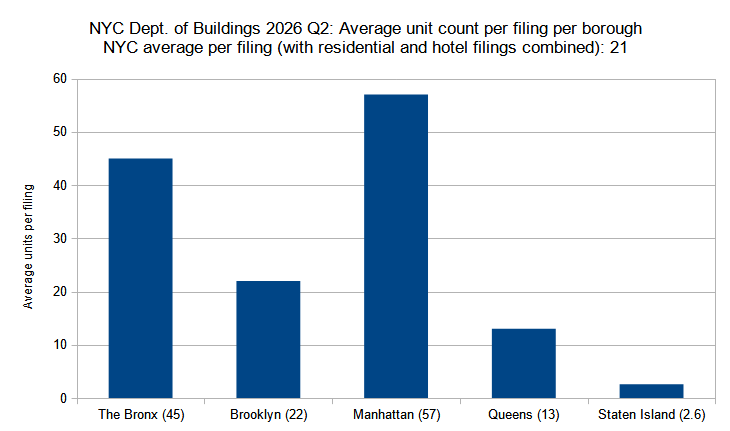
Average unit count (residential and hotel) per new construction permit per borough filed in New York City in the second quarter (Q2) of 2026. Data source: the Department of Buildings. Data aggregation and graphics credit: Vitali D. Ogorodnikov.
Below are the average numbers of units per residential or hotel filing in each borough for Q2 2026 (21 average units per residential or hotel filing):
- The Bronx – 45 residential or hotel units (114 percent above quarterly city average)
- Brooklyn – 22 units (5 percent above average)
- Manhattan – 57 units (171 percent above average)
- Queens – 13 units (38 percent below average)
- Staten Island – 2.6 units (88 percent below average)
Previous analyses note that residential building permit filings have, on average, gotten somewhat smaller between the first and the second quarter of 2026, with Q2 notably lacking particularly large filings in the residential category. This trend is well illustrated by a quarterly comparison where four out of five boroughs noted decreases between average unit counts for residential and hotel filings. Staten Island is the lone exception, maintaining the same figure for Q1 and Q2.
Between Q1 and Q2, the average unit count for filing dropped slightly in The Bronx, slipping from 58 to 45 average units; roughly halved in Brooklyn (from 46 in Q1 to 22 in Q2); fell by two-thirds in Manhattan (from 151 to 57); and approximately halved in Queens (from 23 to 13).
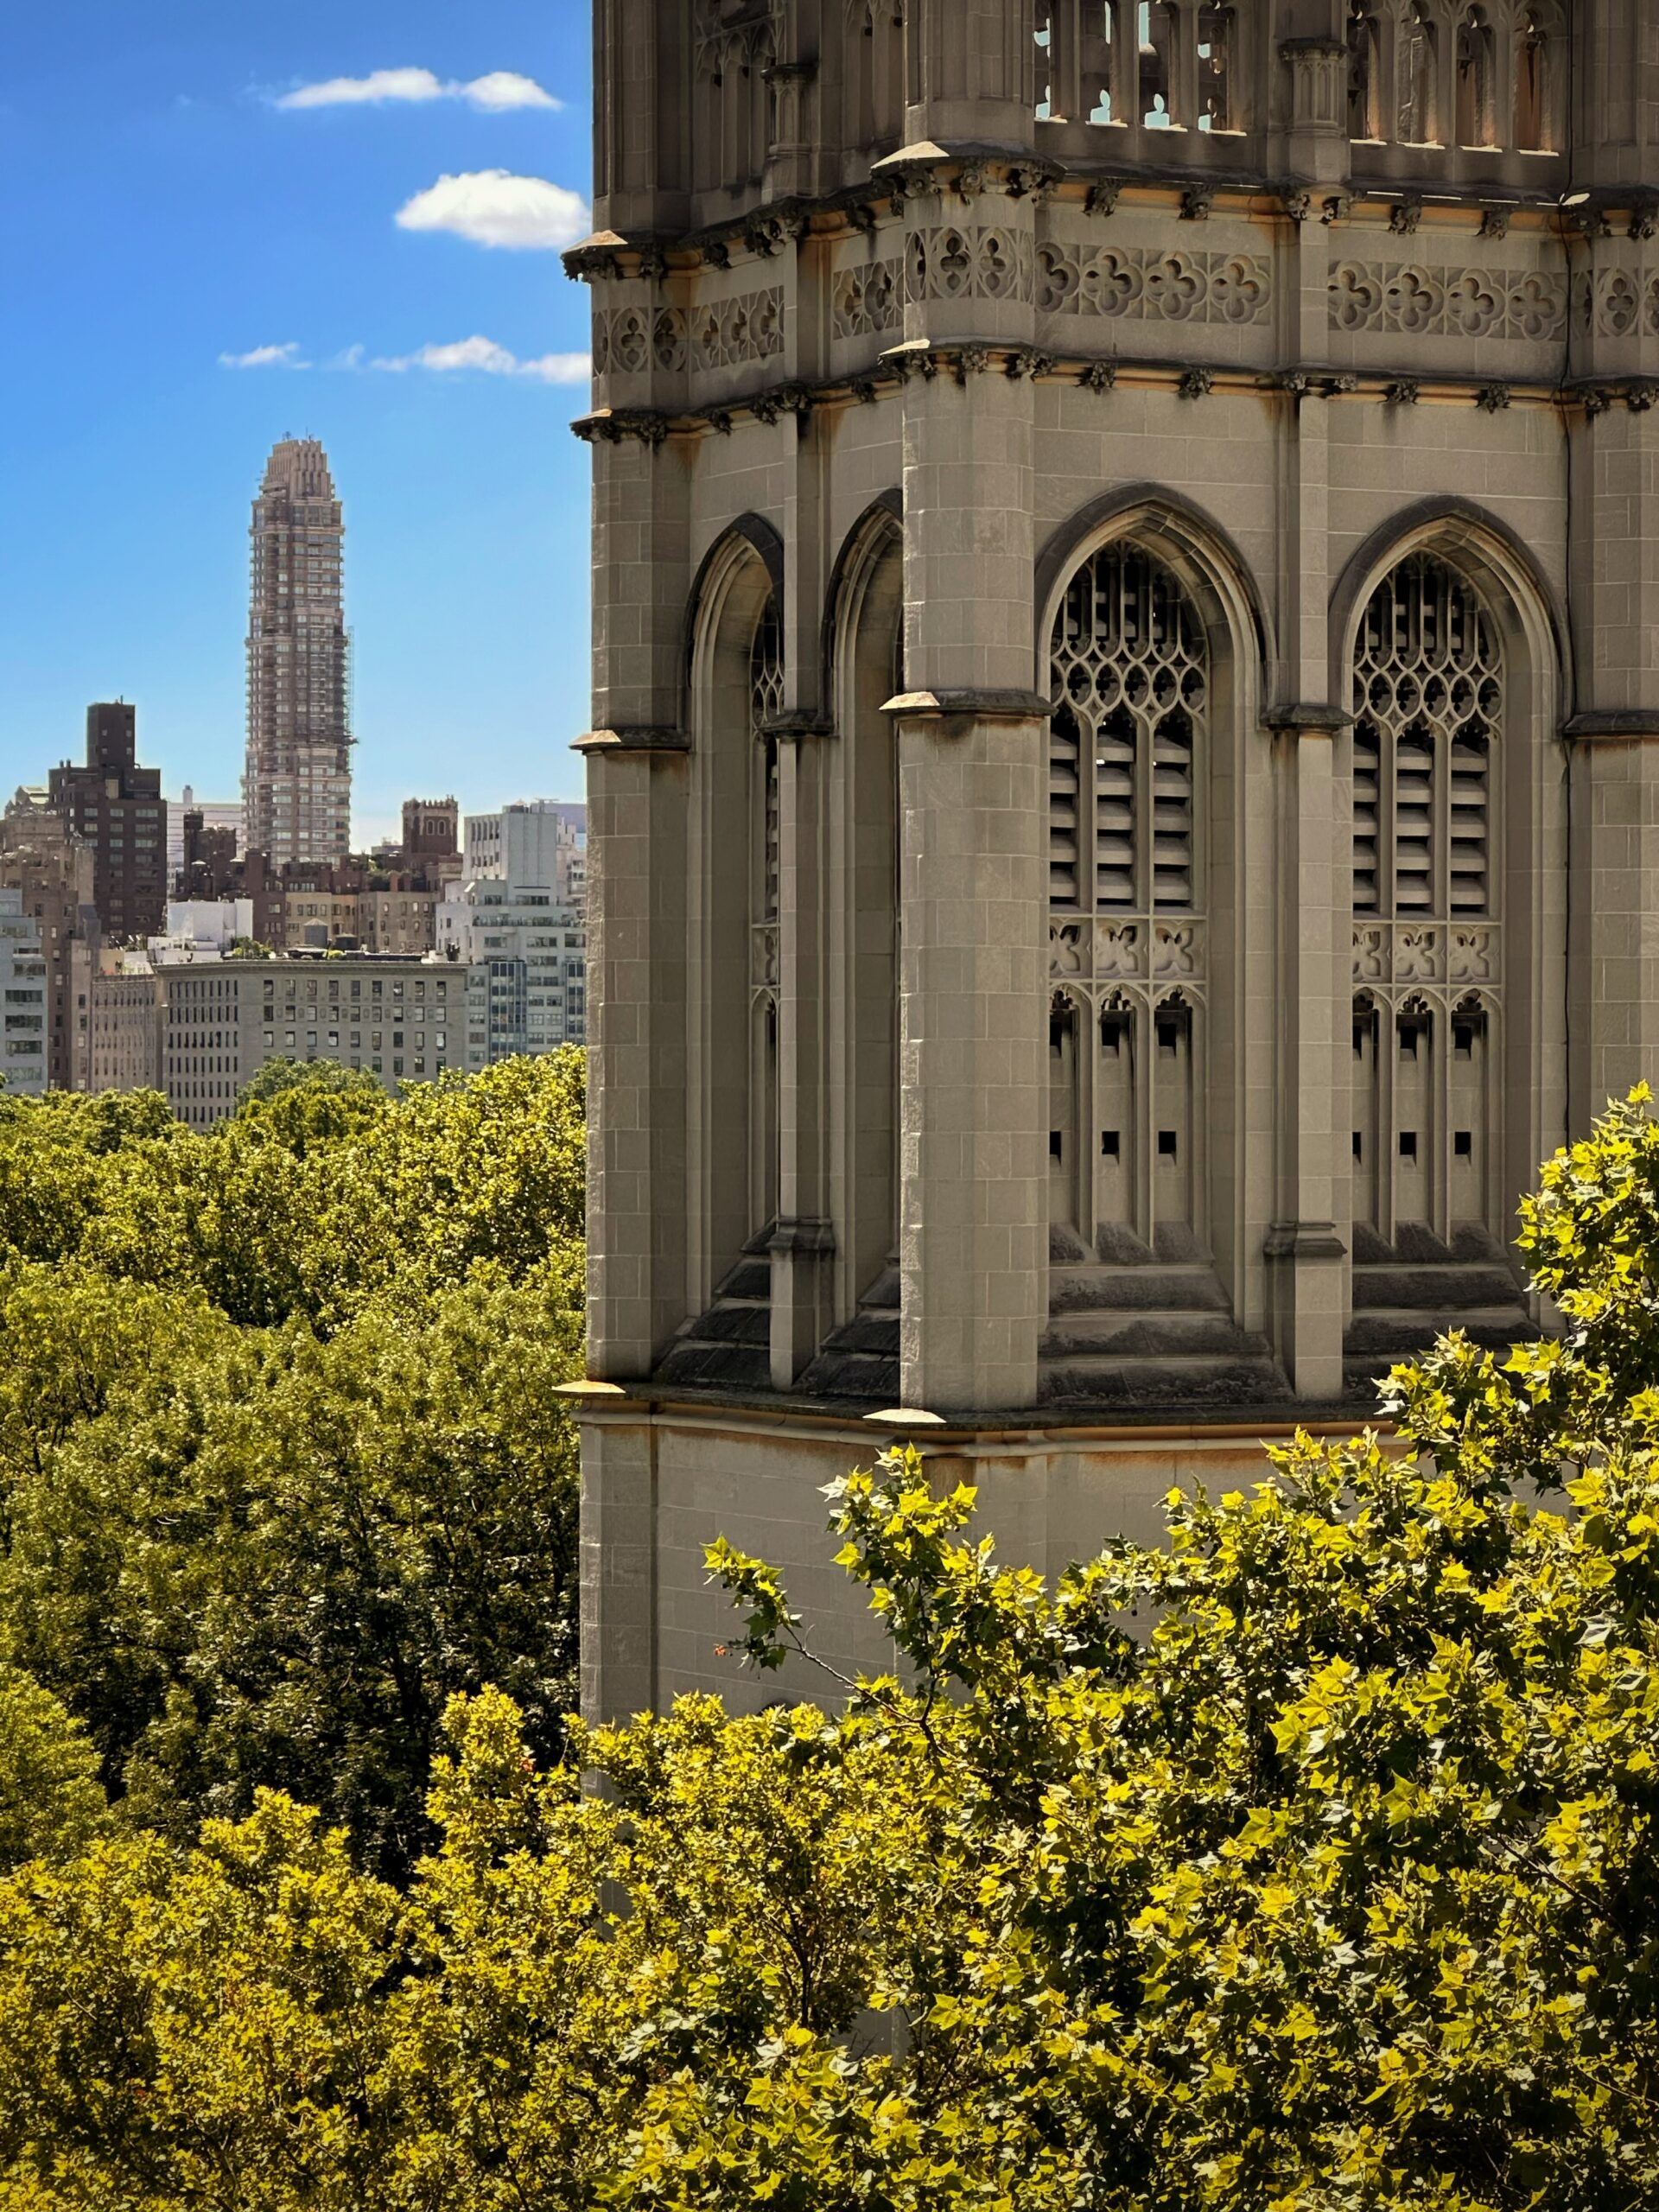
Central Park West. Photo by Michael Young.
Permit filings by floor count category
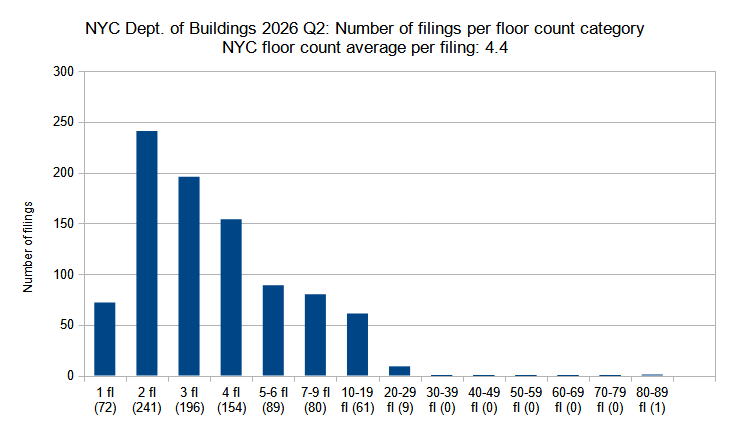
New construction permits filed in New York City in the second quarter (Q2) of 2026, grouped by floor count. Data source: the Department of Buildings. Data aggregation and graphics credit: Vitali D. Ogorodnikov.
Below are the numbers of new building permits filed in Q2 2026 for each floor count category (903 total permits):
- Single-story – 72 permits (8 percent of quarterly total)
- Two-story – 241 permits (27 percent)
- Three-story – 196 permits (22 percent)
- Four-story – 154 permits (17 percent)
- Five to six floors – 89 permits (10 percent)
- Seven to nine floors – 80 permits (9 percent)
- Ten to 19 floors – 61 permits (7 percent)
- 20 to 29 floors – 9 permits (1 percent)
- 80 to 89 floors – 1 permit (0.1 percent)
Floor count averages also decreased between the first and second quarters of 2026, though not as steeply as the unit count averages. Between the two categories, permit filing totals for the six low-rise categories, with planned buildings below ten stories, either remained largely the same or increased, with the greatest growth between the two quarters observed for the two-story category, which skyrocketed from 133 in Q1 to 241 in Q2.
Conversely, most of the high-rise categories for ten or more stories noted decreases between the two quarters, with only one building in the second quarter rising 30 floors or higher. This exception is notable: the 86-story, 1,100-plus-foot-tall skyscraper that is slated to rise at 80 West 67th Street in Lincoln Square as the city’s northernmost supertall and the first tower of this scale on the Upper West Side.
Below are the top ten permit filings with the highest floor counts, in order:
- 80 West 67th Street in Lincoln Square (Upper West Side), Manhattan (86 floors)
- 164-02 Jamaica Avenue in Jamaica, Queens (28 floors)
- 37-09 36th Avenue in Dutch Kills (Astoria), Queens (26 floors, tie)
- 35-43 37th Street in Dutch Kills (Astoria), Queens (26 floors, tie)
- 40-16 35th Avenue in Dutch Kills (Astoria), Queens (26 floors, tie)
- 35-25 Steinway Street in Dutch Kills (Astoria), Queens (23 floors)
- 317 Broadway in Tribeca, Manhattan (21 floors)
- 307 Bond Street in Gowanus, Brooklyn (20 floors, tie)
- 146 East 21st Street in Gramercy Park, Manhattan (20 floors, tie)
- 1185 River Avenue in West Concourse, The Bronx (20 floors, tie)
Of the top ten permit filings with the highest floor counts for the second quarter of 2026, five are situated in Queens, with four in close proximity to one another in the Dutch Kills neighborhood at the junction of Long Island City and Astoria. Three more entries are found in Manhattan, and one apiece in The Bronx and Brooklyn.
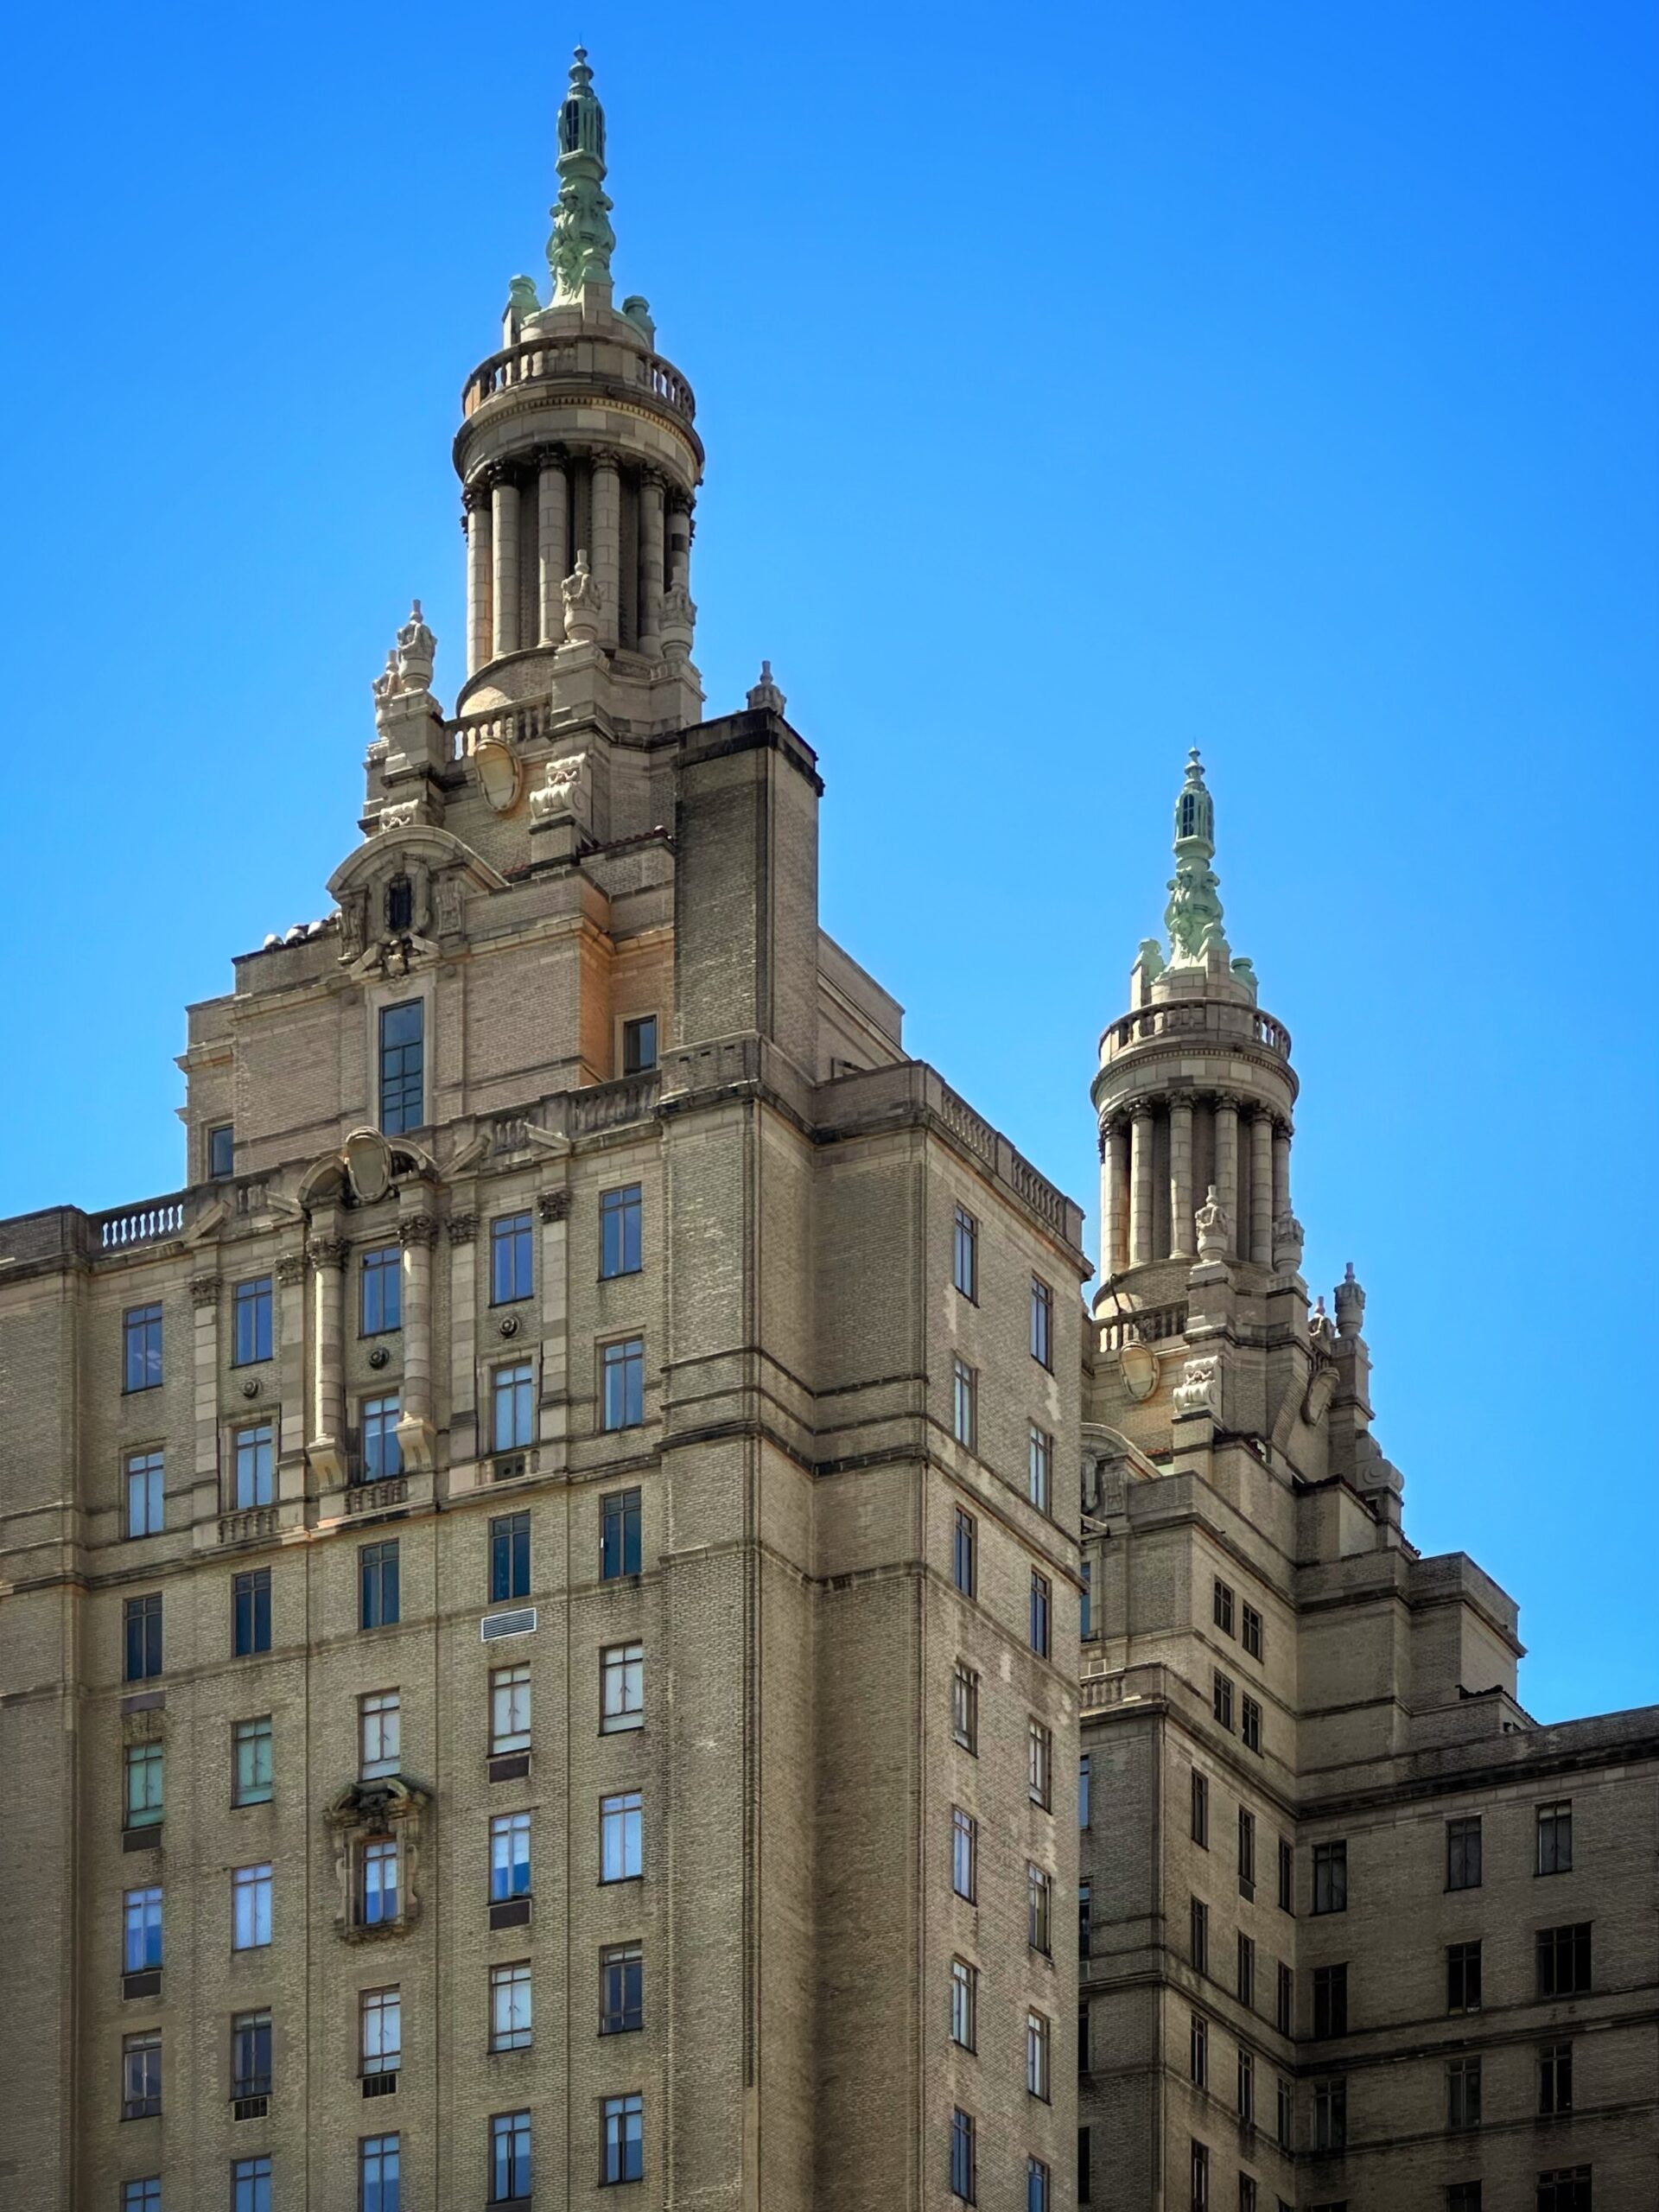
The San Remo. Photo by Michael Young.
Average number of floors per filing per borough
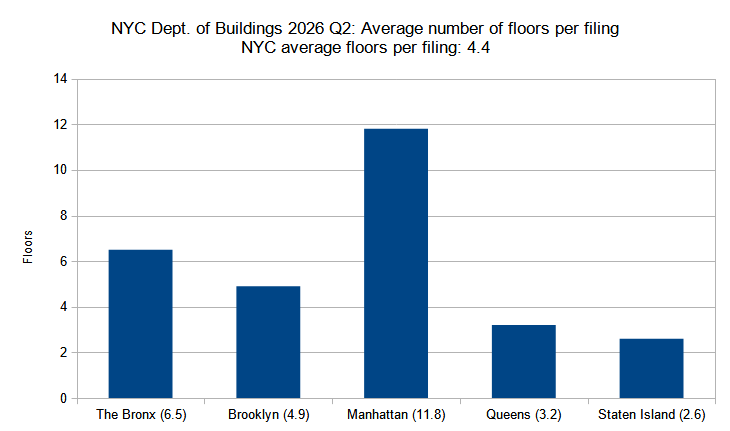
Average number of floors per new construction permit per borough filed in New York City in the second quarter (Q2) of 2026. Data source: the Department of Buildings. Data aggregation and graphics credit: Vitali D. Ogorodnikov.
Below is the average number of floors per filing per borough in Q2 2026 (with 4.4 floors as city average per filing):
- The Bronx – 6.5 floors (48 percent above quarterly city average)
- Brooklyn – 4.9 floors (11 percent above average)
- Manhattan – 11.8 floors (168 percent above average)
- Queens – 3.2 floors (27 percent below average)
- Staten Island – 2.6 floors (41 percent below average)
The overall trendline for average floor counts per new building filings between the boroughs remained largely constant between the first and second quarters of 2026. Manhattan still has by far the highest average floor count per filing, with The Bronx, Brooklyn, Queens, and Staten Island trailing well behind, in decreasing order.
On the other hand, a notable change took place in a decrease of average floor counts per individual permit filing in each borough. Reflecting the city’s average filing floor count drop from 6.3 in Q1 to 4.4 in Q2, Manhattan’s total plunged from 19.1 in Q1 to 11.8 in Q2; The Bronx slipped from 7.3 to 6.5; and Brooklyn went from 7.1 to 4.9. Queens and Staten Island, with averages in the low-rise category, saw slighter decreases, with the former dropping from an average of 3.9 floors in Q1 down to 3.2 in Q2 and the latter by a negligible 0.1 floors, from 2.7 in Q1 to 2.6 in Q2.
The following are the permit filings with the highest floor counts in each borough:
- The Bronx – 1185 River Avenue in West Concourse (20 floors)
- Brooklyn – 307 Bond Street in Gowanus (20 floors)
- Manhattan – 80 West 67th Street in Lincoln Square (Upper West Side) (86 floors)
- Queens – 164-02 Jamaica Avenue in Jamaica (28 floors)
- Staten Island – (Several at 5 floors each)
The top place holders for each borough reflect local zoning and political climates rather than their respective borough’s transit and infrastructure capability for accommodating higher floor counts.
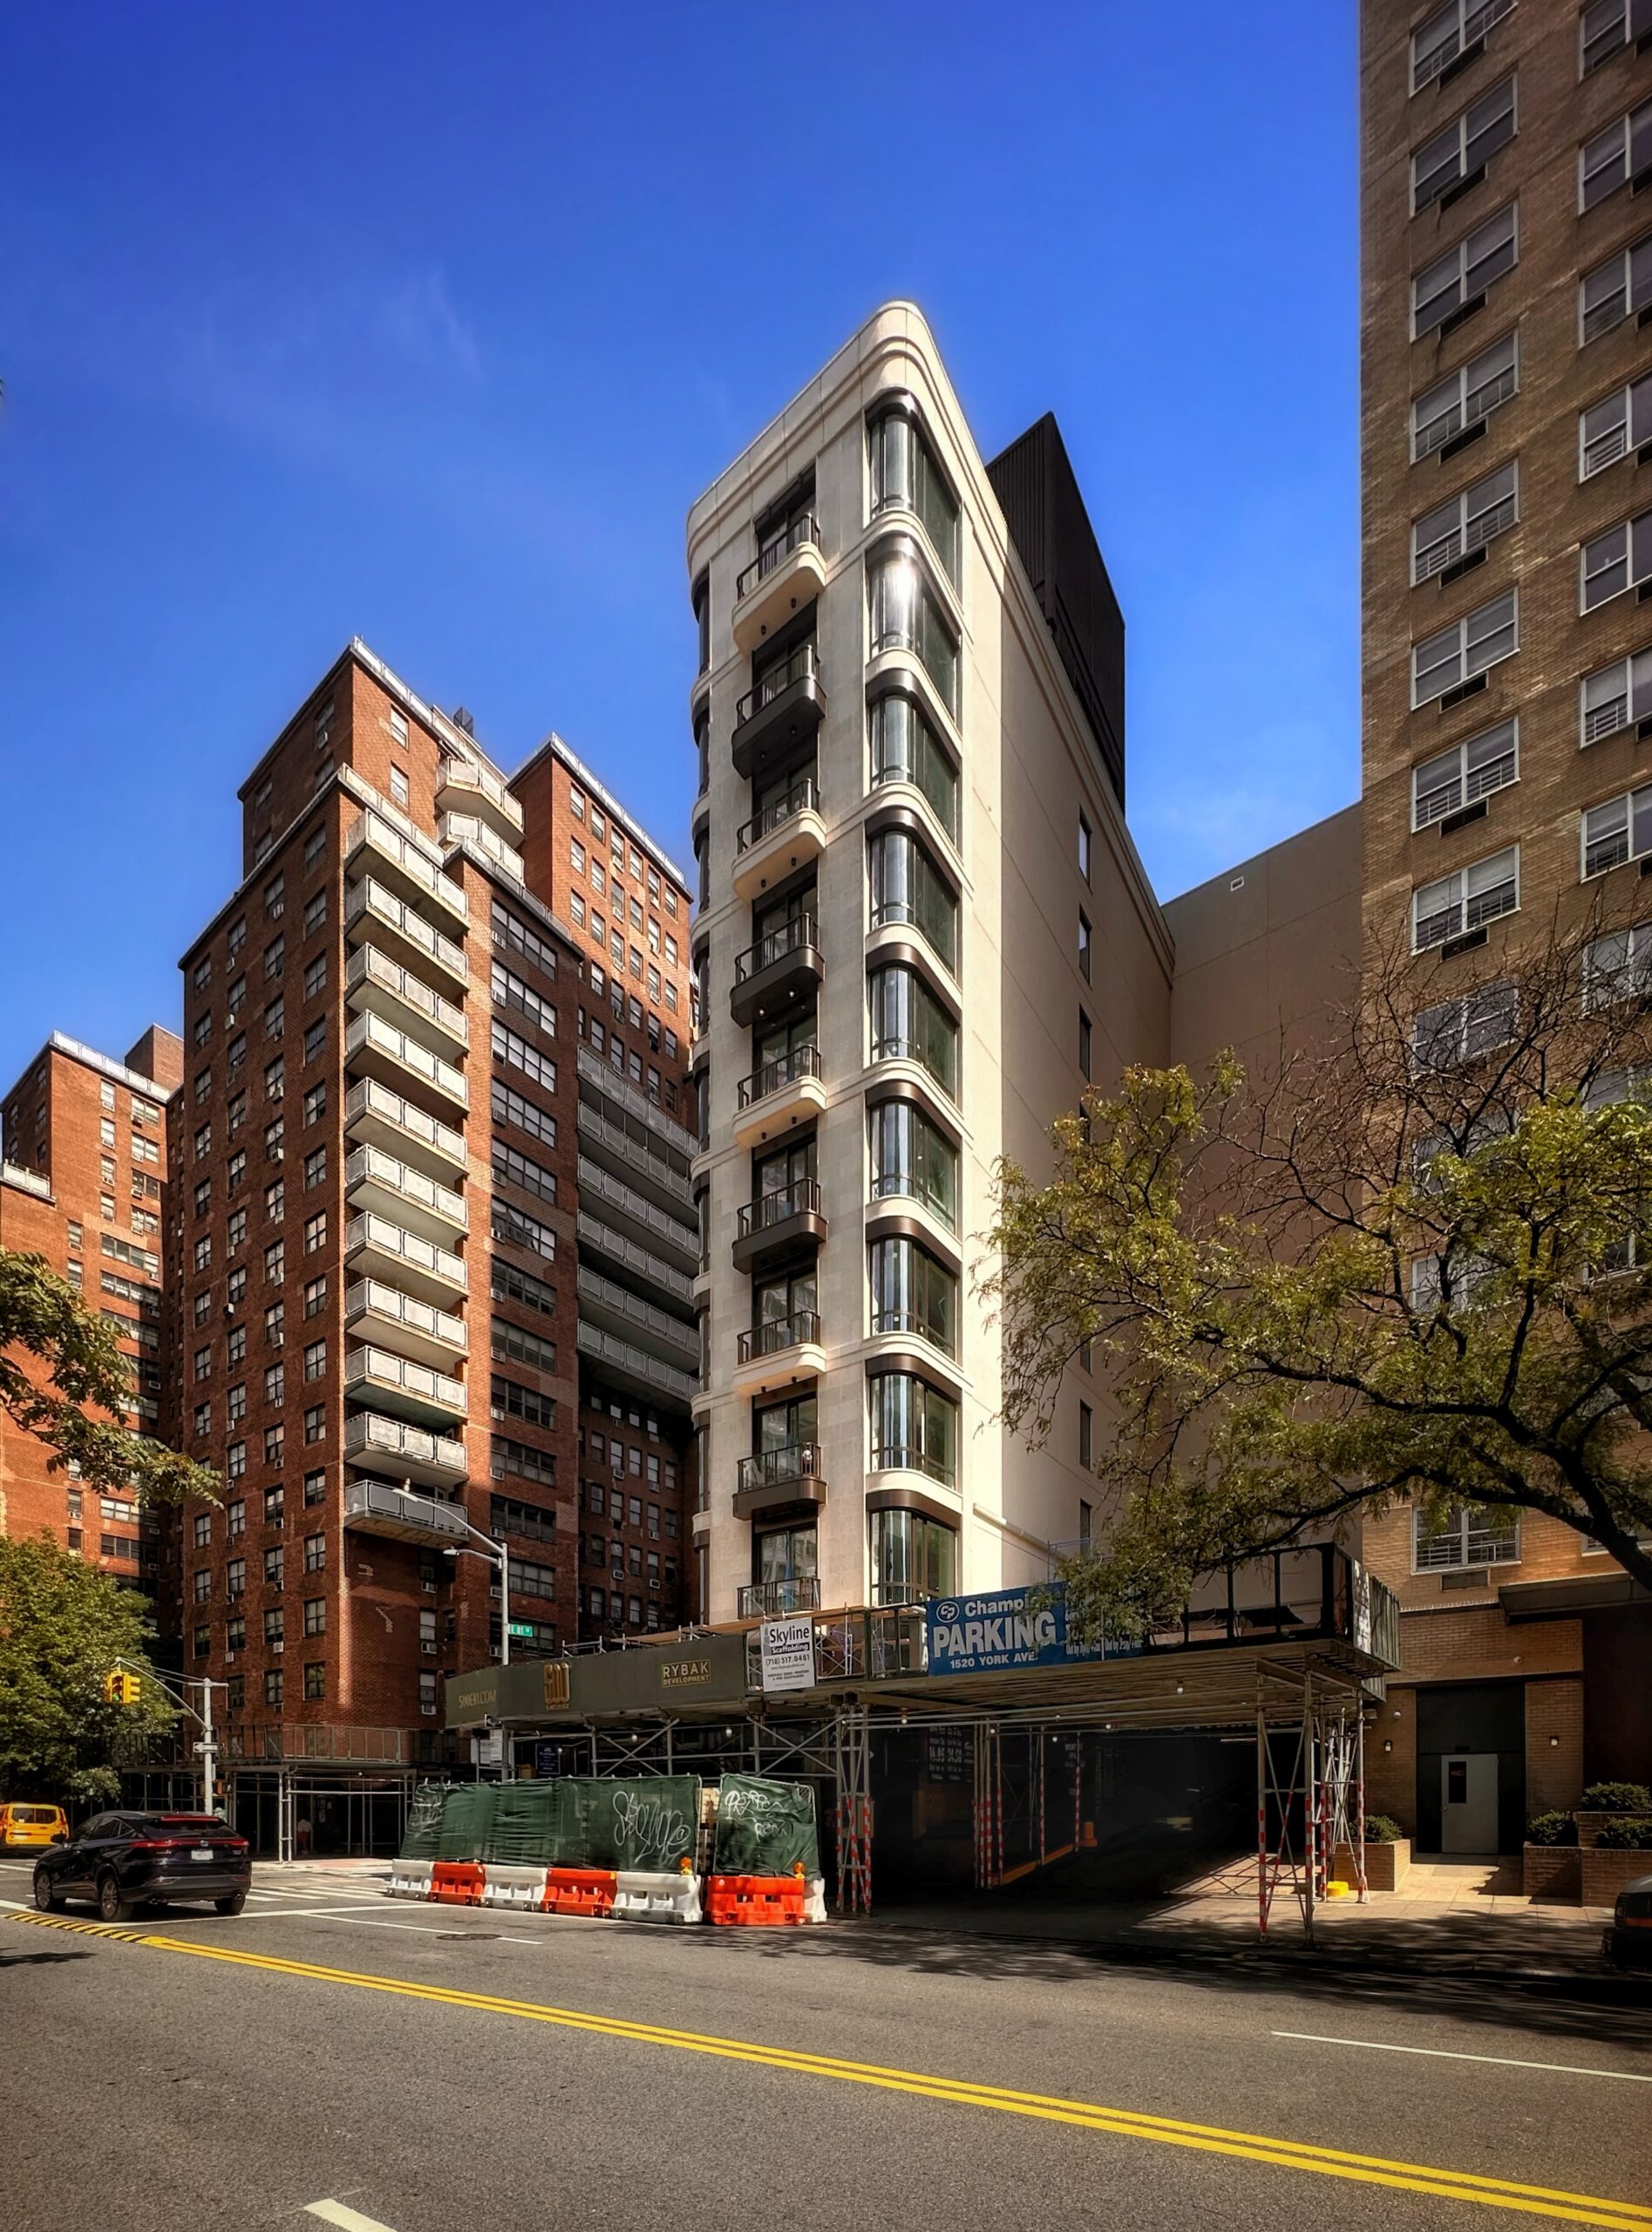
500 East 81st Street. Photo by Michael Young.
The supertall proposal at 80 West 67th Street in Manhattan was allowed to rise as high as it is currently planned because of its particular site, the former location of the ABC Network headquarters, which is rather generously zoned for its Upper West Side location. However, its high-rise surroundings, walking proximity to Midtown, and some of the city’s finest transit access easily justify the height and density at the site.
The Brooklyn champion for the second quarter, a 20-story tower at 307 Bond Street, is in keeping with the surrounding residential development rapidly rising in the formerly industrial district stretching along the Gowanus Canal.
The highest floor-count proposal in Queens, slated for 164-02 Jamaica Avenue in Jamaica, is limited in height by its proximity to the JFK Airport, with its 28 stories being about as high as may be reasonably expected at the site.
On the other hand, the proposal at 1185 River Avenue in West Concourse, The Bronx could have been higher than its proposed 20 stories, given its immediate subway adjacency, relative proximity to the city’s central business district, and ample ongoing high-rise development in the vicinity.
Once again, none of Staten Island’s proposals for the quarter are slated to rise higher than only five stories. Although the least densely populated of all the city’s boroughs and the only one not connected to the rest of the city via subway, the island boasts a population of half a million residents, more than that of Miami proper. With such a population figure and relative proximity to Lower Manhattan, the borough should certainly be able to accommodate more dense development in vertical form.
256 East 4th Street. Photo by Michael Young.
Permits listed by floor area per filing
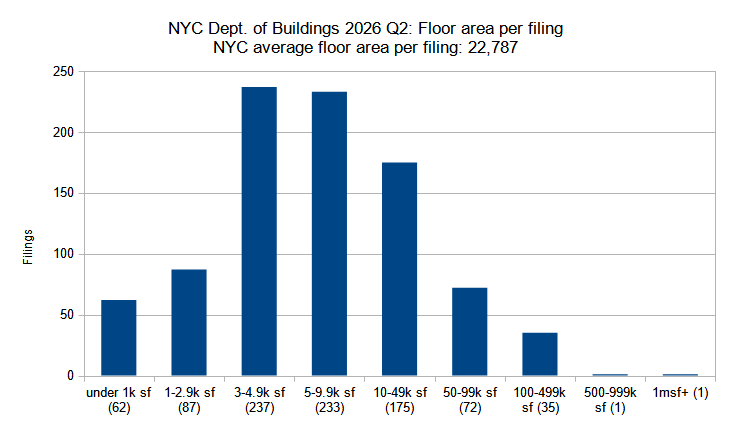
New construction permits filed in New York City in the second quarter (Q2) of 2026, grouped by total floor area. Data source: the Department of Buildings. Data aggregation and graphics credit: Vitali D. Ogorodnikov.
Below are new building permits filed for in Q2 2026 listed by square footage (903 permits total):
- Under 1,000 square feet – 62 permits (7 percent of quarterly total)
- 1,000 to 2,999 SF – 87 permits (10 percent)
- 3,000 to 4,999 SF – 237 permits (26 percent)
- 5,000 to 9,999 SF – 233 permits (26 percent)
- 10,000 to 49,999 SF – 175 permits (19 percent)
- 50,000 to 99,999 SF – 72 permits (8 percent)
- 100,000 to 499,999 SF – 35 permits (4 percent)
- 500,000 to 999,999 SF – 1 permit (0.1 percent)
- 1,000,000 SF and over – 1 permit (0.1 percent)
When ordered by proposed square footage, new building permits filed for in the second quarter closely reflect the ordering by floor counts, as taller proposals generally offer more space.
Nearly three-quarters of new building filings for Q2 2026 span between 3,000 and 50,000 square feet, with totals steeply dropping off in either direction. However, despite their relatively low count, the sheer size of each filing in the 50,000-square-foot-plus categories still accounts for around two-thirds (nearly 13.8 million square feet) of the total square footage filed for in the second quarter.
Below are the top ten permits with the largest floor area filed for in Q2 2026, listed in order:
- 80 West 67th Street in Lincoln Square (Upper West Side), Manhattan (1,644,540 square feet)
- 28-90 Review Avenue in Long Island City, Queens (682,459 SF)
- 35 Inspiration Lane in East New York, Brooklyn (493,057 SF)
- 380 Troutman Street in Bushwick, Brooklyn (437,580 SF)
- 350 Grand Concourse in Mott Haven, The Bronx (322,105 SF)
- 2366 Bedford Avenue in Flatbush, Brooklyn (321,747 SF)
- 164-02 Jamaica Avenue in Jamaica, Queens (290,561 SF)
- 1185 River Avenue in West Concourse, The Bronx (287,989 SF)
- 211 West 84th Street on the Upper West Side, Manhattan (227,743 SF)
- 12040 Flatlands Avenue in East New York, Brooklyn (215,550 SF)
The top ten new building permits with the largest floor area filed for in the second quarter of 2026 are spread out rather evenly between four boroughs, with four in Brooklyn and two apiece in The Bronx, Queens, and Manhattan.
The latter accommodates the largest filing, the supertall proposal at 80 West 67th Street in Lincoln Square on the Upper West Side. At more than 1,100 feet and 86 stories, the nearly block-sized development also happens to be the tallest proposal for the quarter.
1740 Broadway. Photo by Michael Young.
Total floor area filed by borough
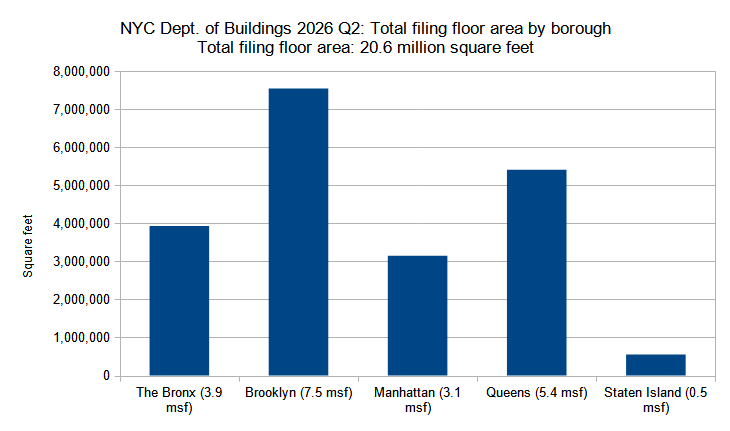
Combined floor area of new construction permits filed per borough in New York City in the second quarter (Q2) of 2026. Data source: the Department of Buildings. Data aggregation and graphics credit: Vitali D. Ogorodnikov.
Below are the square footage totals per borough for Q2 2026 (with a city total of 20.6 million square feet):
- The Bronx – 3.9 million square feet (19 percent of quarterly total)
- Brooklyn – 7.5 MSF (37 percent)
- Manhattan – 3.1 MSF (15 percent)
- Queens – 5.4 MSF (26 percent)
- Staten Island – 0.5 MSF (3 percent)
The general trend line for the total per-borough new building square footage filed for in the second quarter of 2026 is very similar to that of the total permit filings per borough, which we looked at near the beginning of the article. However, notable differences emerge upon a closer look, as the gaps between the individual boroughs are less pronounced than that of the per-borough permit tally, and the placement order differs somewhat.
As before, Brooklyn and Queens led the way, accounting for roughly one-third and one-quarter of the city’s 20.6 million-square-foot filed-for quarterly total, respectively. The Bronx represents roughly one-fifth of the city’s total filed-for square footage for the quarter, with Manhattan making up another 15 percent of the volume. Lastly, Staten Island’s half-million square-foot figure accounts for only 3 percent of the city’s filed-for square footage in the second quarter.
The following are the permit filings in each borough with the largest floor area:
- The Bronx – 350 Grand Concourse in Mott Haven (322,105 square feet)
- Brooklyn – 35 Inspiration Lane in East New York (493,057 SF)
- Manhattan – 80 West 67th Street in Lincoln Square (1,644,540 SF)
- Queens – 28-90 Review Avenue in Long Island City (682,459 SF)
- Staten Island – 274 Victory Boulevard in Tompkinsville (76,417 SF)
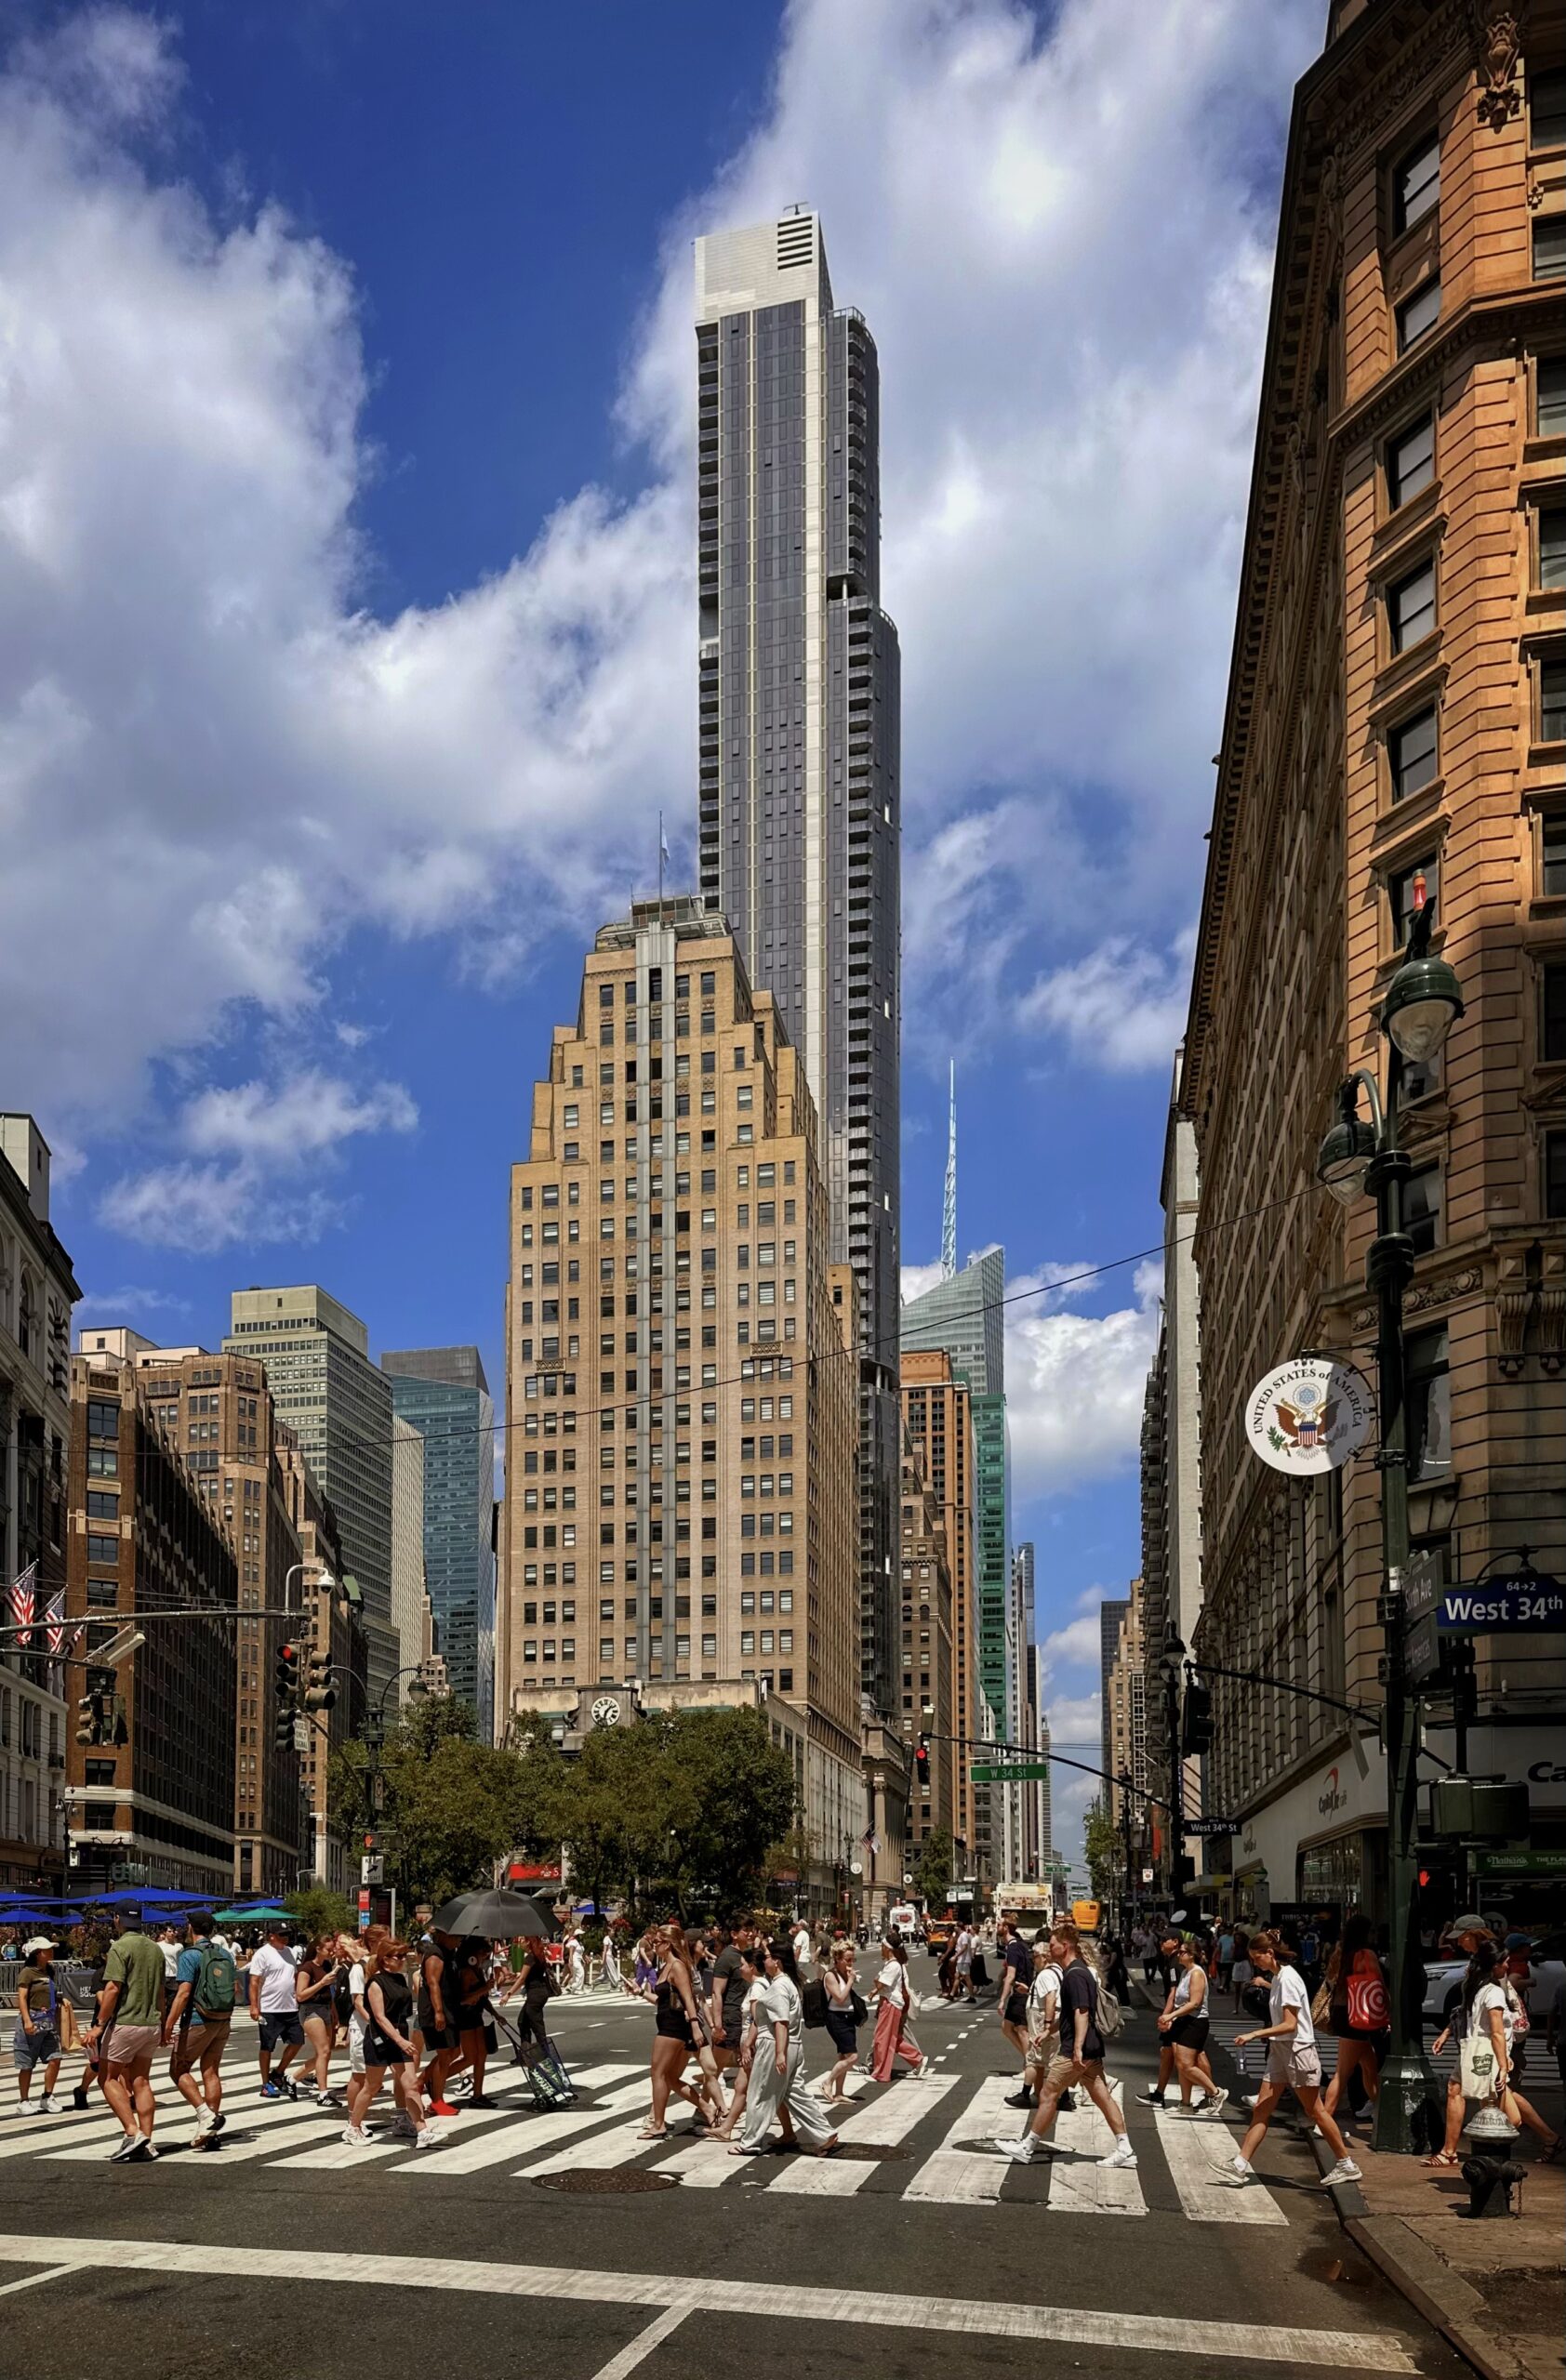
Casoni. Photo by Michael Young.
Average floor area per permit filing by borough
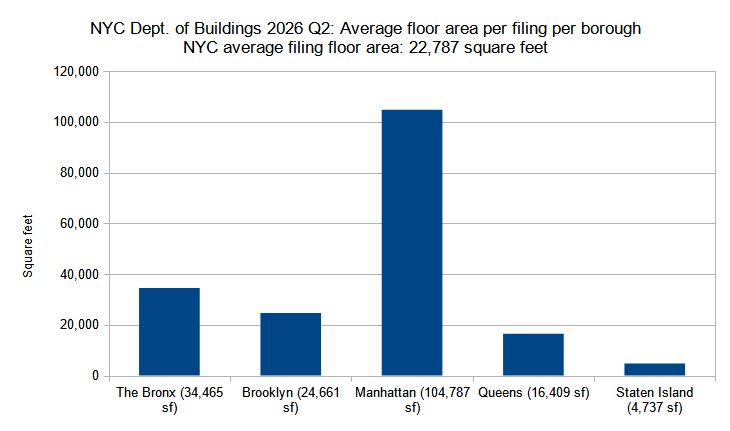
Average floor area per new construction permit per borough filed in New York City in the second quarter (Q2) of 2026. Data source: the Department of Buildings. Data aggregation and graphics credit: Vitali Ogorodnikov
Below are the floor area averages per permit filing per borough for Q2 2026 (with 22,787-square-foot city average per filing):
- The Bronx – 34,465 square feet (51 percent above quarterly city average)
- Brooklyn – 24,661 SF (8 percent above average)
- Manhattan – 104,787 SF (360 percent above average)
- Queens – 16,409 SF (28 percent below average)
- Staten Island – 4,737 SF (79 percent below average)
The chart reflecting the average floor area per permit filing by borough for the second quarter of 2026 closely mirrors the one tallying the permits by average number of floors per filing per borough. As above, the average floor area of a new building filing in Manhattan for the period, spanning 104,787 square feet, more than quadruples the quarterly average of 22,787 square feet per filing.
The rest of the boroughs trail well behind, with The Bronx, Brooklyn, Queens, and Staten Island following in decreasing order. The pattern is reflective of the prevailing density of the built environment of their respective boroughs.
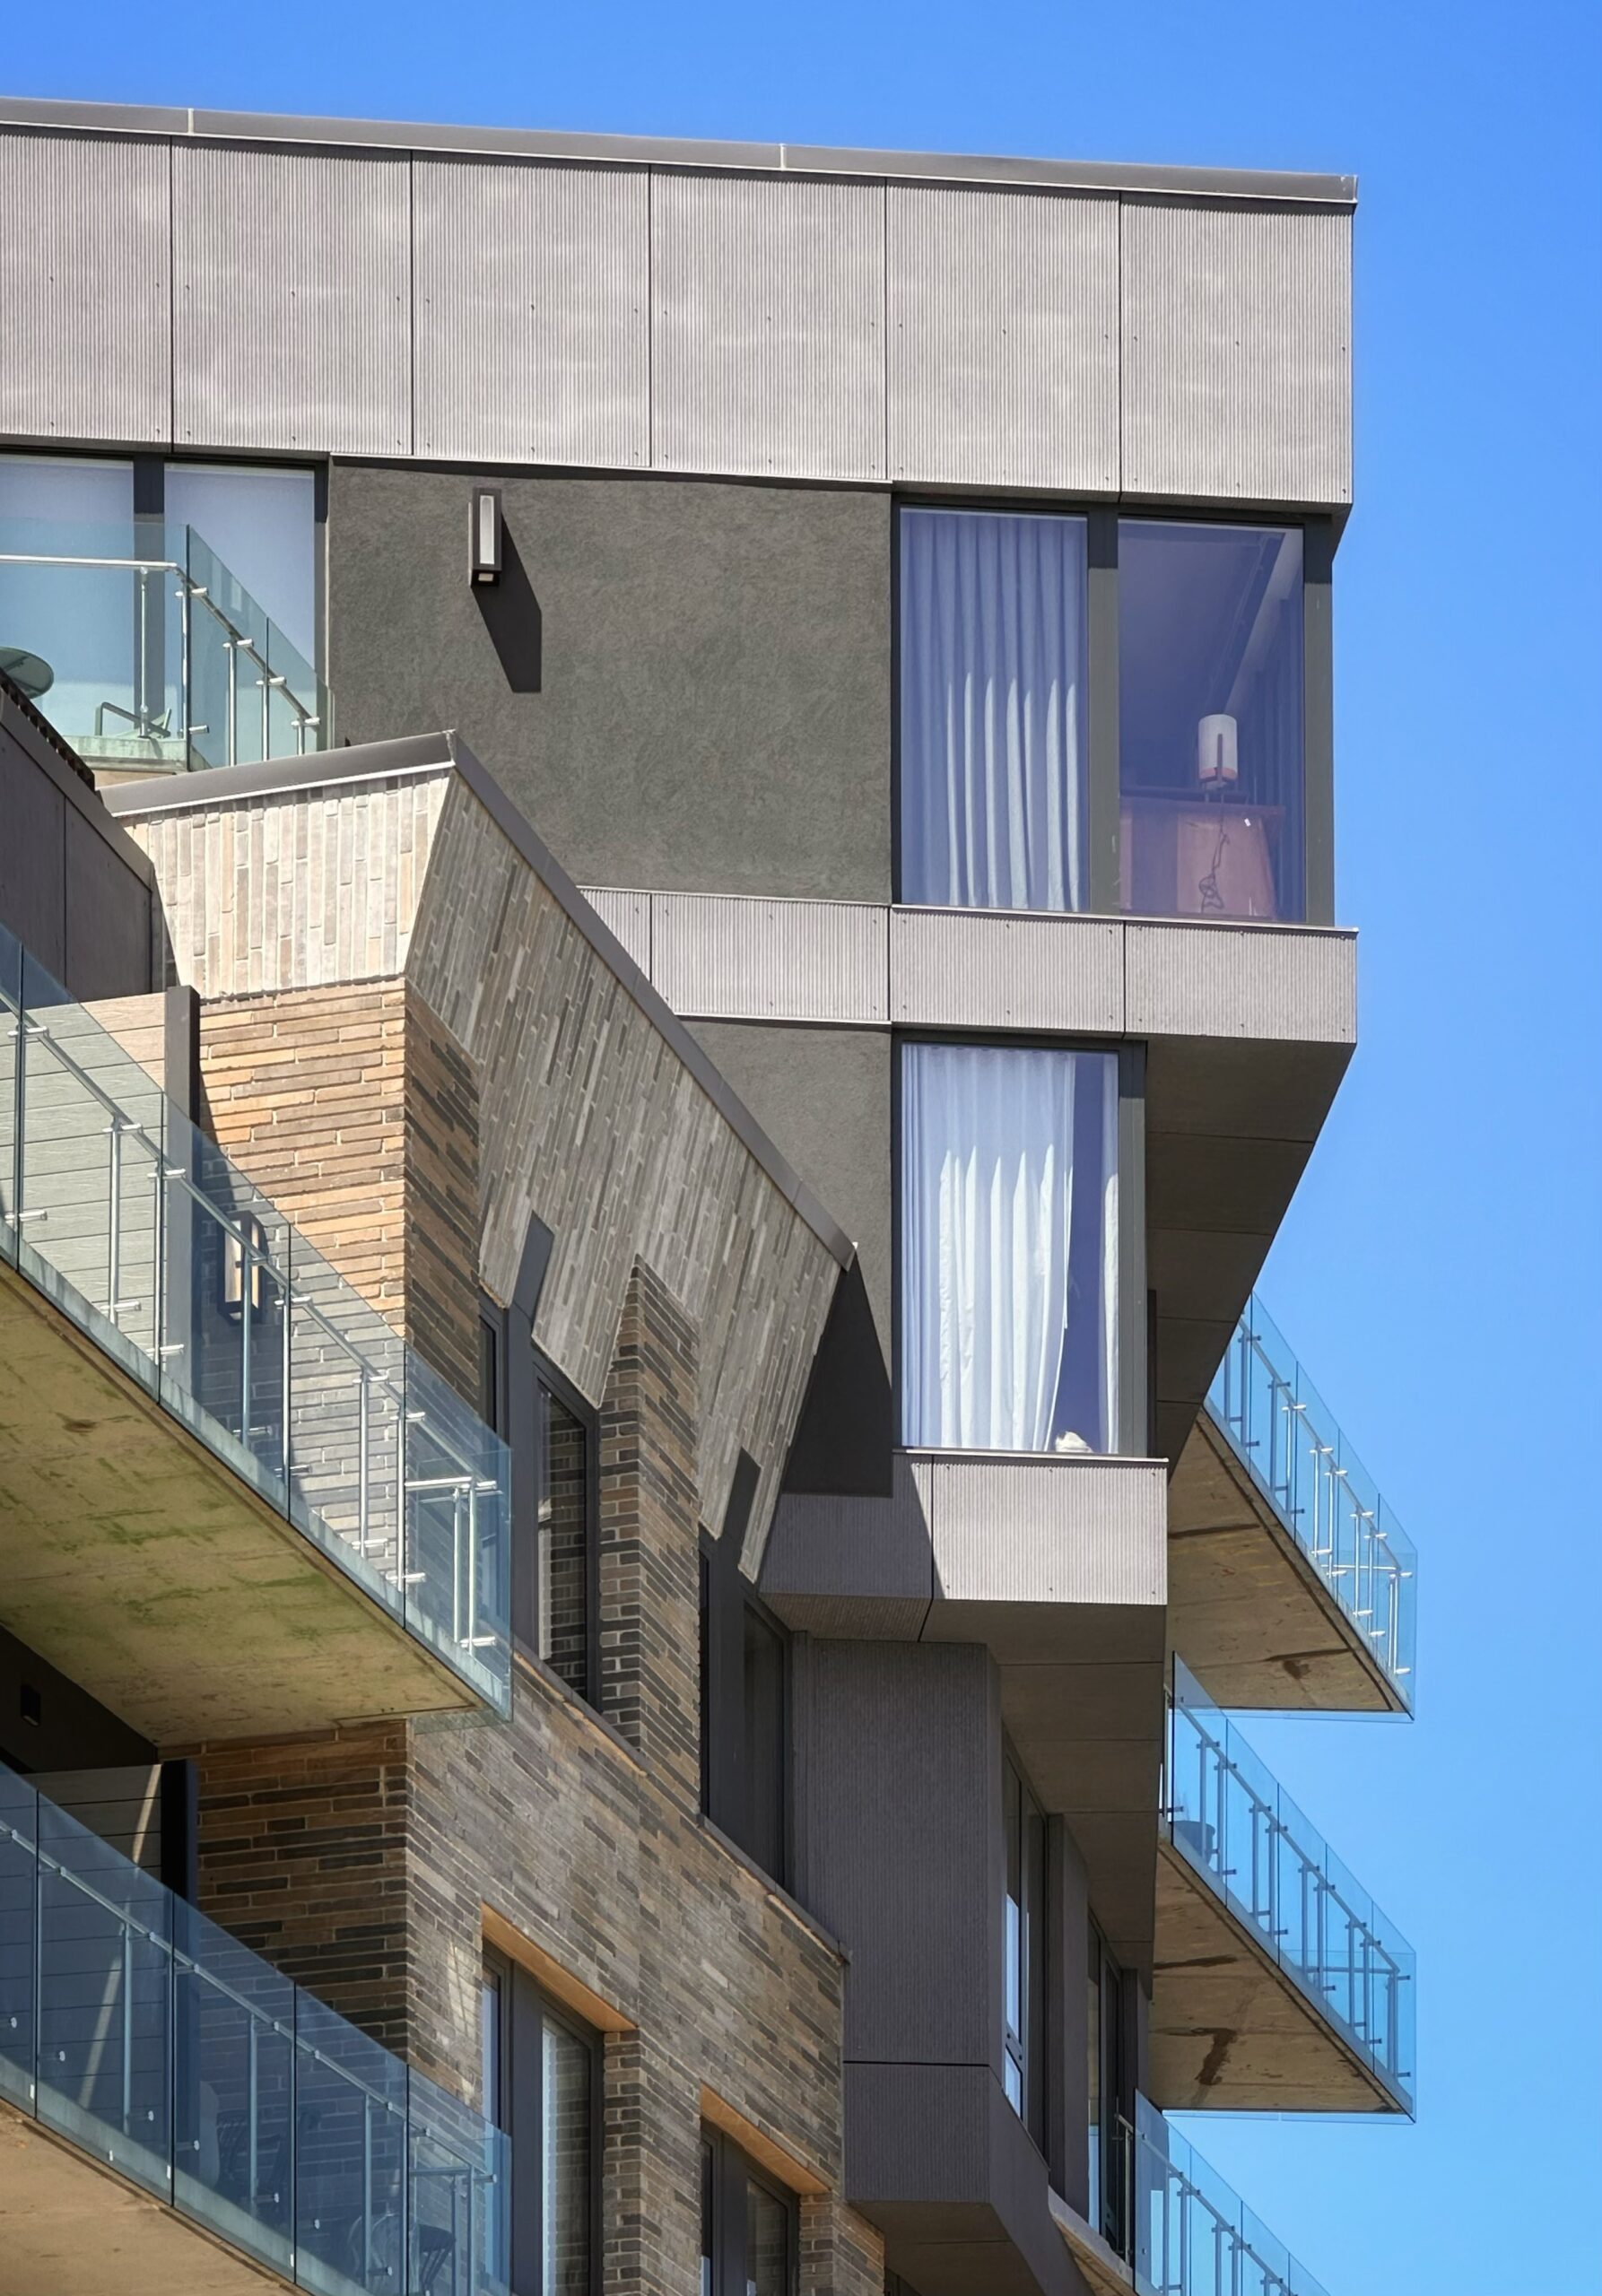
630 Grand Avenue. Photo by Michael Young.
For skyline aficionados, the highlight of the report is the filing for 80 West 67th Street, a nearly 1,200-foot-tall Extell development slated for Lincoln Square, a high-rise enclave that spans the southern portion of the Upper West Side.
All New Yorkers, however, ought to appreciate the roughly 16,000 residential units that were filed for during the period; at a presumptive residency of around two persons per apartment, they would be able to accommodate around 32,000 people, roughly equivalent to the entire population of Bangor, Maine, or Juneau, Alaska.
Unfortunately, the number falls far short of the volume of new residential New York City desperately needs to alleviate its dire housing shortage. In August, the New York Times quoted city officials as stating that NYC needs an immediate addition of 290,000 residential units just to accommodate every city resident that is currently in need of housing in one form or another.
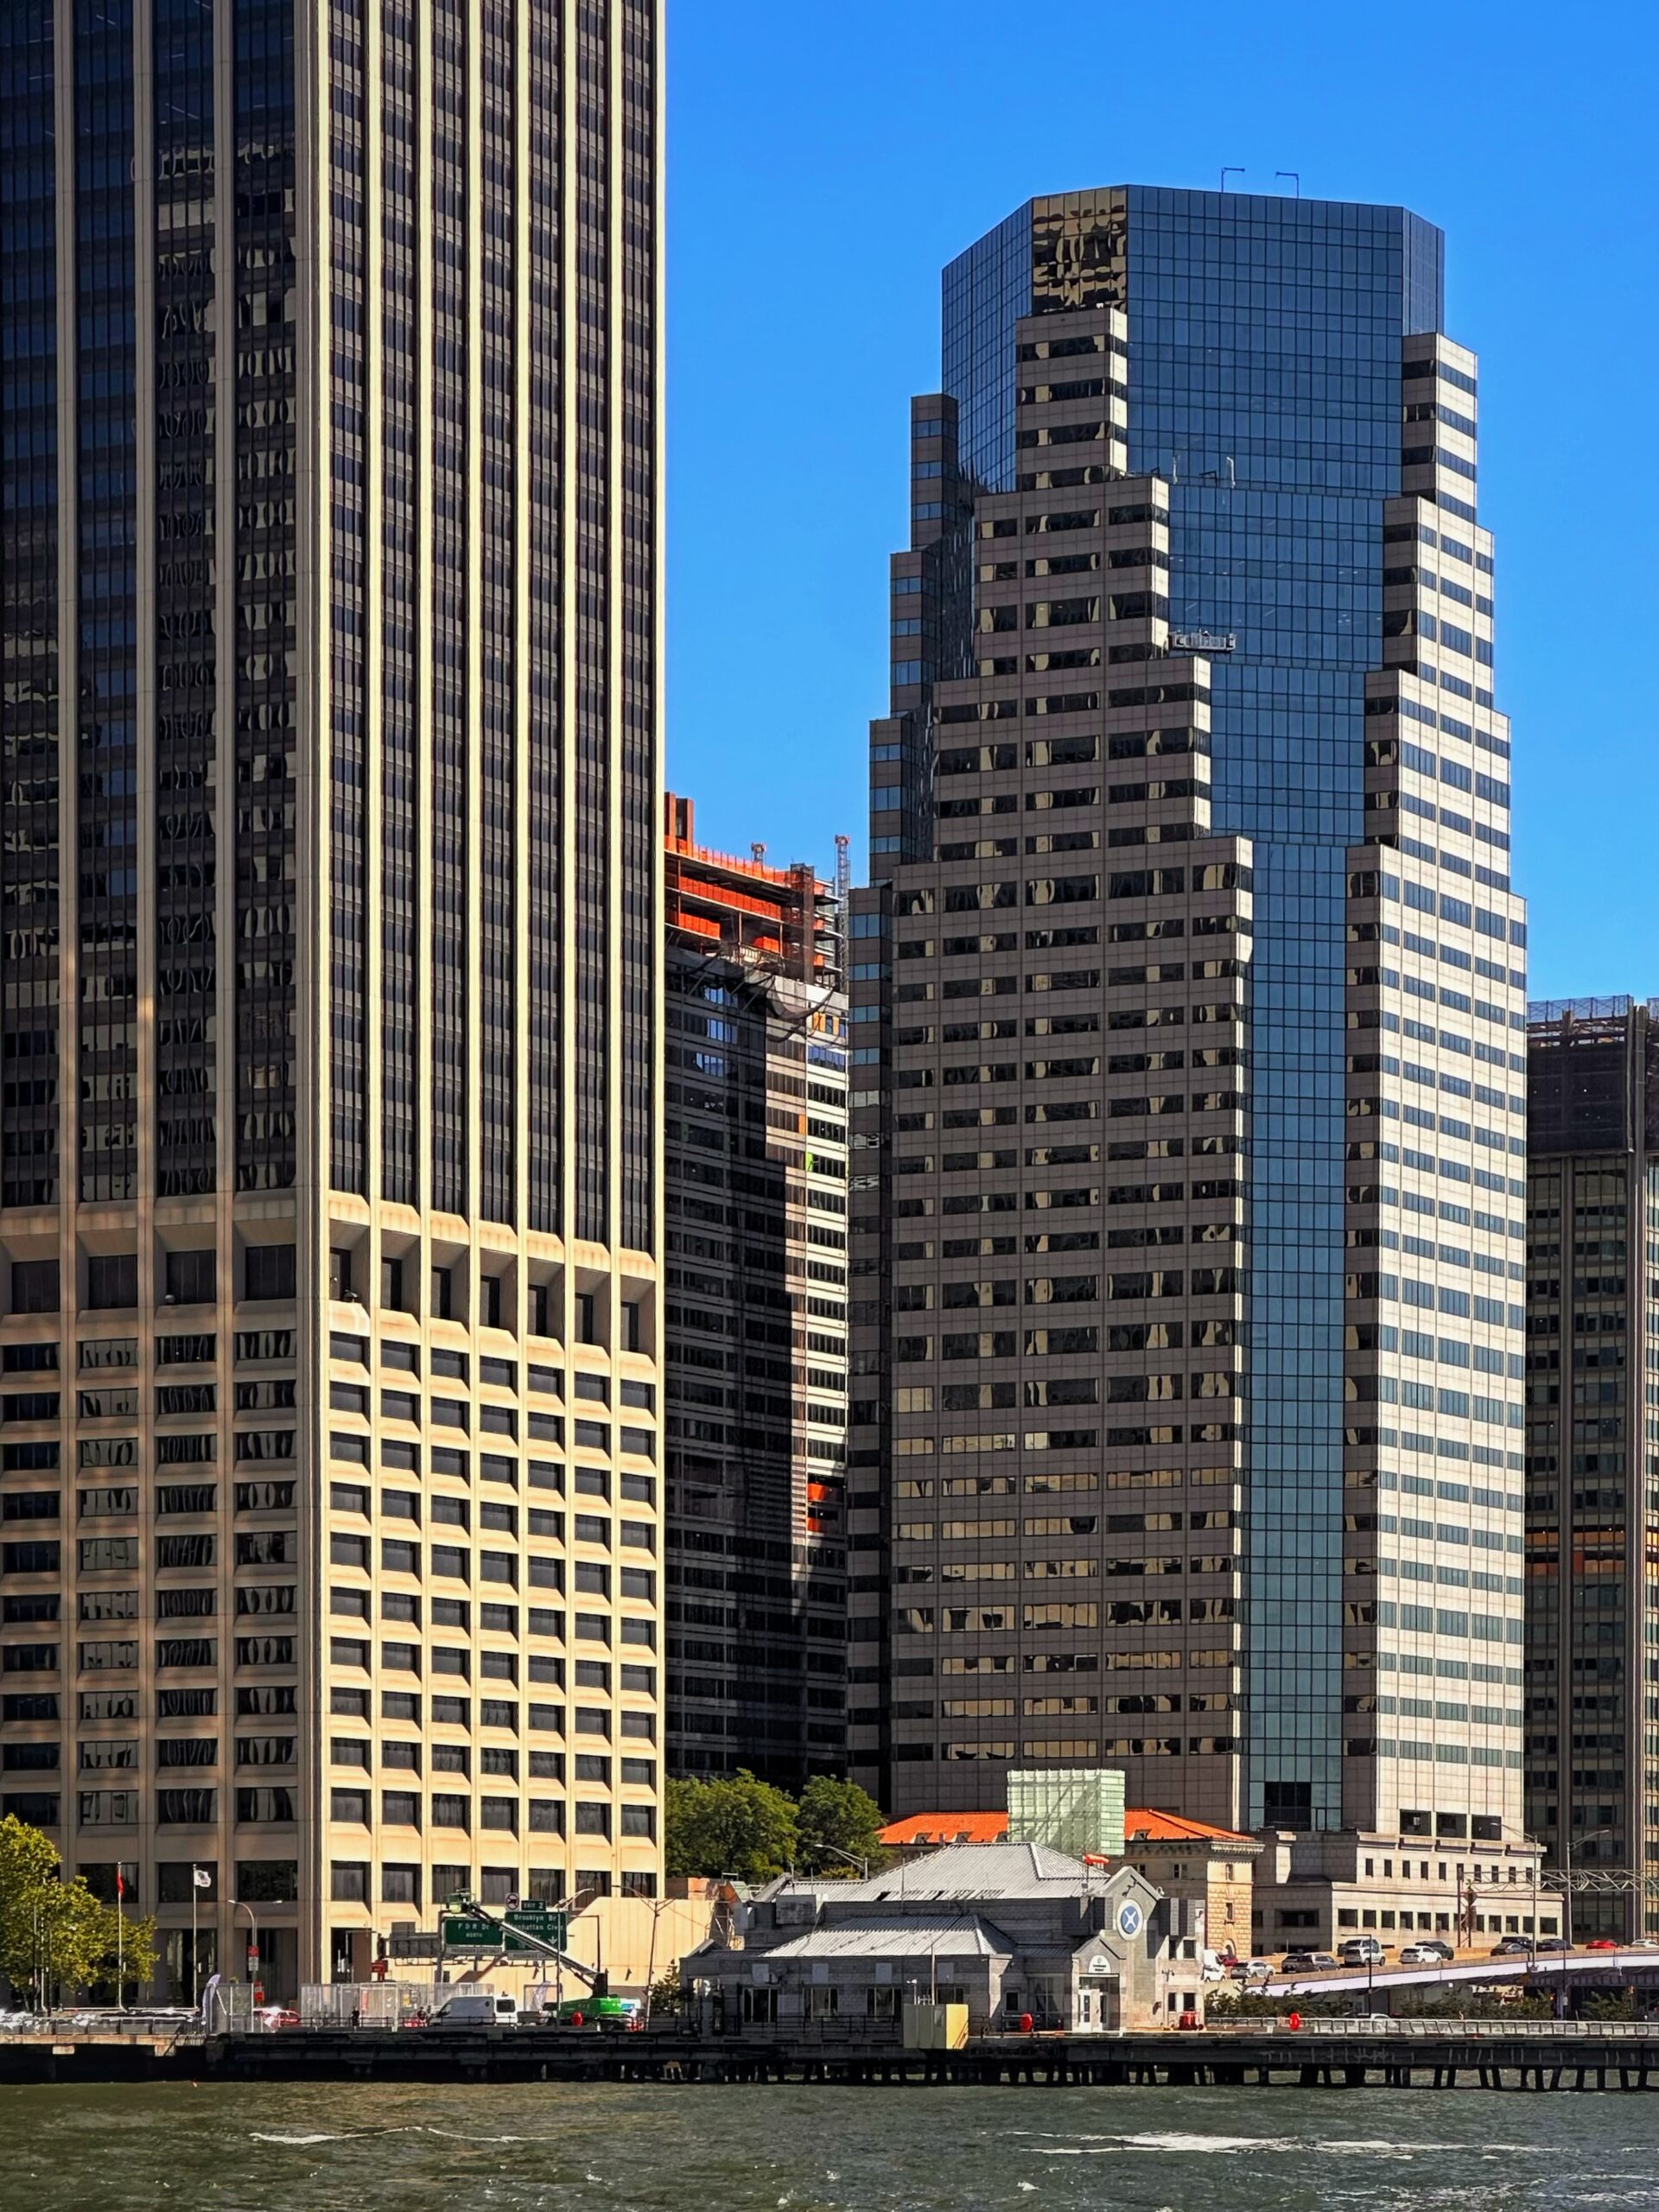
77 Water Street. Photo by Michael Young.
The report further states that the city requires at least 700,000 new units over the course of the next ten years to make up for the shortage. If the city’s developers keep up the current quarterly pace of adding 16,000 new units every three months, New York City would add 640,000 new residences in ten years.
This figure is considerable on its own yet still inadequate to keep up with New Yorkers’ most basic need: a roof over their heads. According to a report by the NYU Furman Center, this minimally required pace of 70,000 new units added per year has not been met at any point over at least the past 15 years.
Housing shortage is a pressing issue that affects New Yorkers of all backgrounds and income levels, especially as a recent city report reveals that average Manhattan rents for one-bedroom units have risen above $5,000, a figure that is completely untenable for lower-income New Yorkers.
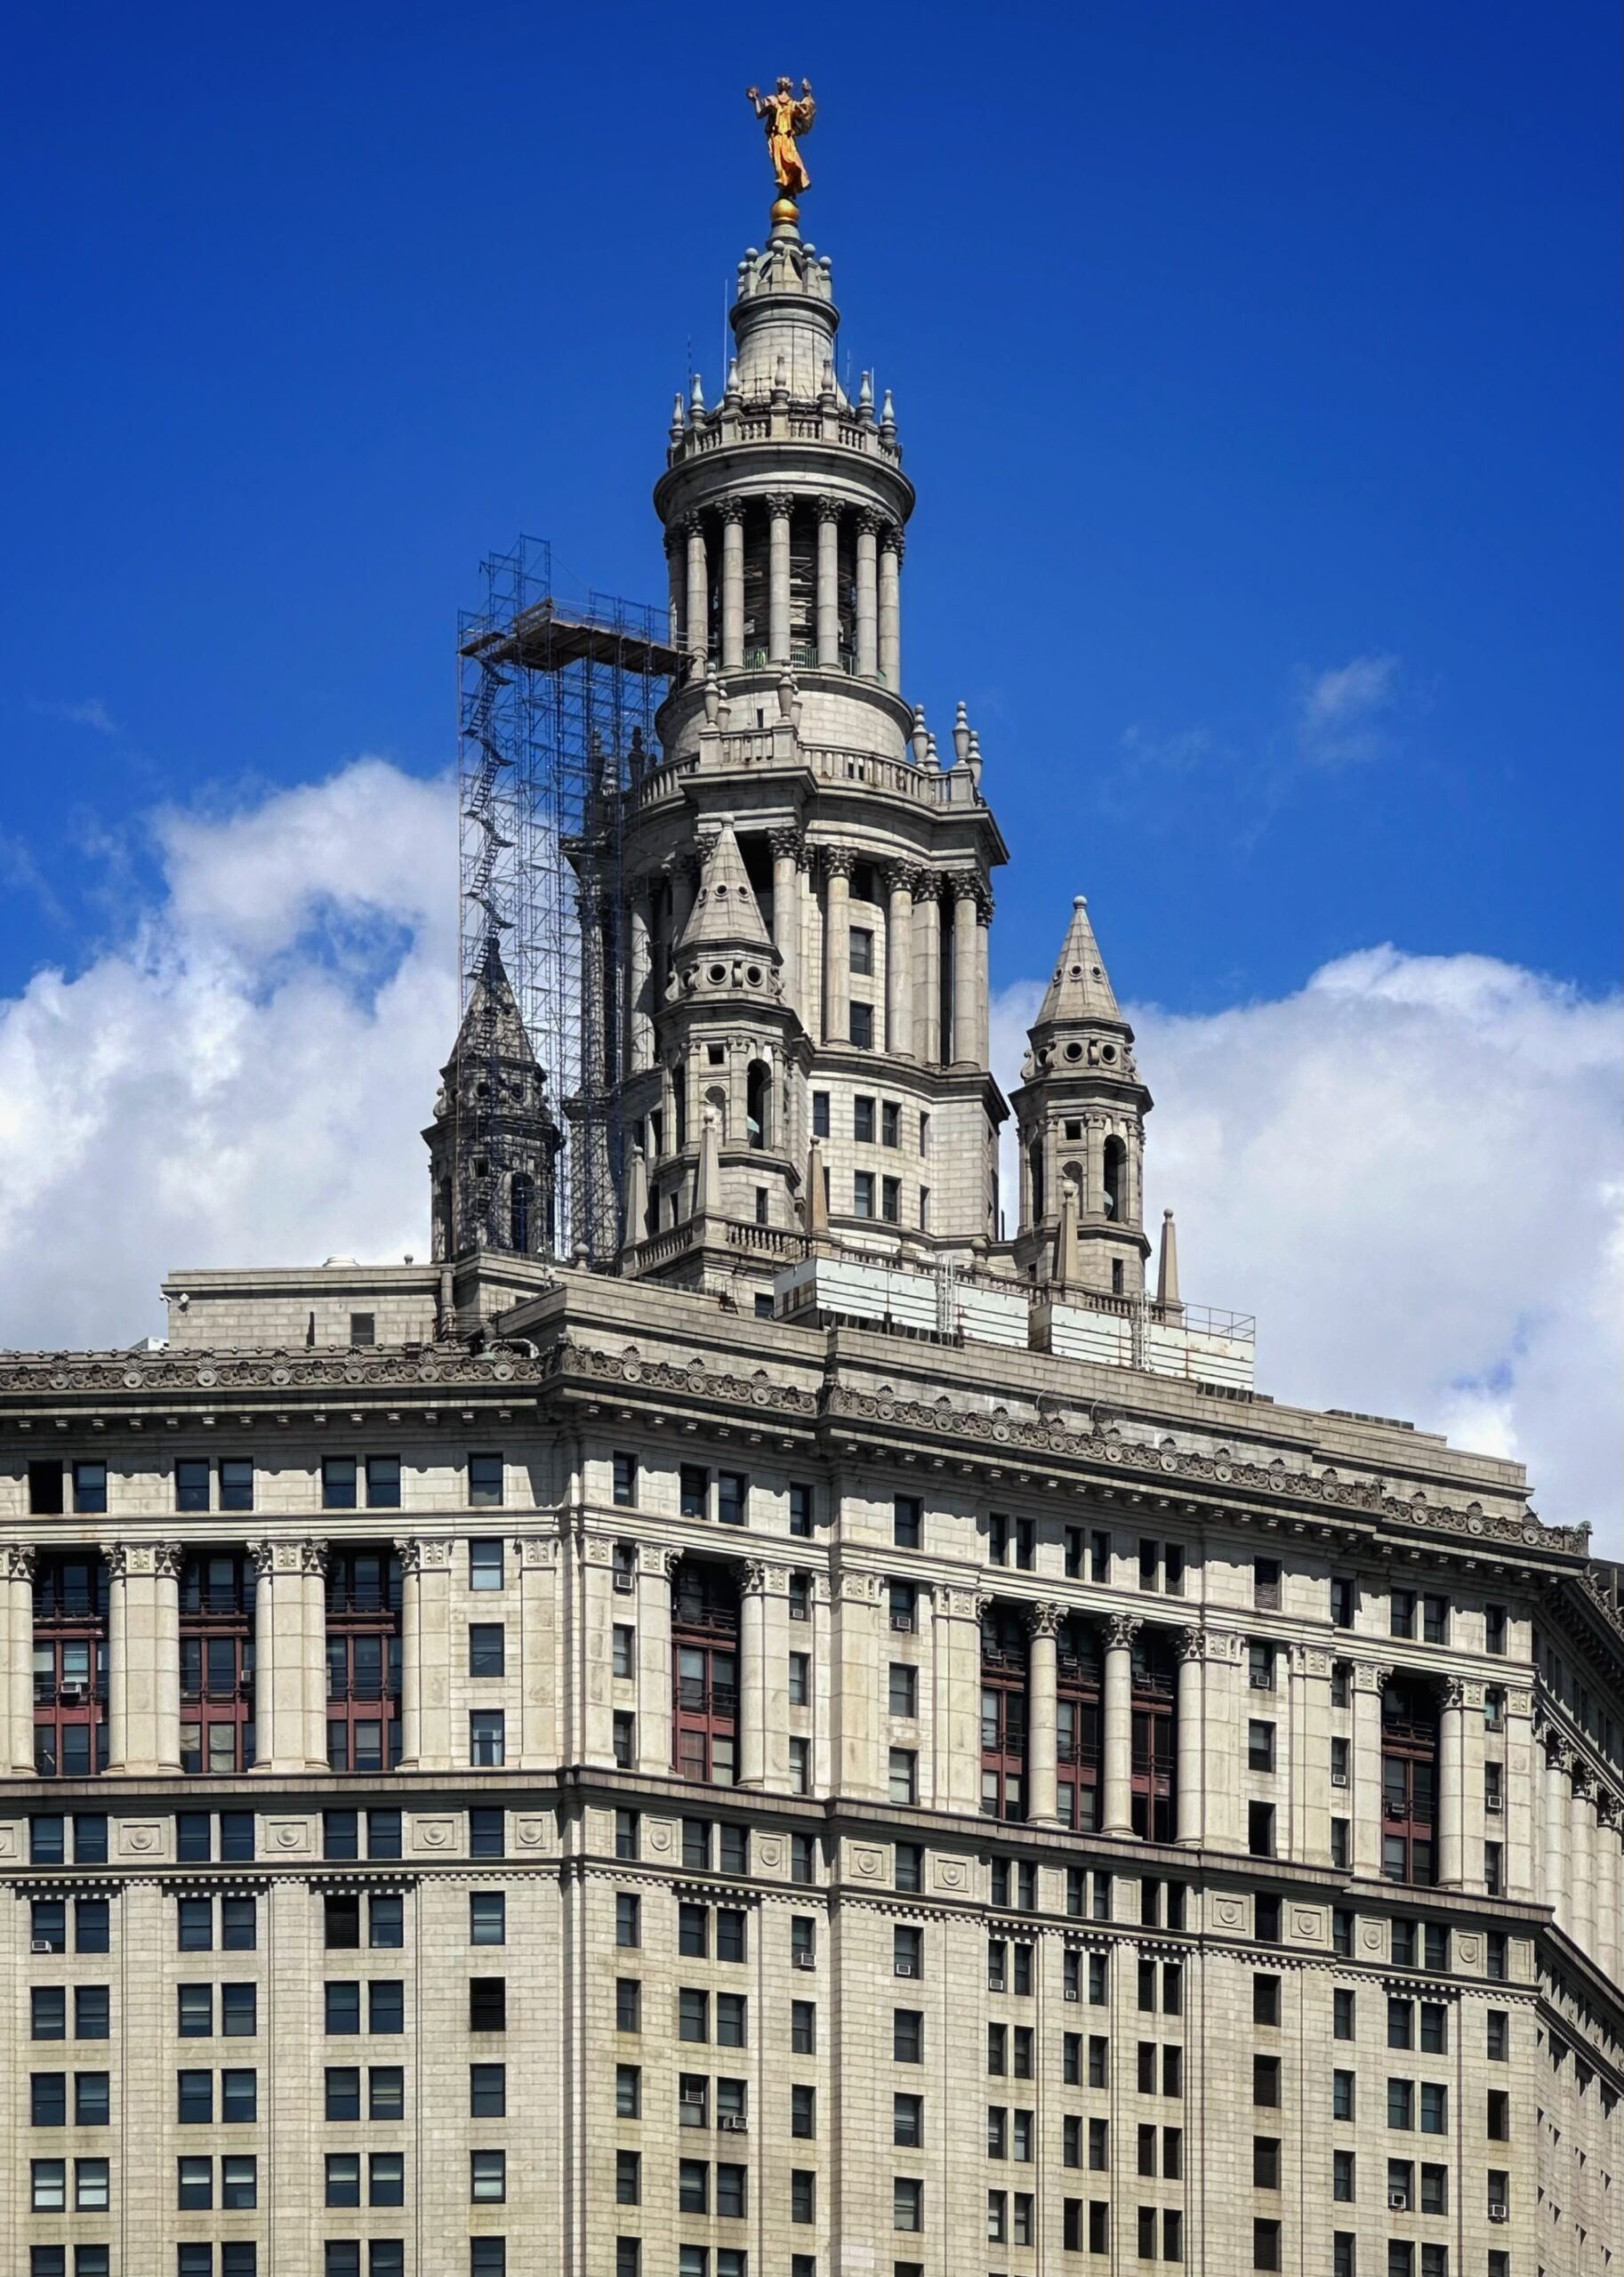
1 Centre Street in April 2026. Photo by Michael Young.
The Citizens Budget Commission, a nonprofit civic think tank, summarizes the direness of the issue succinctly:
Housing underproduction has created a housing shortage that worsens quality of life for New Yorkers and drives away people, jobs, and commerce. It makes it harder for New Yorkers to find housing, harms the City’s tax base, and dampens its economy. New Yorkers in the lowest income brackets bear the brunt of the housing crisis, though the impact is also felt more broadly—by New Yorkers who pay too large of a share of their income on housing, by those who pay higher taxes due to depressed economic activity, by those who leave the city to find more affordable housing, and by those who want to move here but do not because it is simply too expensive.
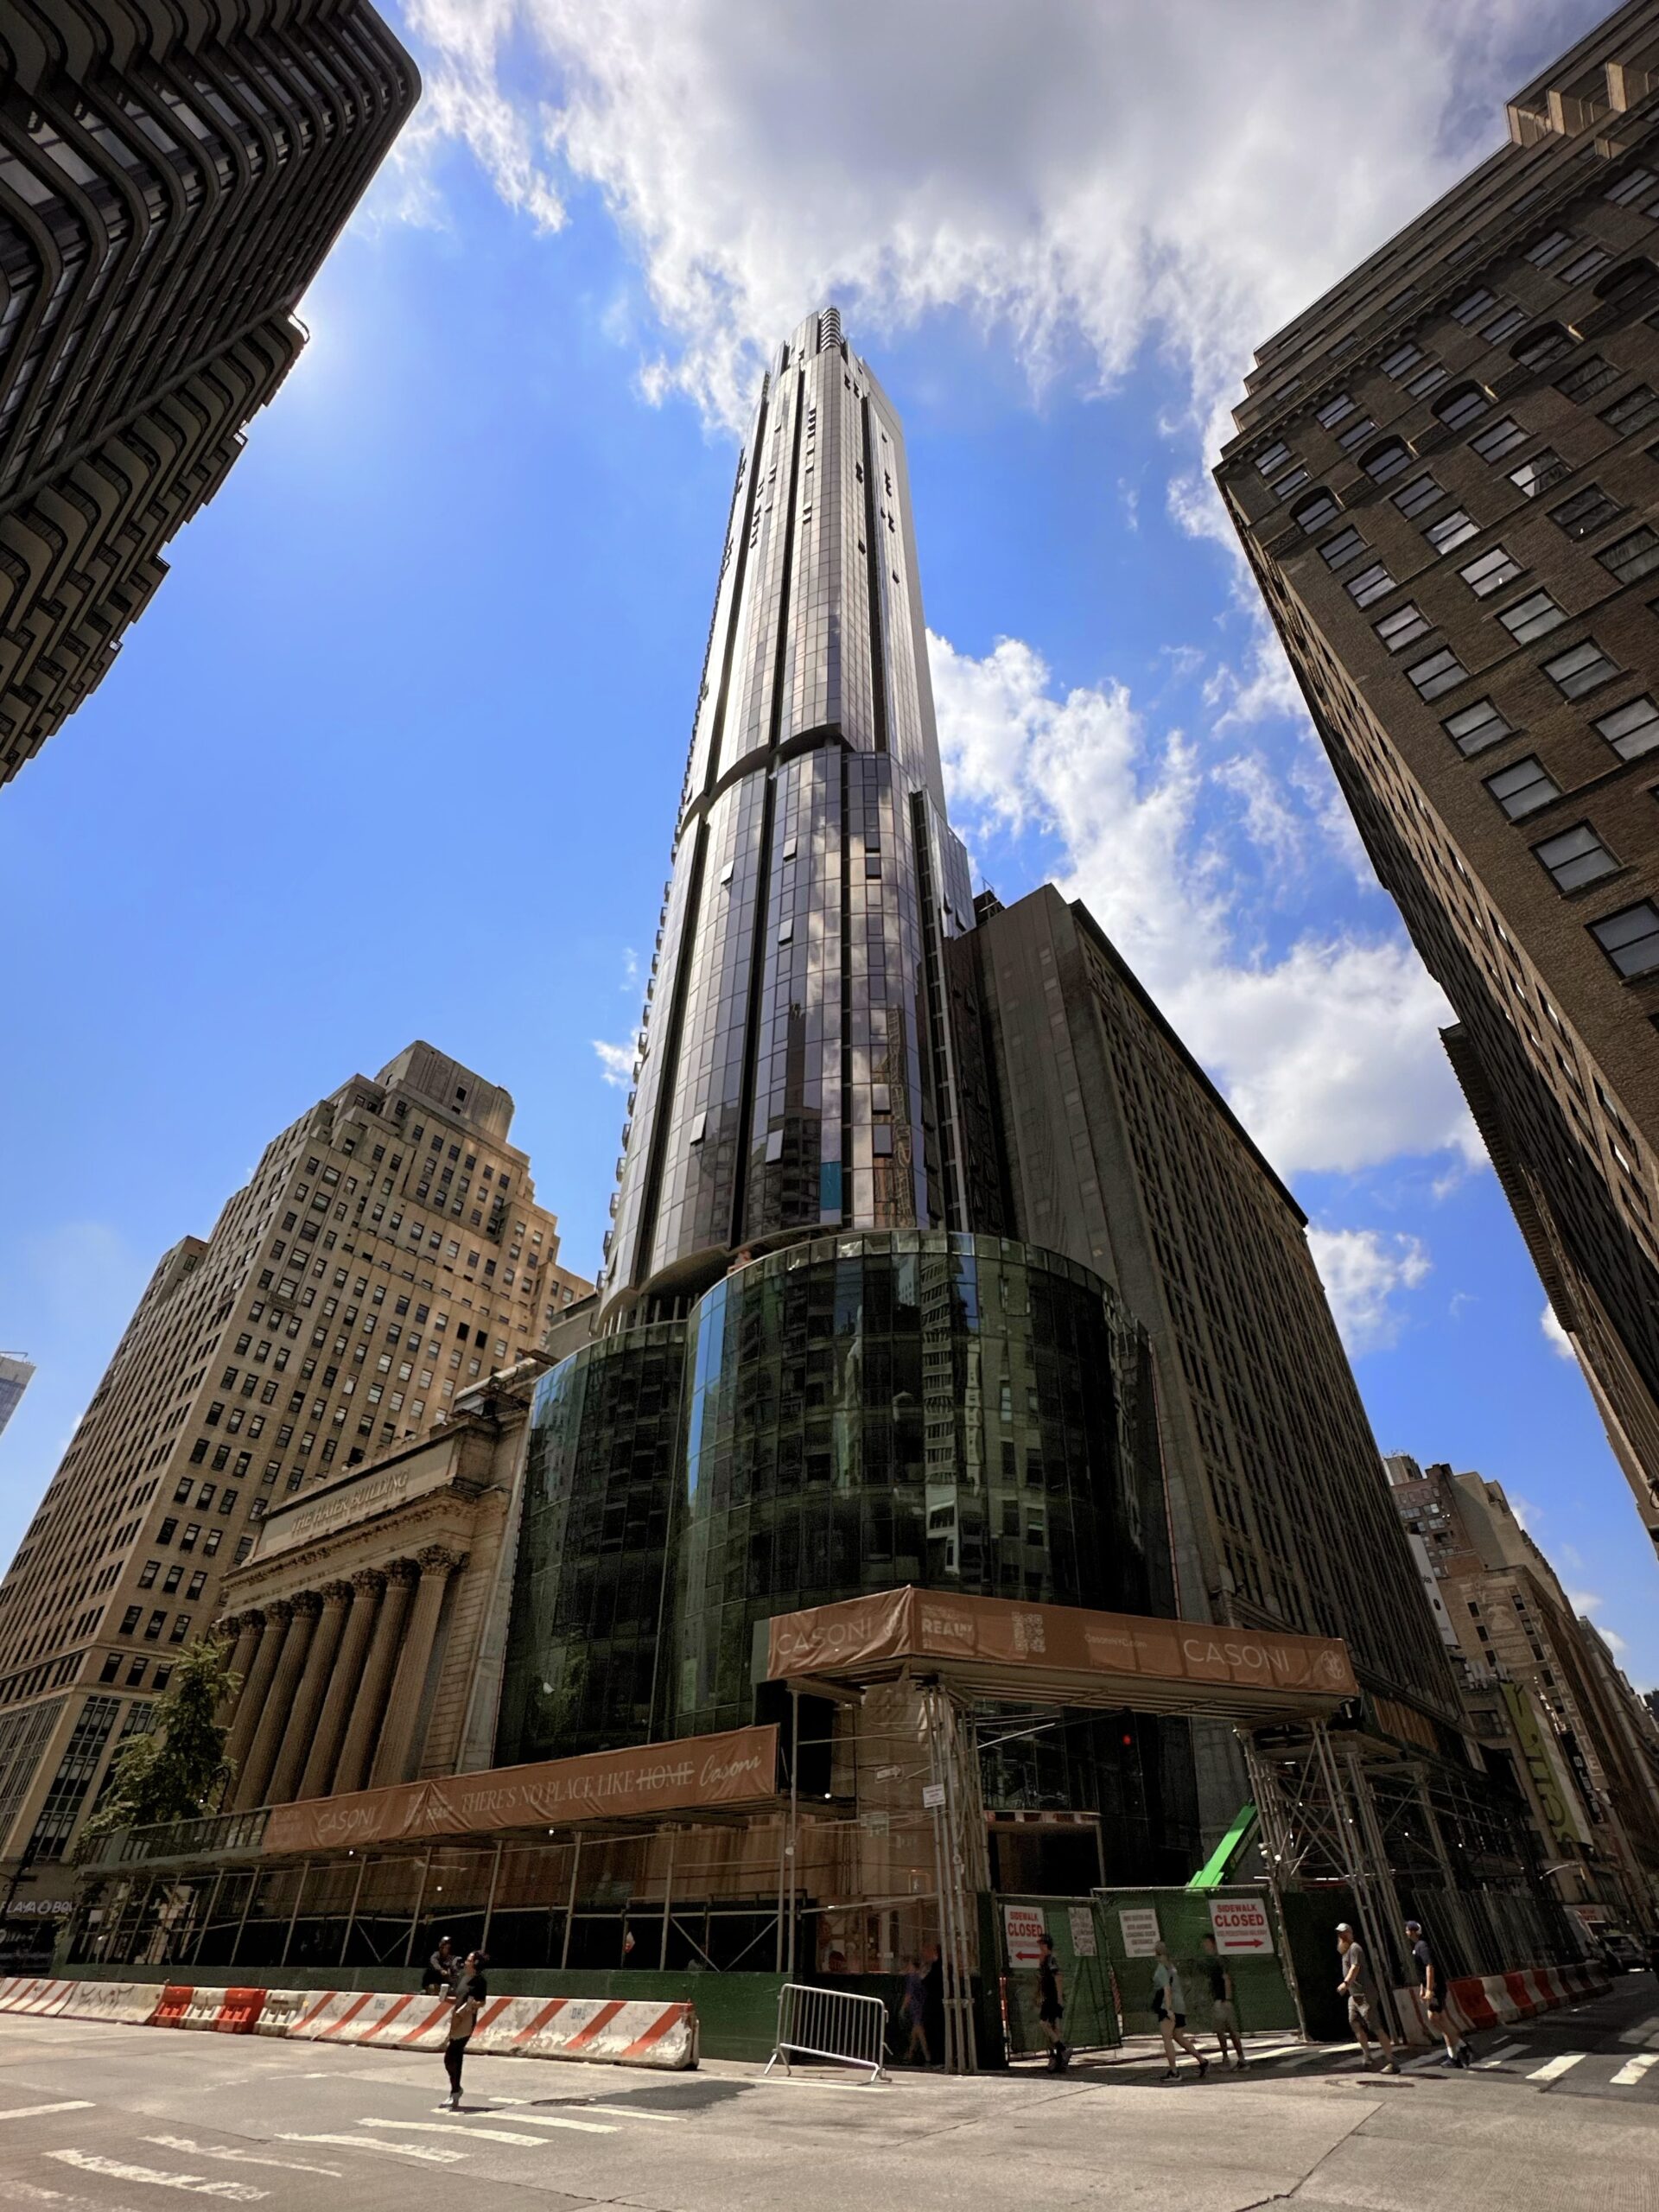
Casoni. Photo by Michael Young.
Fortunately, multiple signs indicate that a general public demand for new housing is finally reaching a tipping point where we may generate the necessary political will to finally enact real, tangible change. Every year, ever greater numbers of New Yorkers are realizing that enough is enough and are saying Yes In My Back Yard to much-needed new development.
We are approaching two years since the city government enacted the City of Yes for Housing Opportunity, a series of zoning amendments aiming to encourage housing construction, in December 2024, and the legislation is already bearing fruit in new proposals.
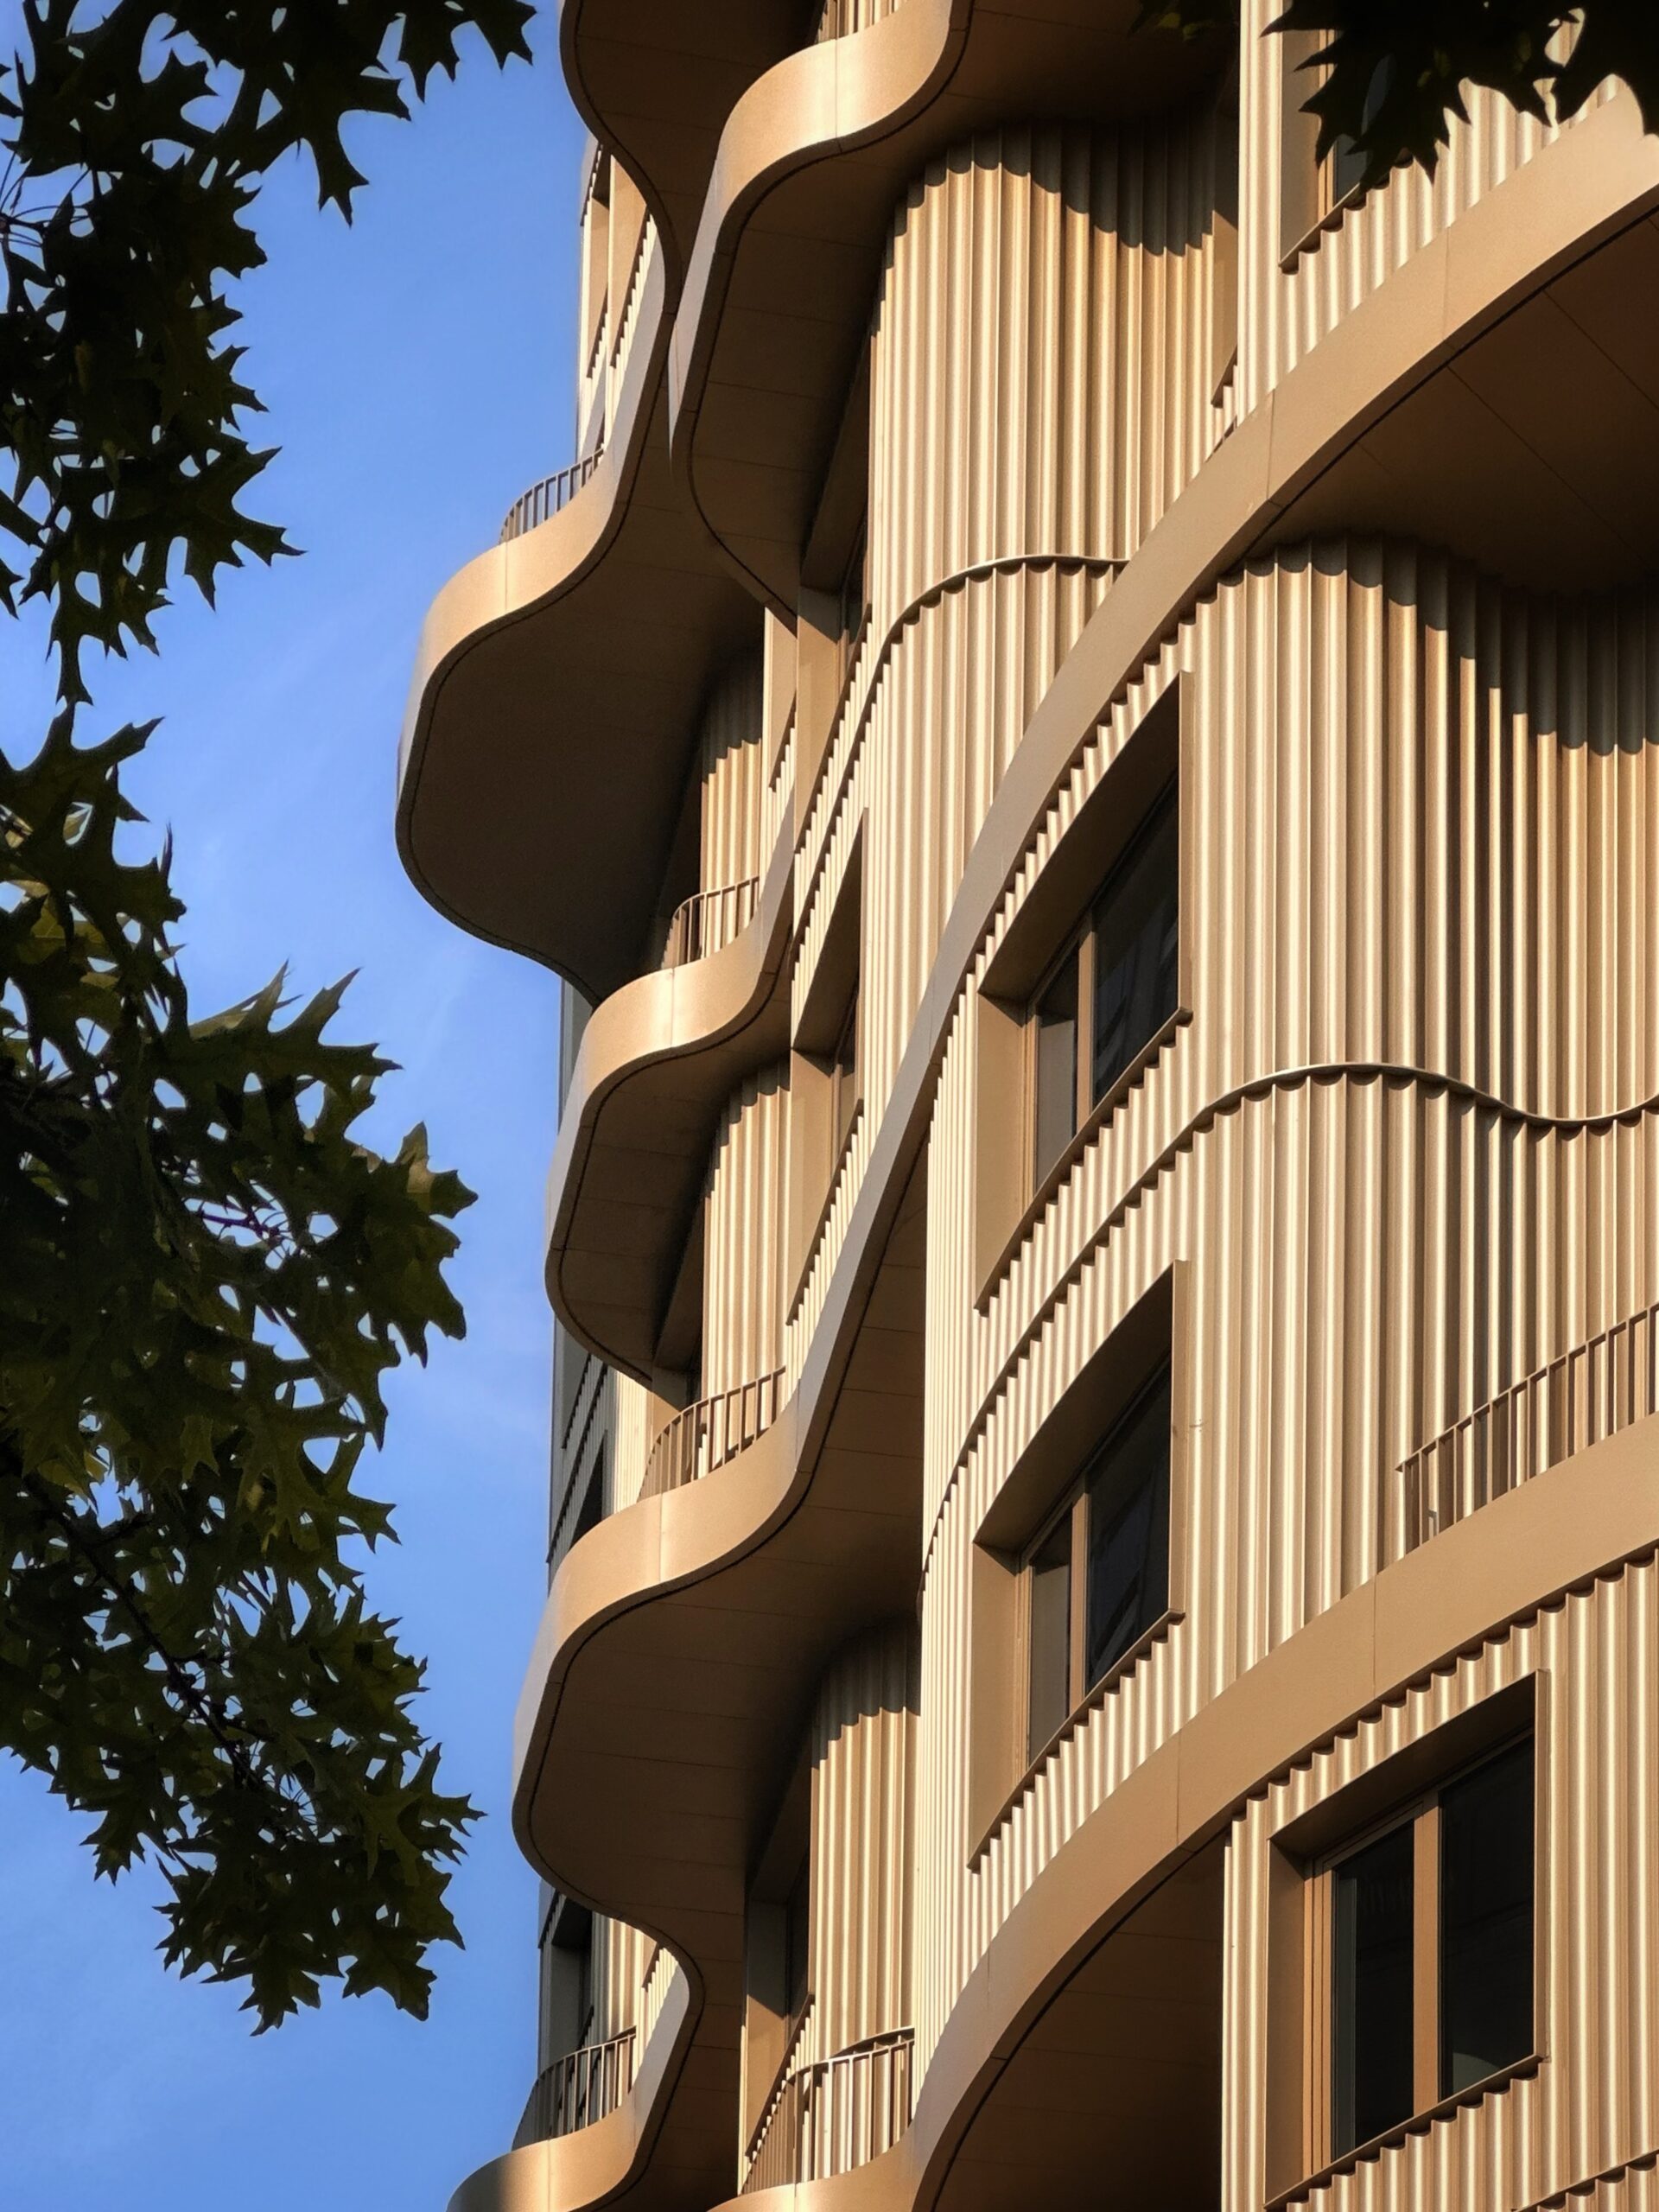
Radiant LIC. Photo by Michael Young.
Another major victory took place at the state level last April, when the legislature finally repealed the 12:1 Floor-Area-Ratio restriction for New York City. Introduced in 1961 as an ostensible “anti-slum” measure, it wrought a severe negative impact on city construction for decades, limiting New York City’s as-of-right buildable usable residential floor area to only 12 times the footprint of the lot.
The repeal of the state-imposed FAR cap finally unchained the nation’s premier city from needless and arbitrary development limitations imposed in the postwar age of suburban sprawl and anti-urban development philosophies.
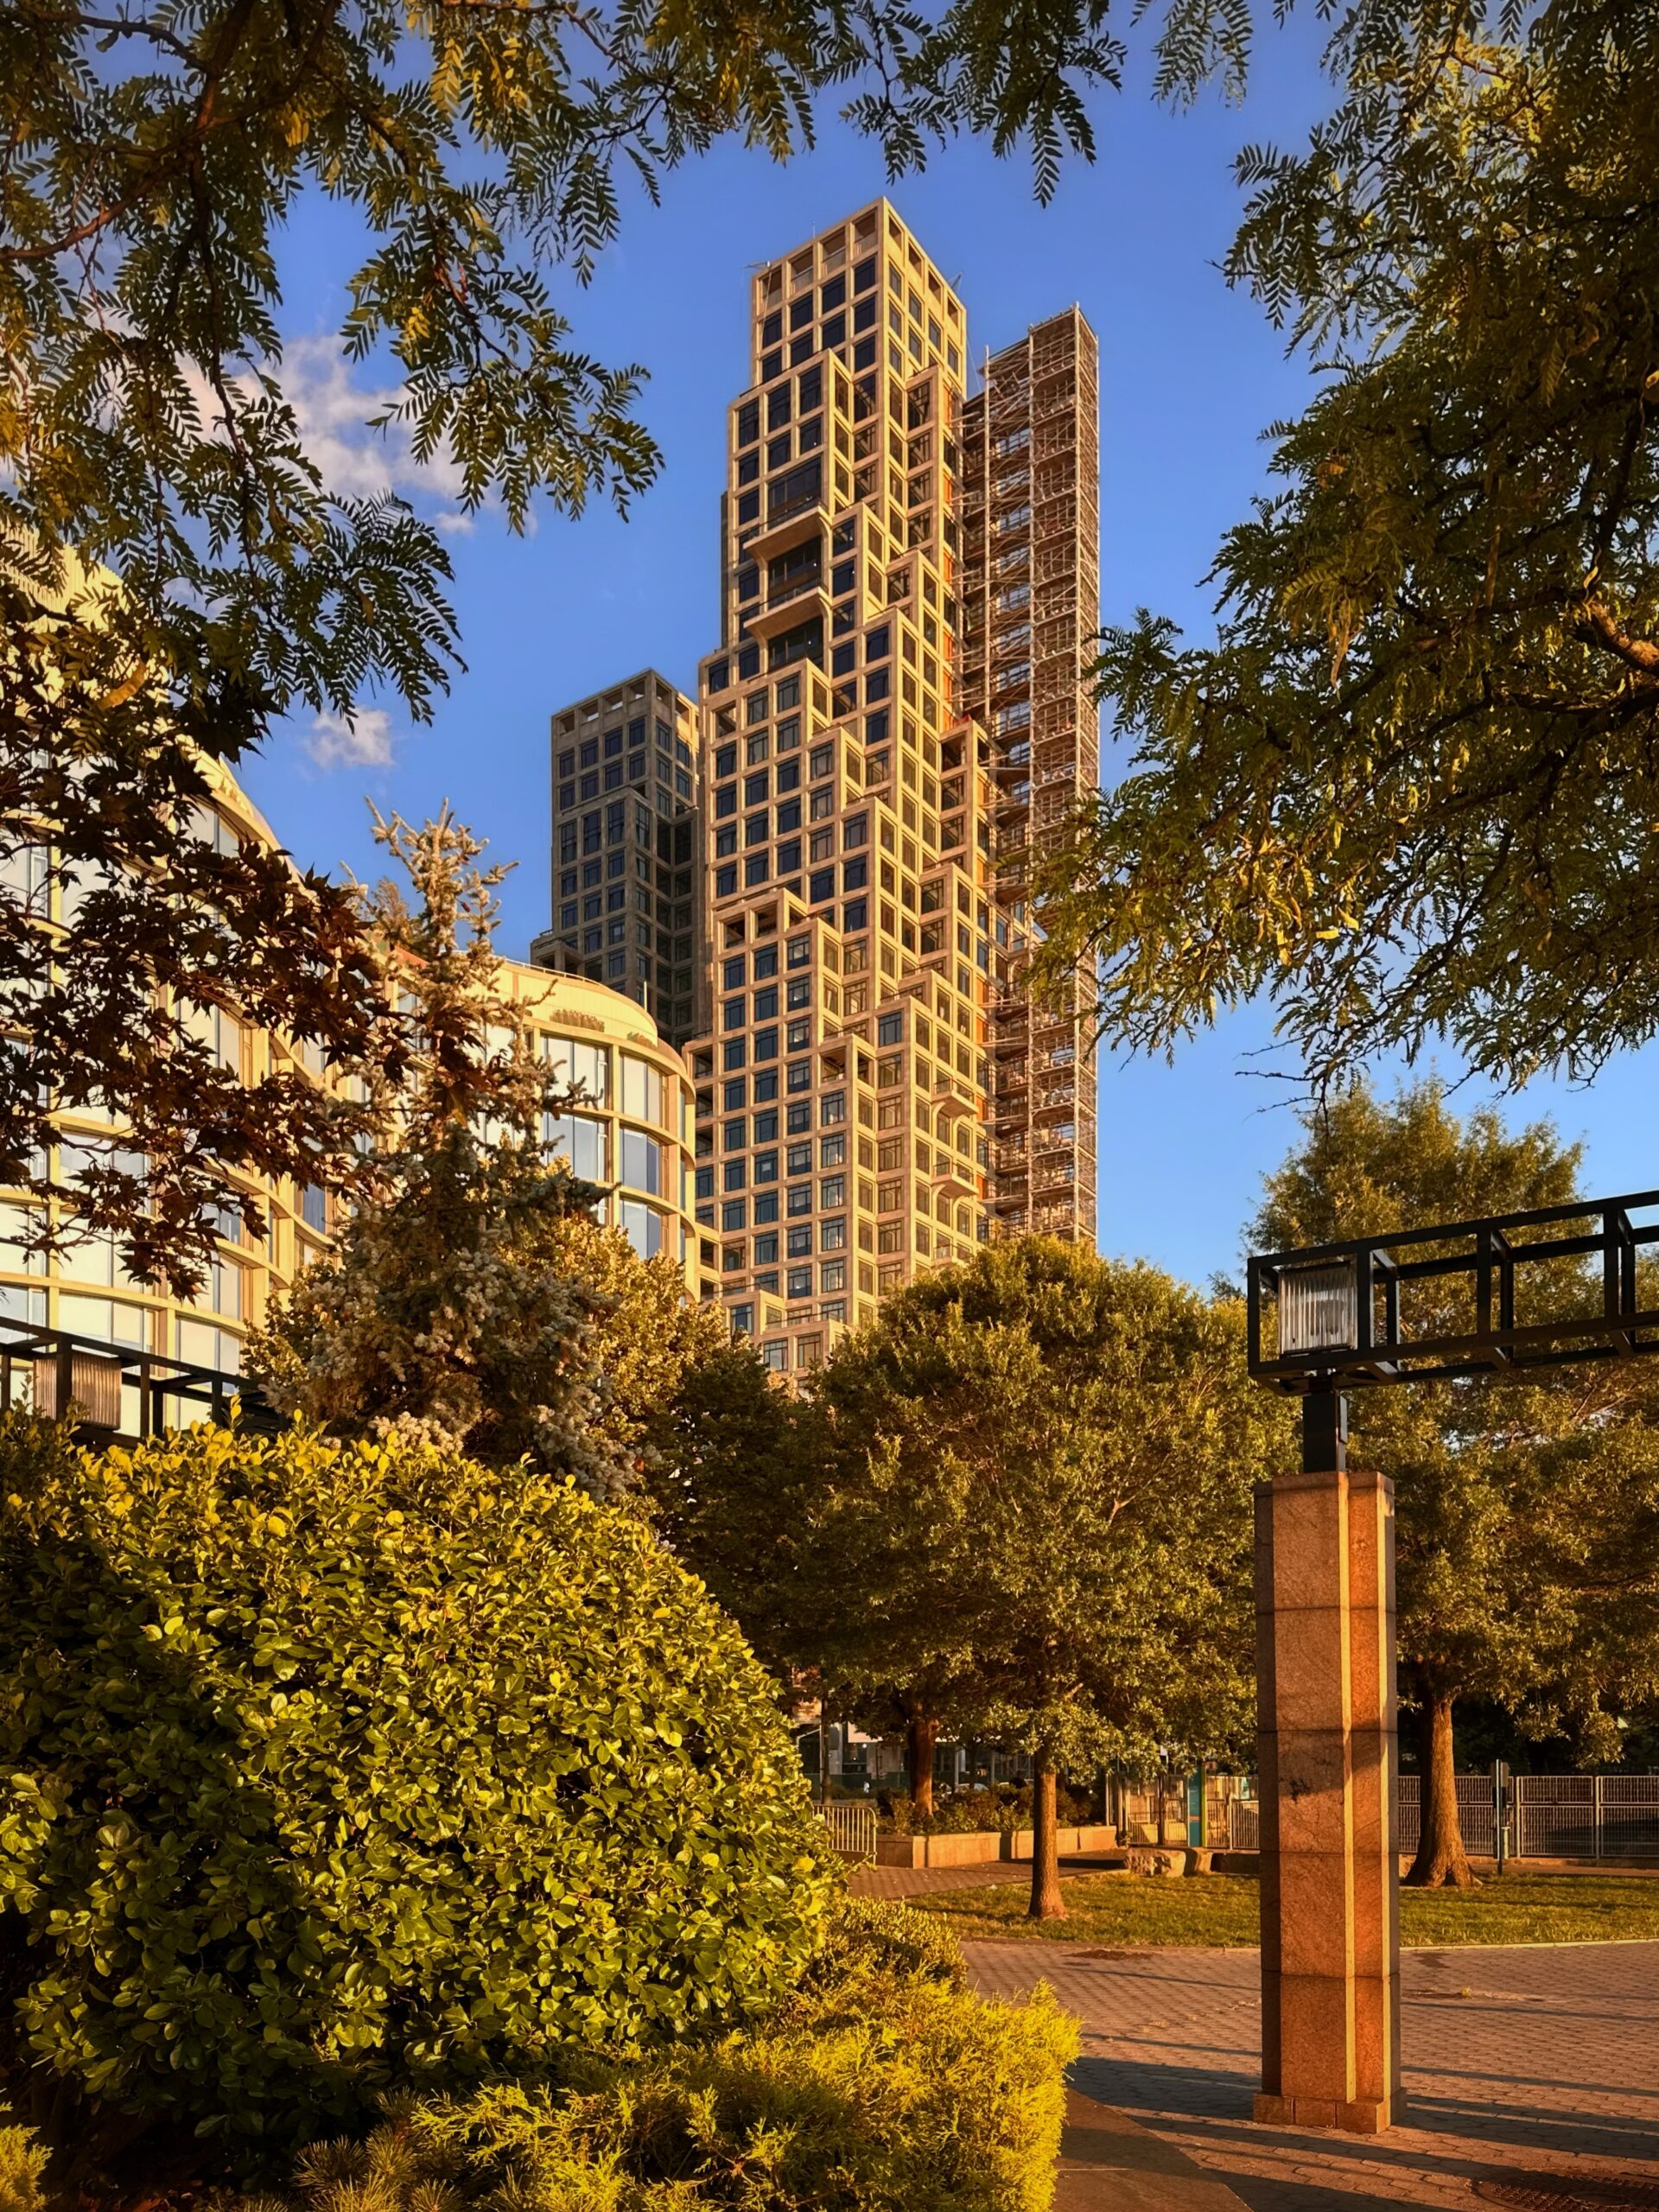
80 Clarkson. Photo by Michael Young.
In June, the Wall Street Journal reported that despite the ongoing work-from-home era, the Manhattan office market is expected to show the strongest leasing figures since 2000, spanning a period of a quarter-century. Top-of-the-line Class A office towers in Hudson Yards and Midtown are asking well over $100 per leasable square foot.
Some of the highest prime office space demand is noted in Midtown East, where the most sweeping zoning overhaul since 1961 is responsible for an ongoing construction boom of top-tier supertall office towers.
Even in the Financial District, which has long lagged behind Midtown in prime commercial space leases, construction has recently restarted in earnest at Two World Trade Center, one of the city’s future largest and tallest office buildings, after decades of redesigns and work stoppage.
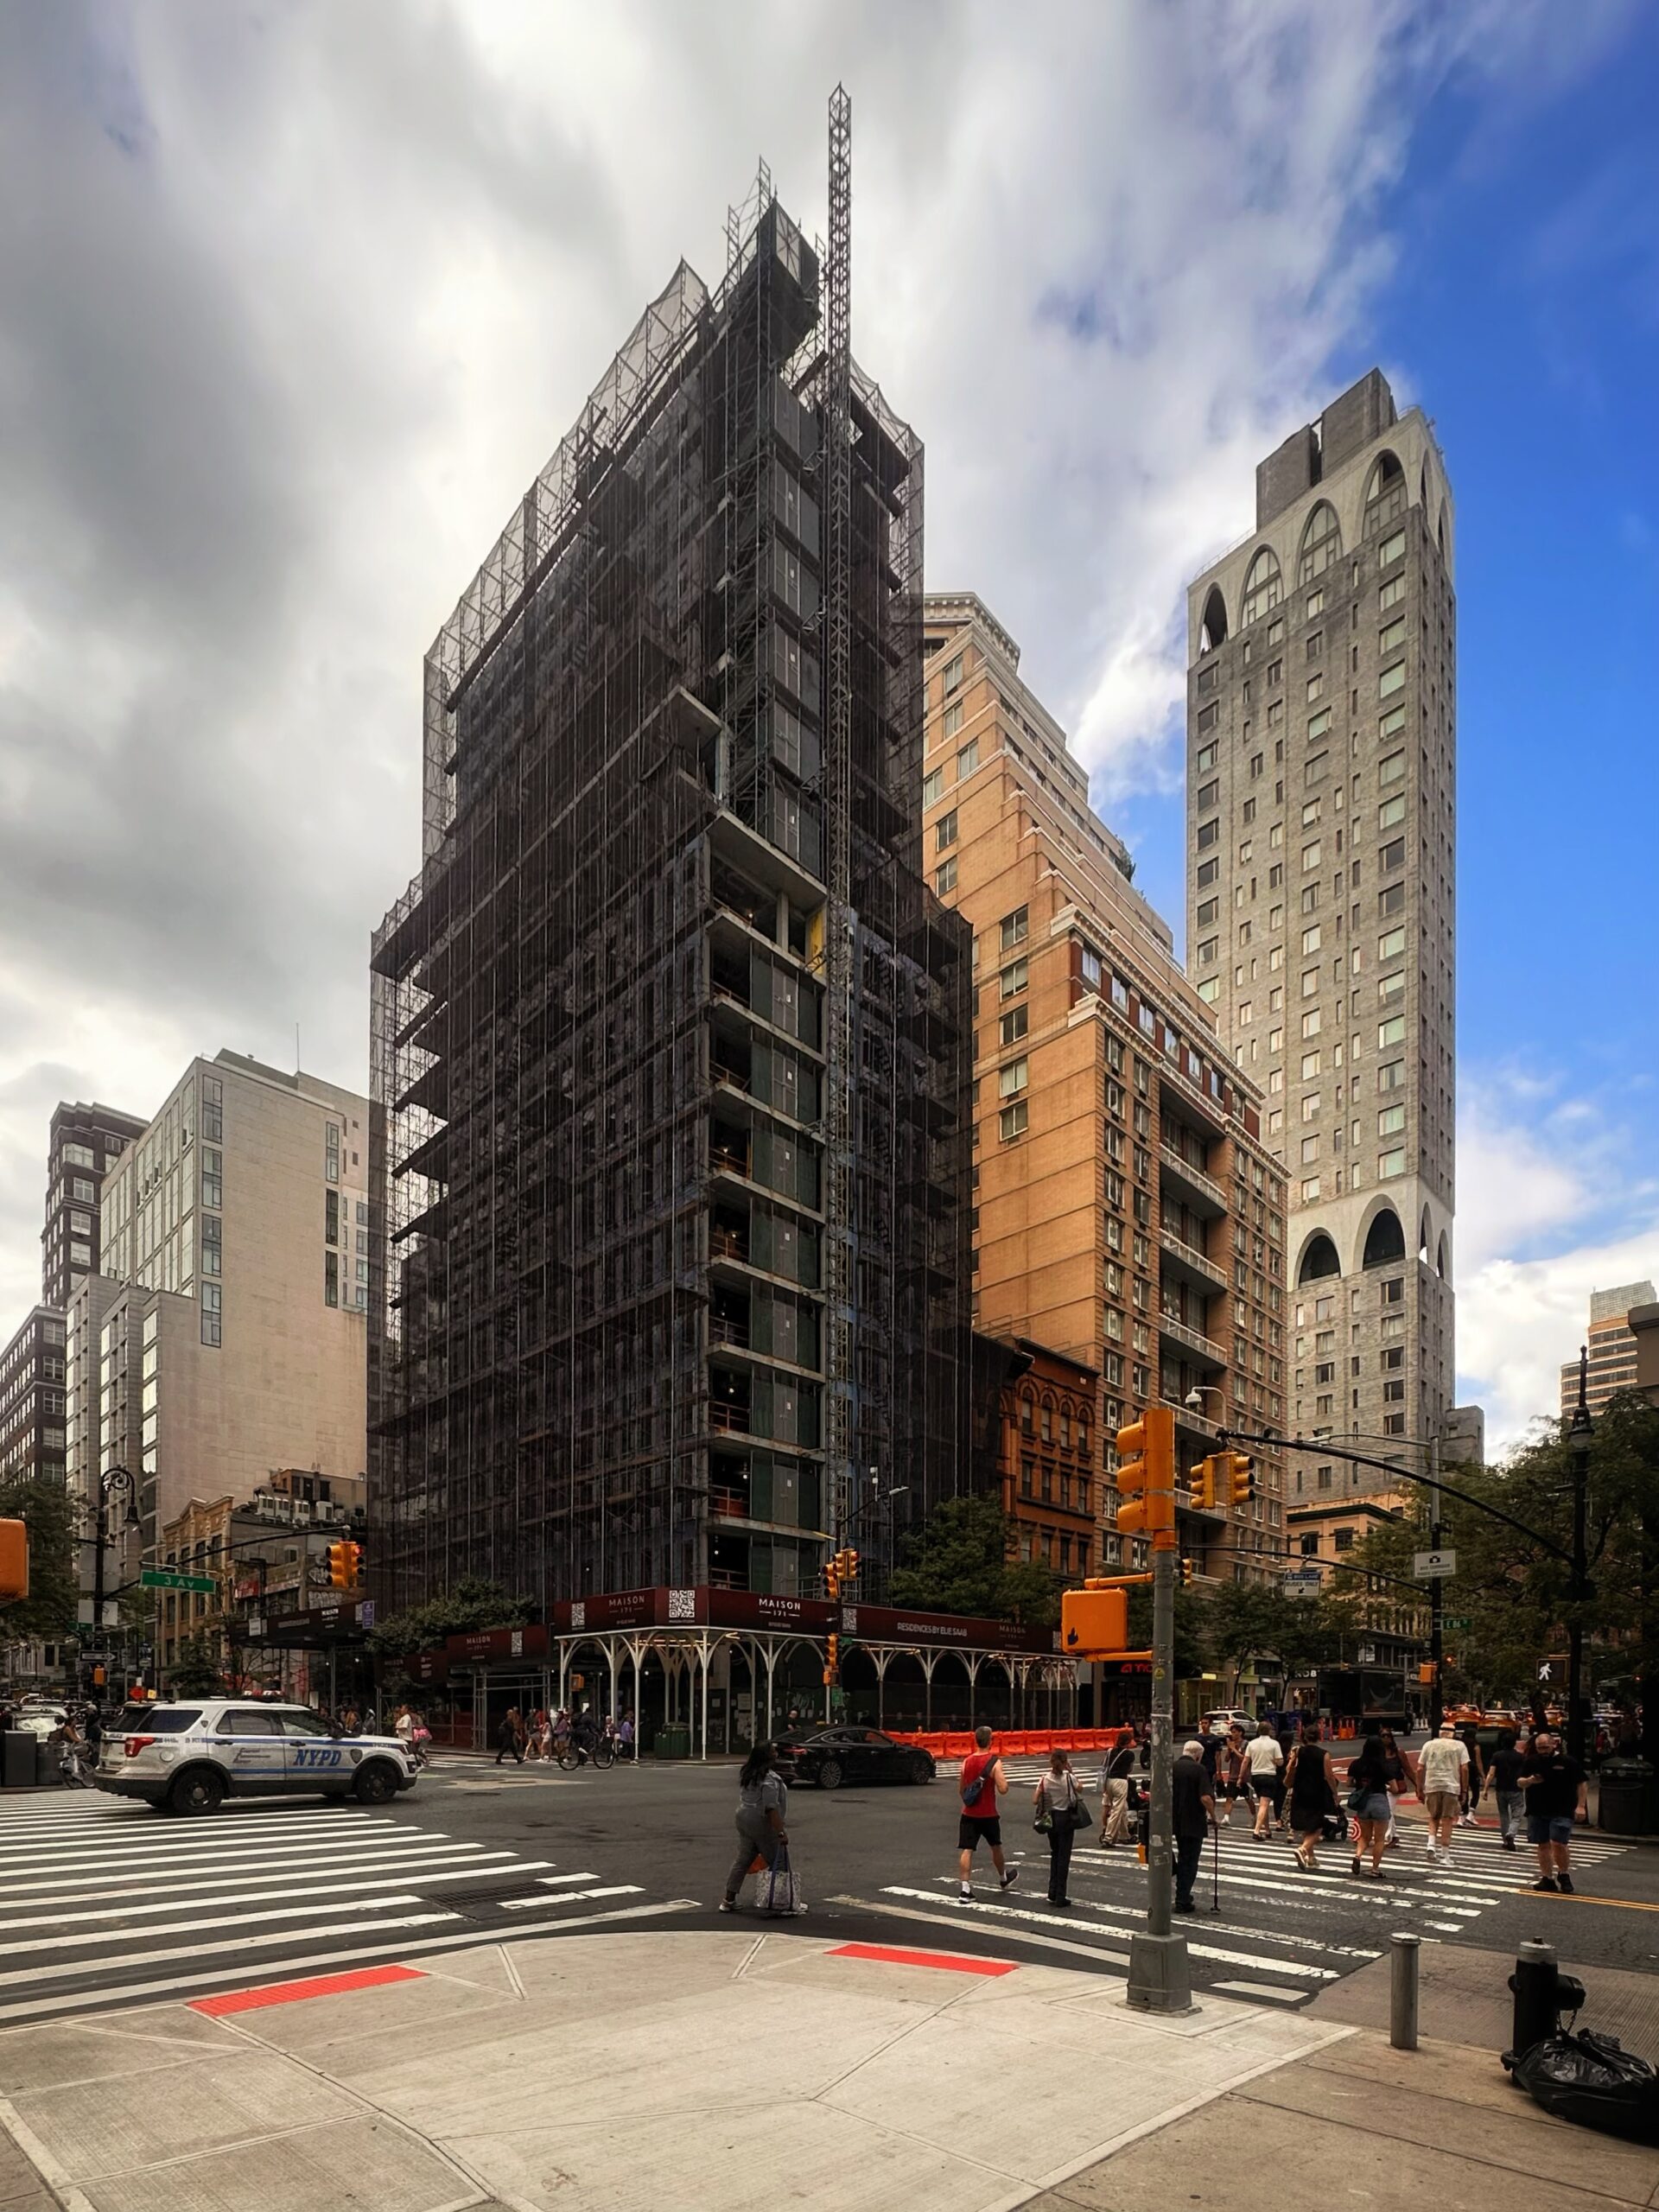
171 East 86th Street. Photo by Michael Young.
A hot office market demands a concurrently robust housing supply, and in July the Journal also reported that the city produced 38,682 new residential units in 2025, the highest annual tally on record in the six decades that lapsed since 1965.
Many of these units come in the form of residential conversions transforming aging Class B and Class C commercial space into new housing stock.
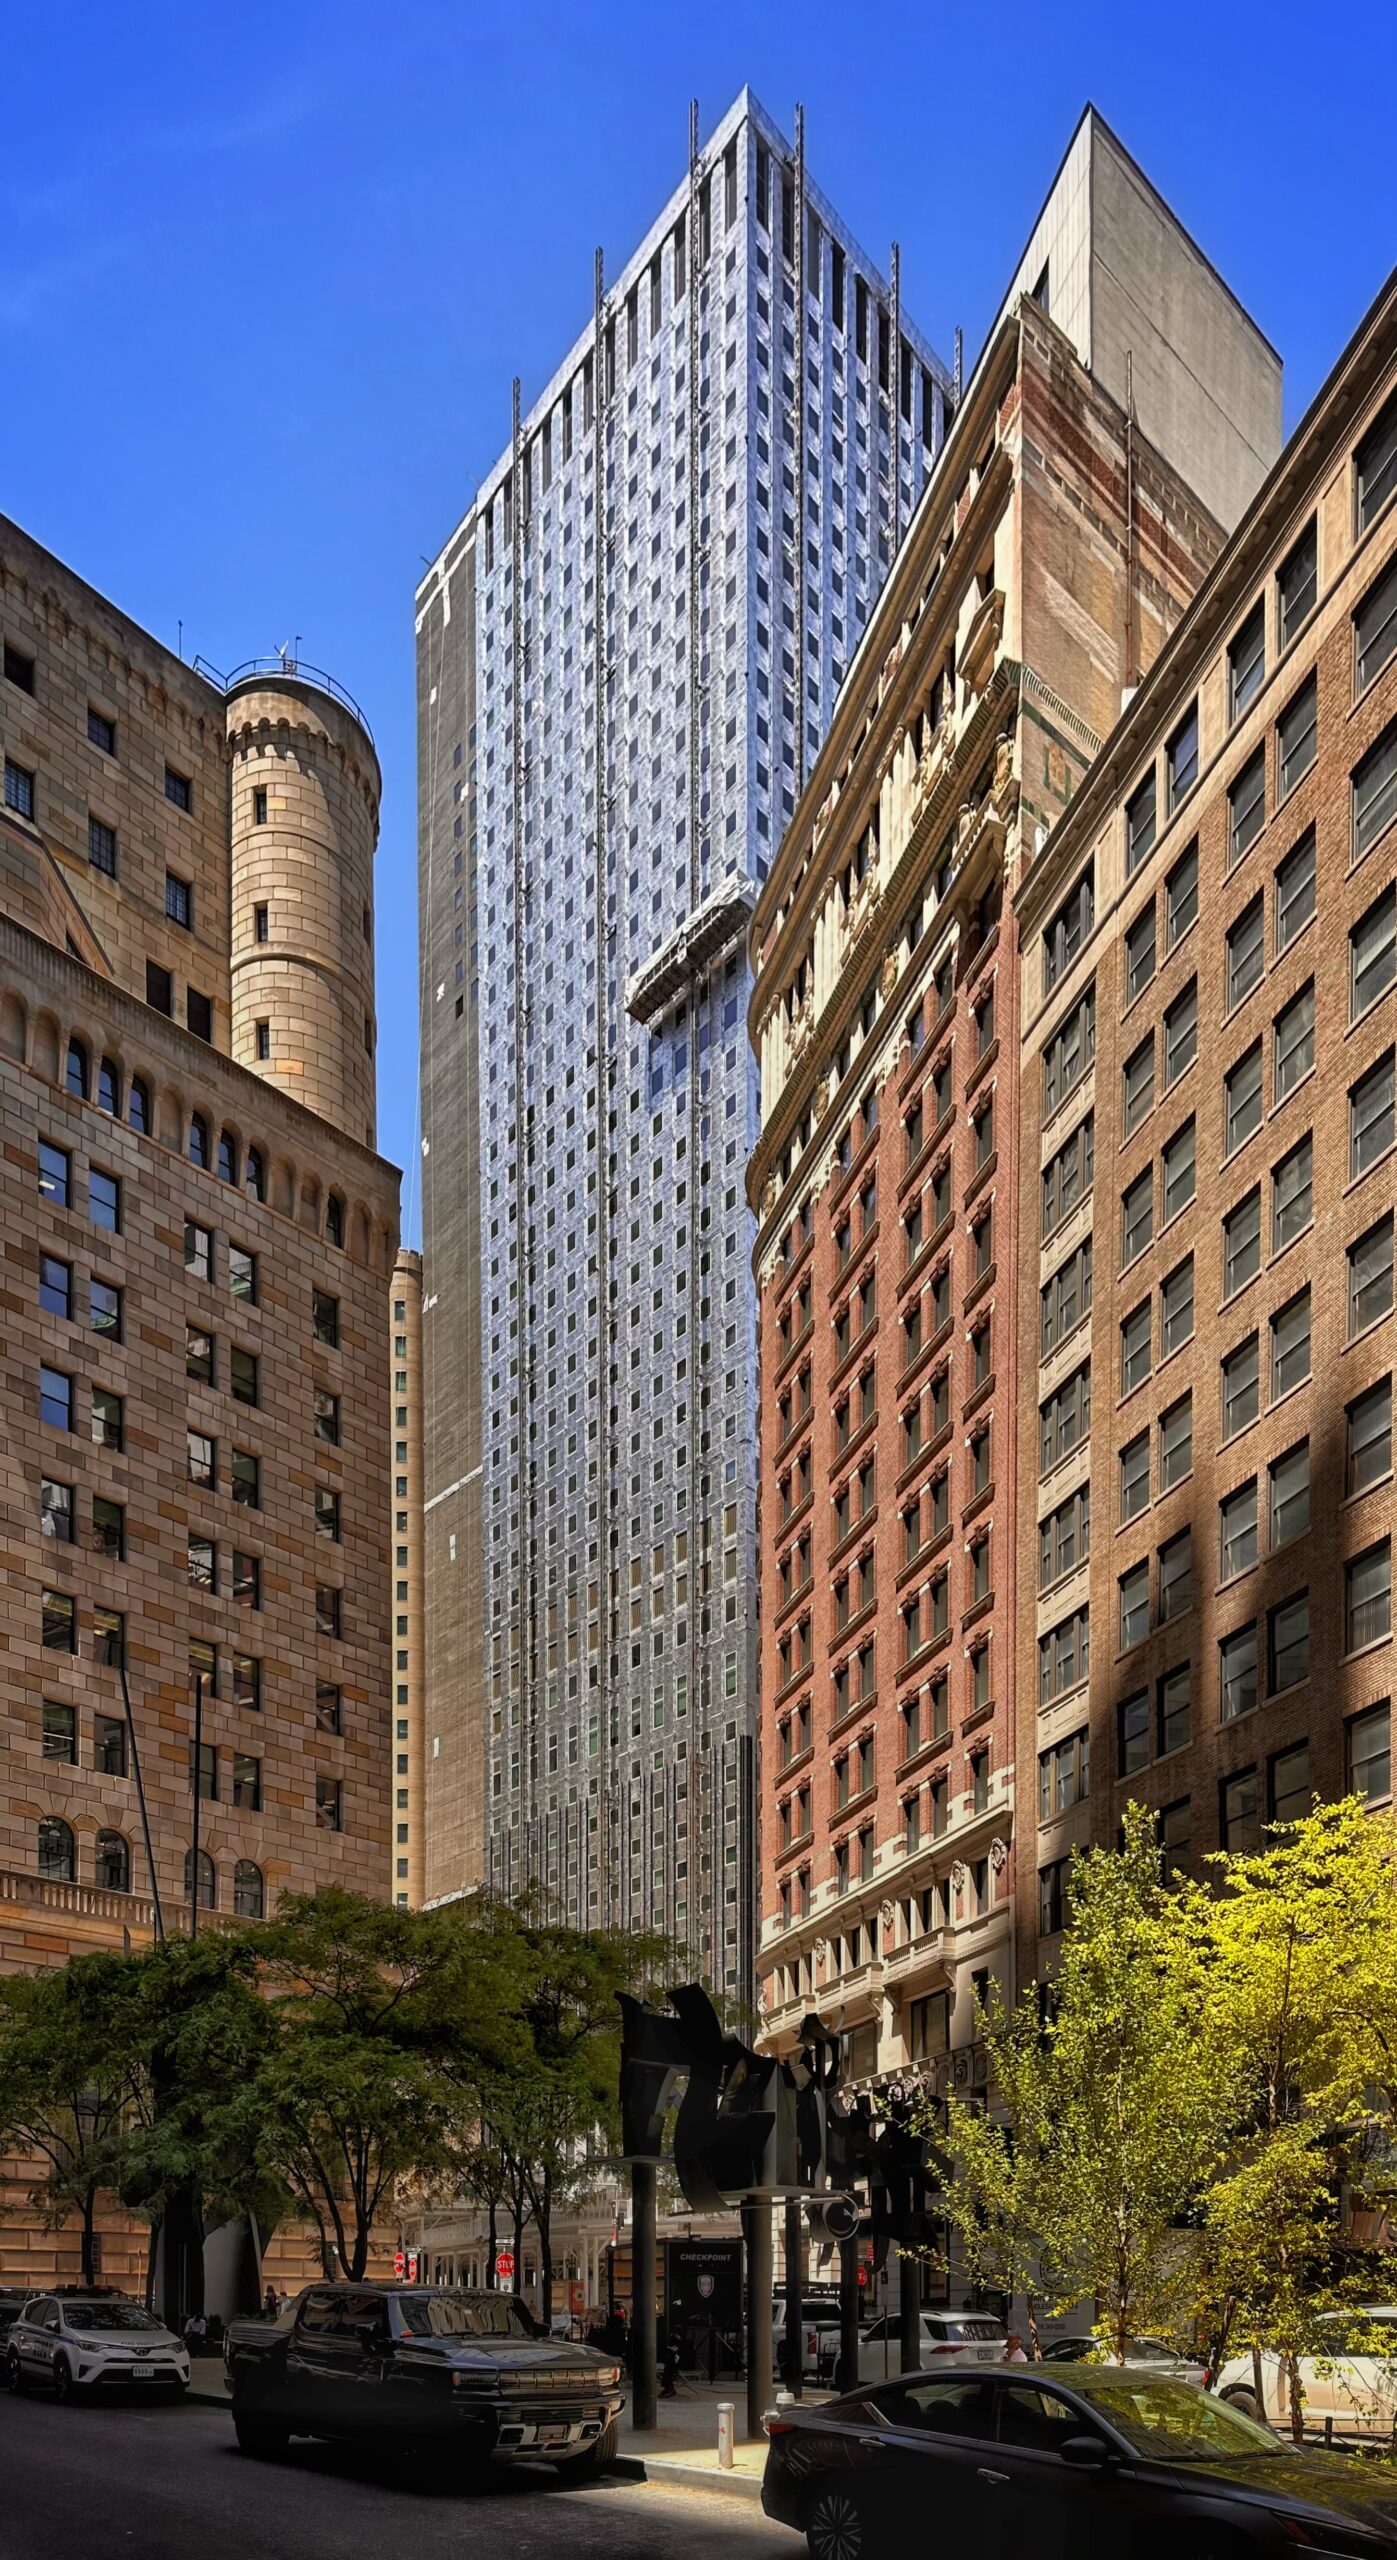
59 Maiden Lane. Photo by Michael Young.
This much-welcome trend, also expedited by recent city legislature that cuts much red tape associated with such projects, continues unabated even in the face of July’s structural near-collapse at the former Pfizer Building redevelopment at 219–235 East 42nd Street in Midtown.
Paradoxically, this genuinely worrying event did not only shed light on concerns inherent to major building renovations, but also brought the office-to-resi conversion trend into the public mainstream.
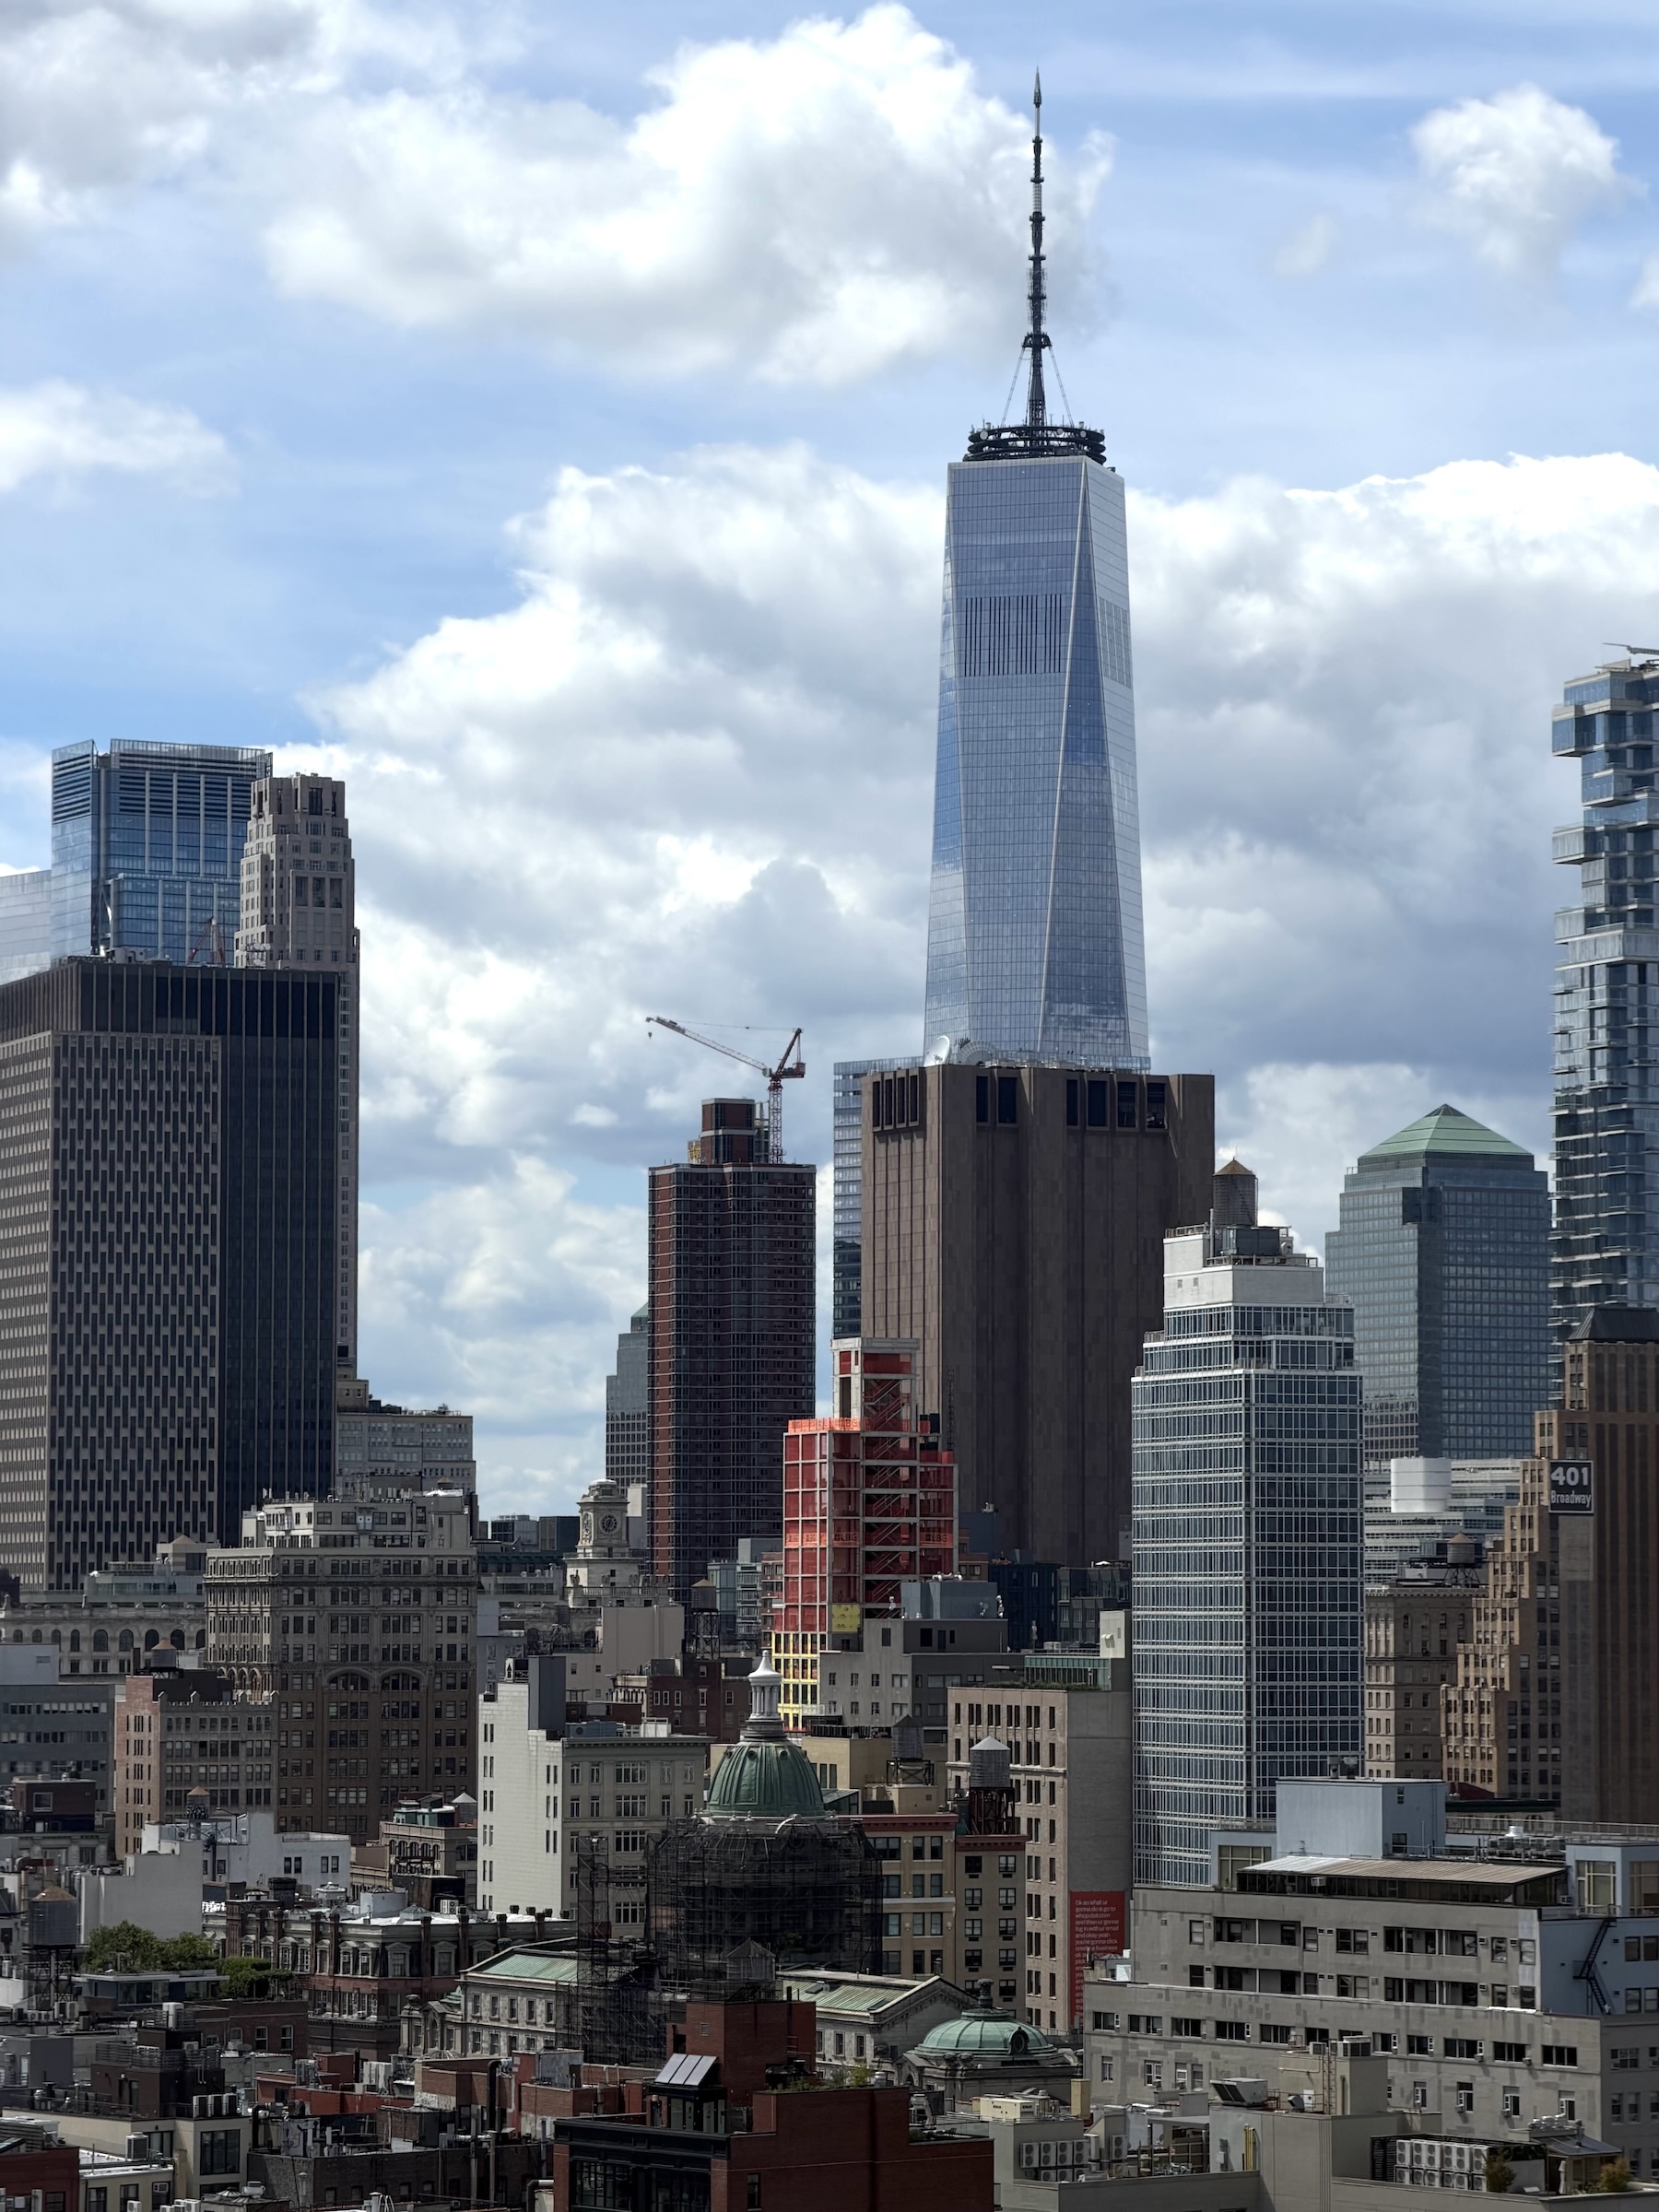
The Marq at 126 Lafayette Street. Photo by Matt Pruznick
According to a Compass report for Q2 2026, even the city’s luxury residential market is experiencing double-digit percentage growth, despite naysayer doom-and-gloom about “empty luxury towers” and even a potential pied-a-terre tax in consideration by the new city administration.
This is good news even for those of us that do not dwell in Billionaire’s Row supertalls, as multiple studies repeatedly show that an increase even in high-end housing supply decreases rents for all incomes; in basic terms, luxury housing lowers competition for apartments in the just-below-them bracket, which lowers prices all the way down the line.
Construction is also booming across the greater metropolitan area, relieving housing pressure within the five boroughs. New skylines are rising in localities such as Jersey City, Newark, New Rochelle, Yonkers, White Plains, and even further out in the metropolitan area orbit such as in New Brunswick.
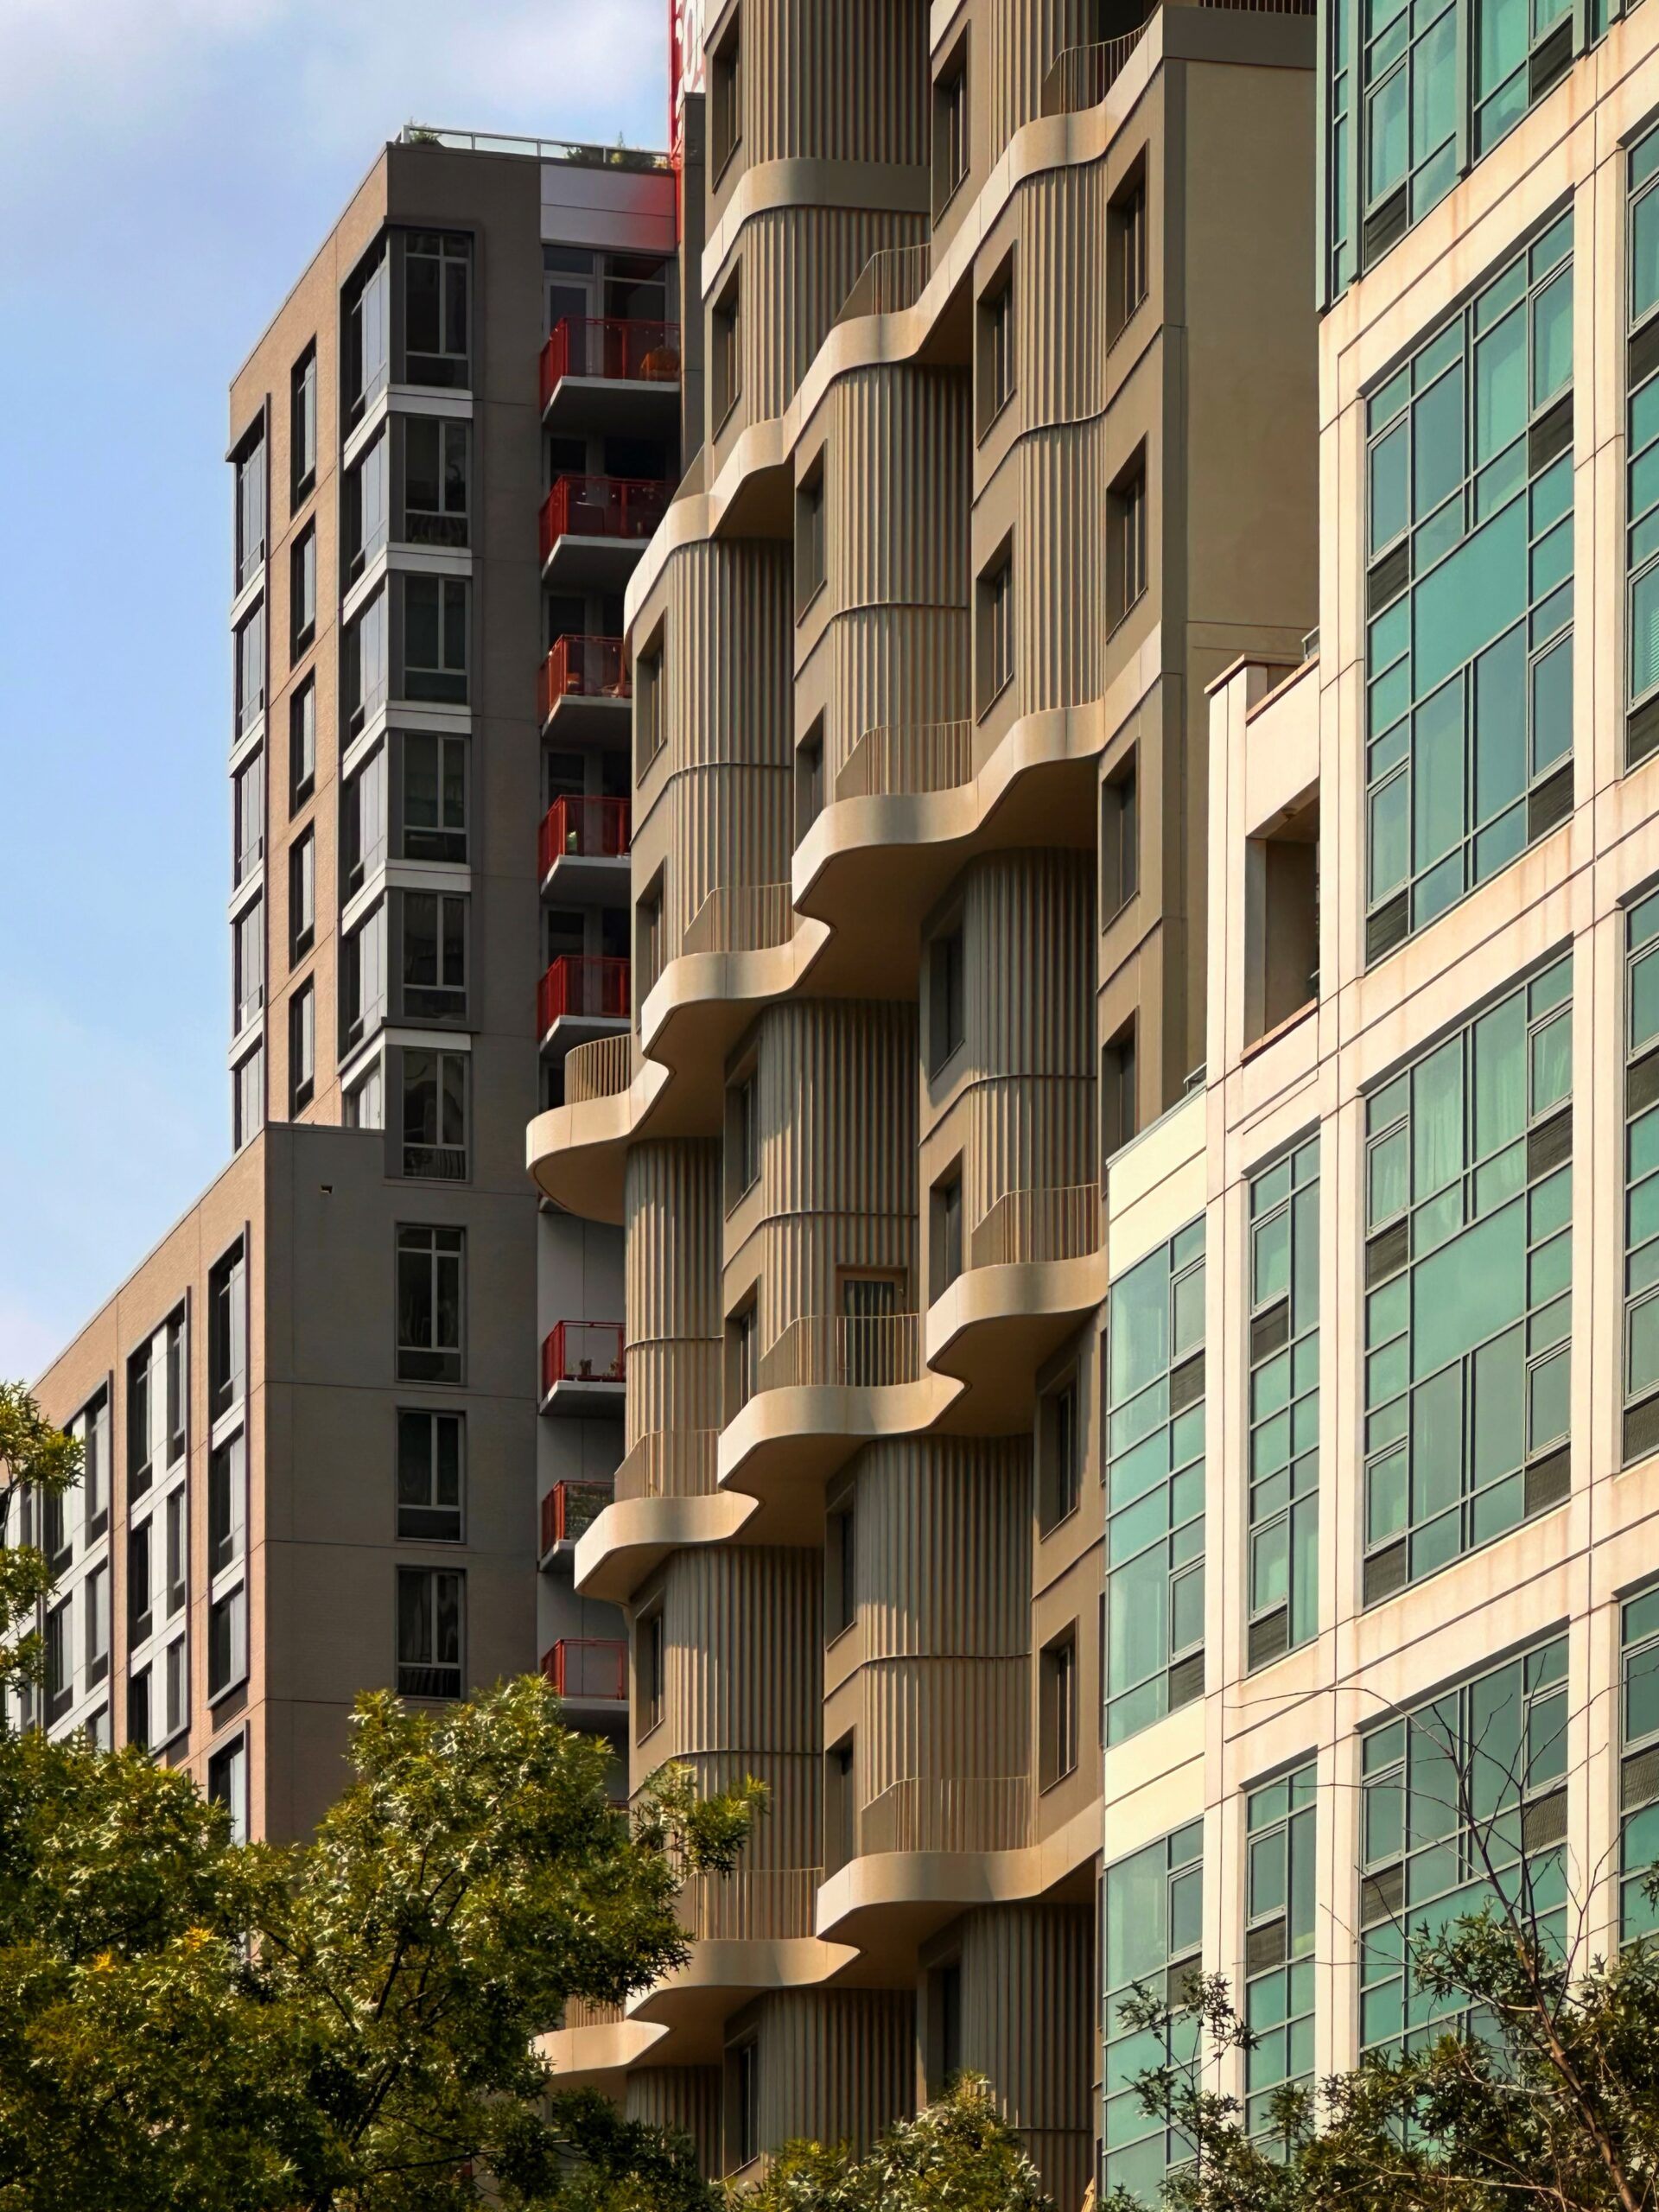
Radiant LIC. Photo by Michael Young.
Expansive, dense urban development is impossible without proper mass transit access. The Greater New York metropolitan area already boasts by far the nation’s most comprehensive rapid transit network. The city is home to three out of four of the busiest train stations in North America, with Penn Station at #1, Grand Central Terminal at #3, and Jamaica Station at #4, with the Newark Penn Station at #9 and Grand Central Madison at #10 making for five out of ten of the continent’s busiest rail hubs.
The city’s subway system boasts the largest number of stations in the world and the longest trackage and greatest ridership numbers in North America, with ridership figures on the Lexington Line alone (the 4/5/6 trains) exceeding those of all of Chicago Transit Authority (CTA) or San Francisco’s BART. However, much work remains to be done just to keep up with the city’s current needs, to say nothing of expanding capacity to meet future demand.
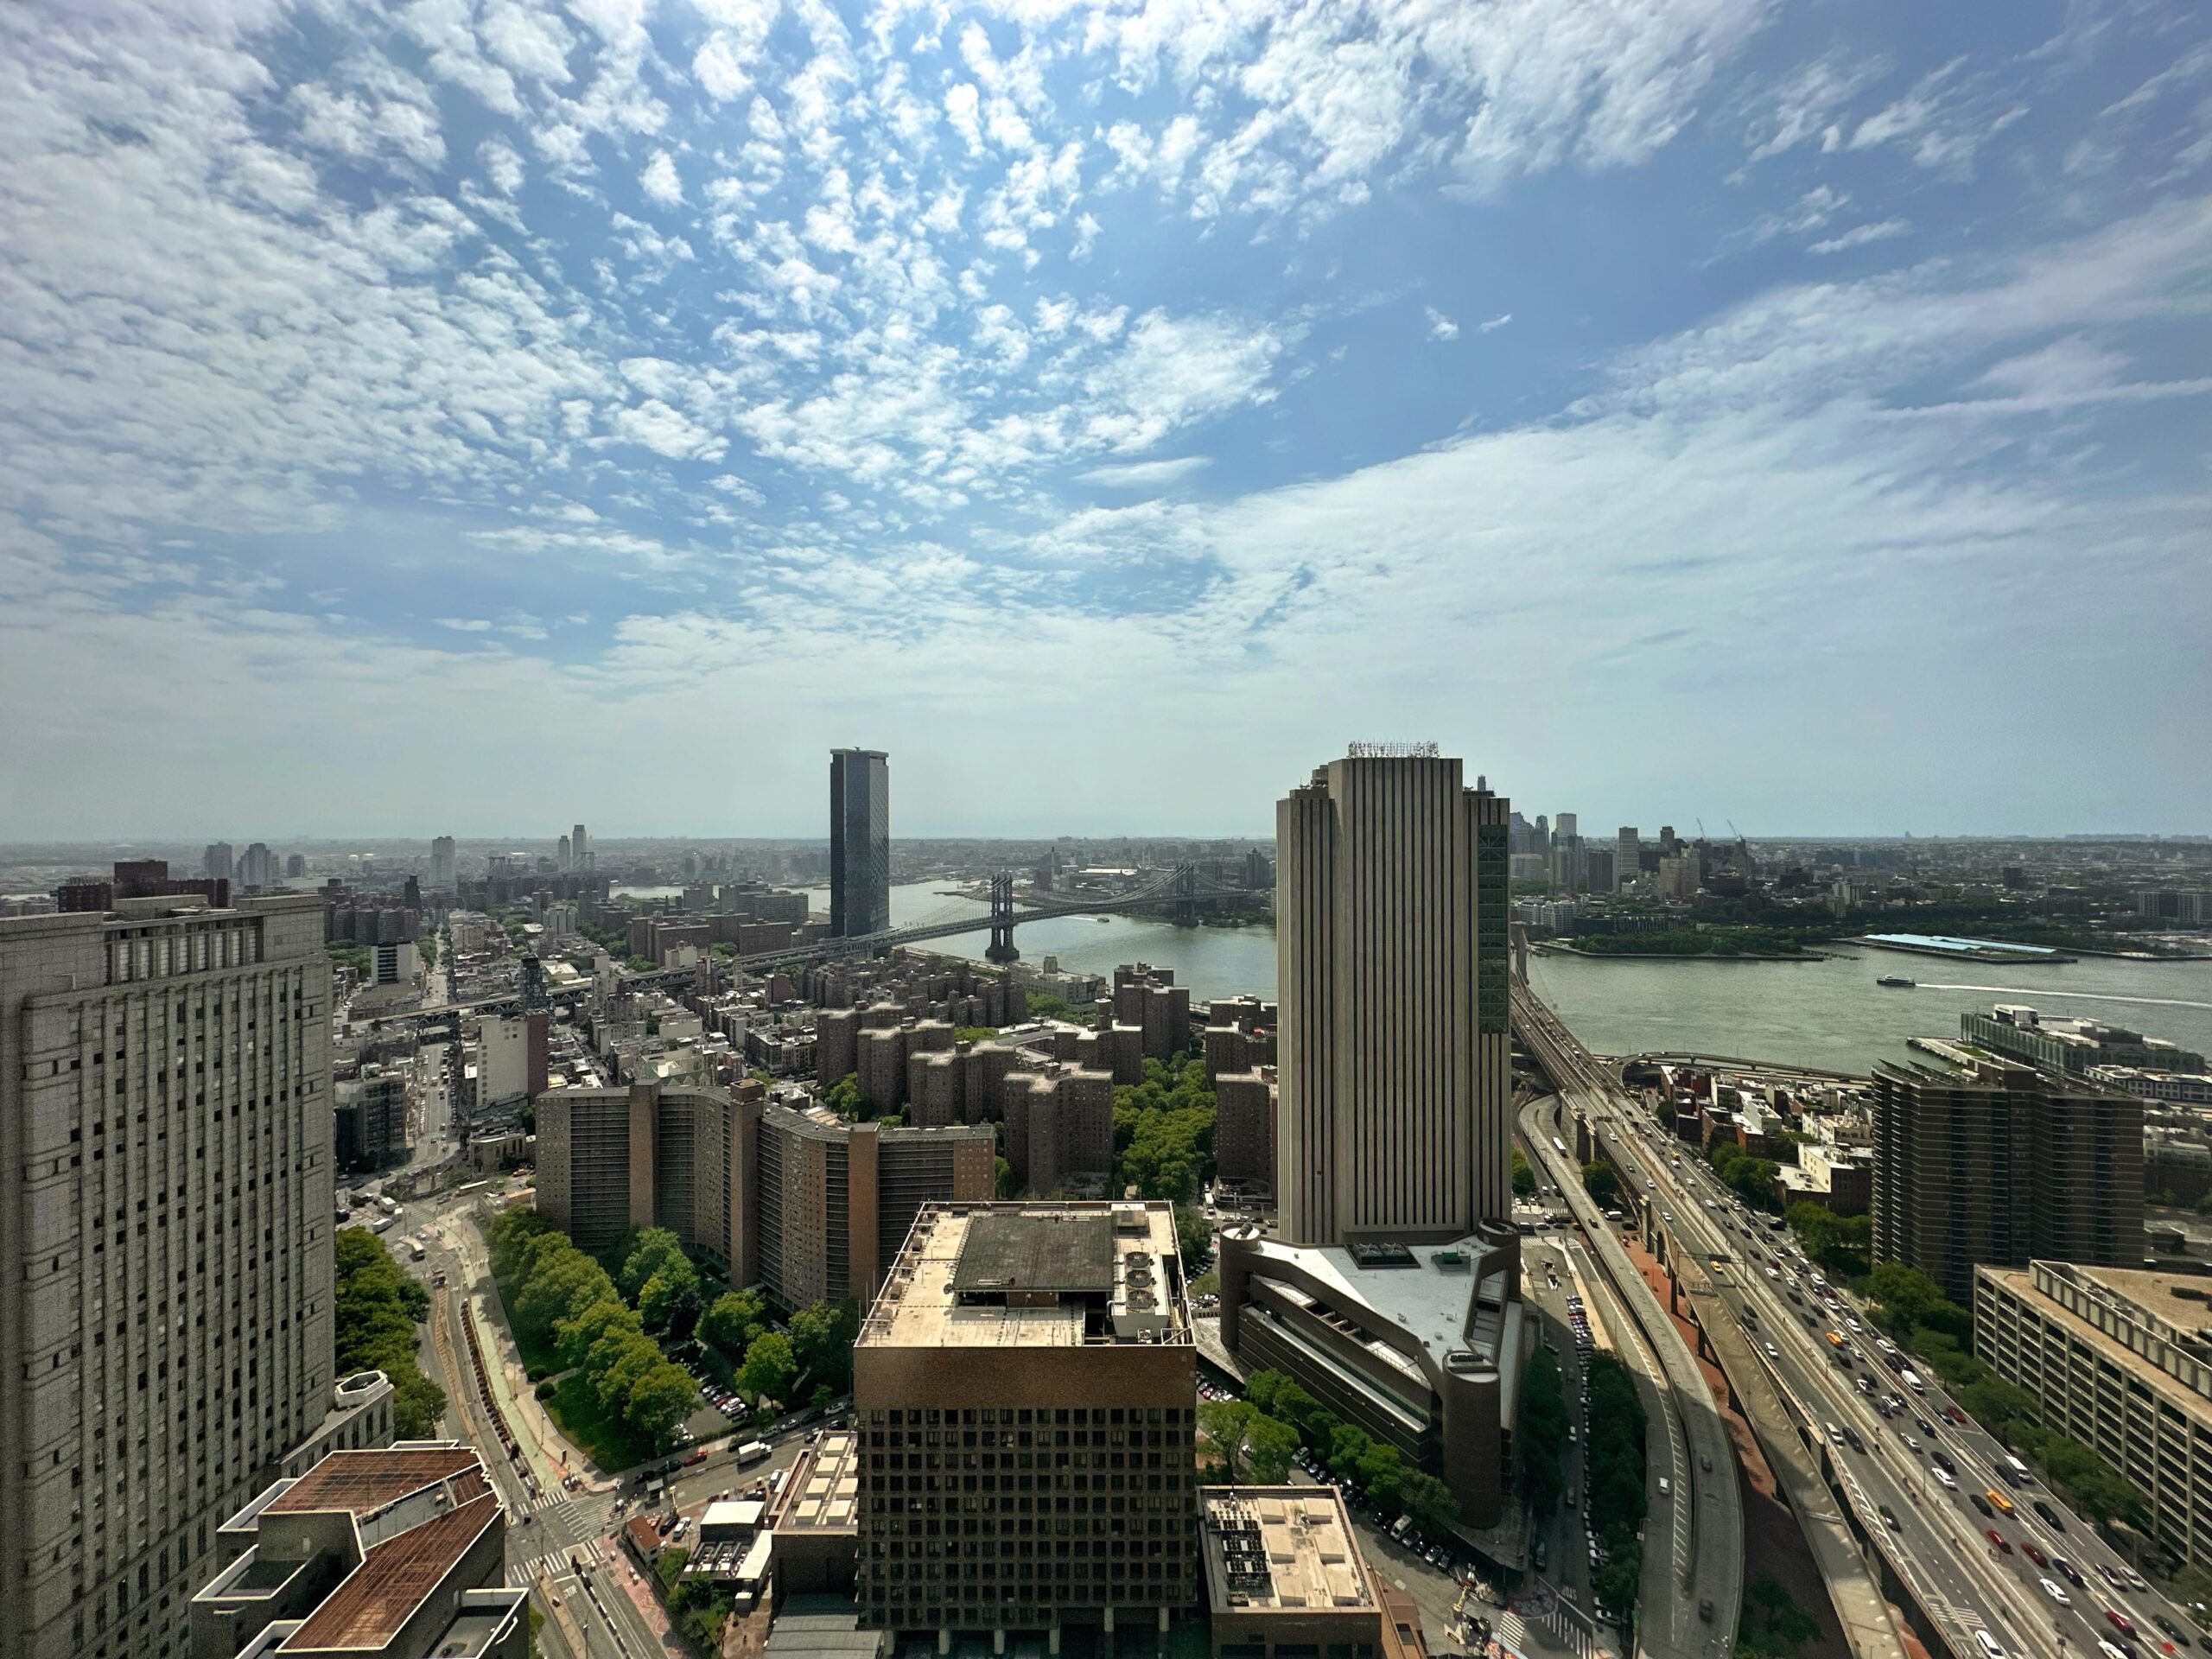
Looking east from 1 Centre Street. Photo by Michael Young.
Fortunately, New York’s era of car-centric development is finally in the past and leaders are finally making significant investments into mass transit expansion.
Construction on the Second Avenue subway line continues to make meaningful advancements. First planned in 1920 to replace aging elevated lines on the Upper East Side and supplement the busy Lexington Avenue line, work advanced in fits and starts over the years, which included construction and subsequent abandonment of a ten-block tunnel segment in the 1970s, and the opening of the first phase of the line, up to 96th Street, in 2017.
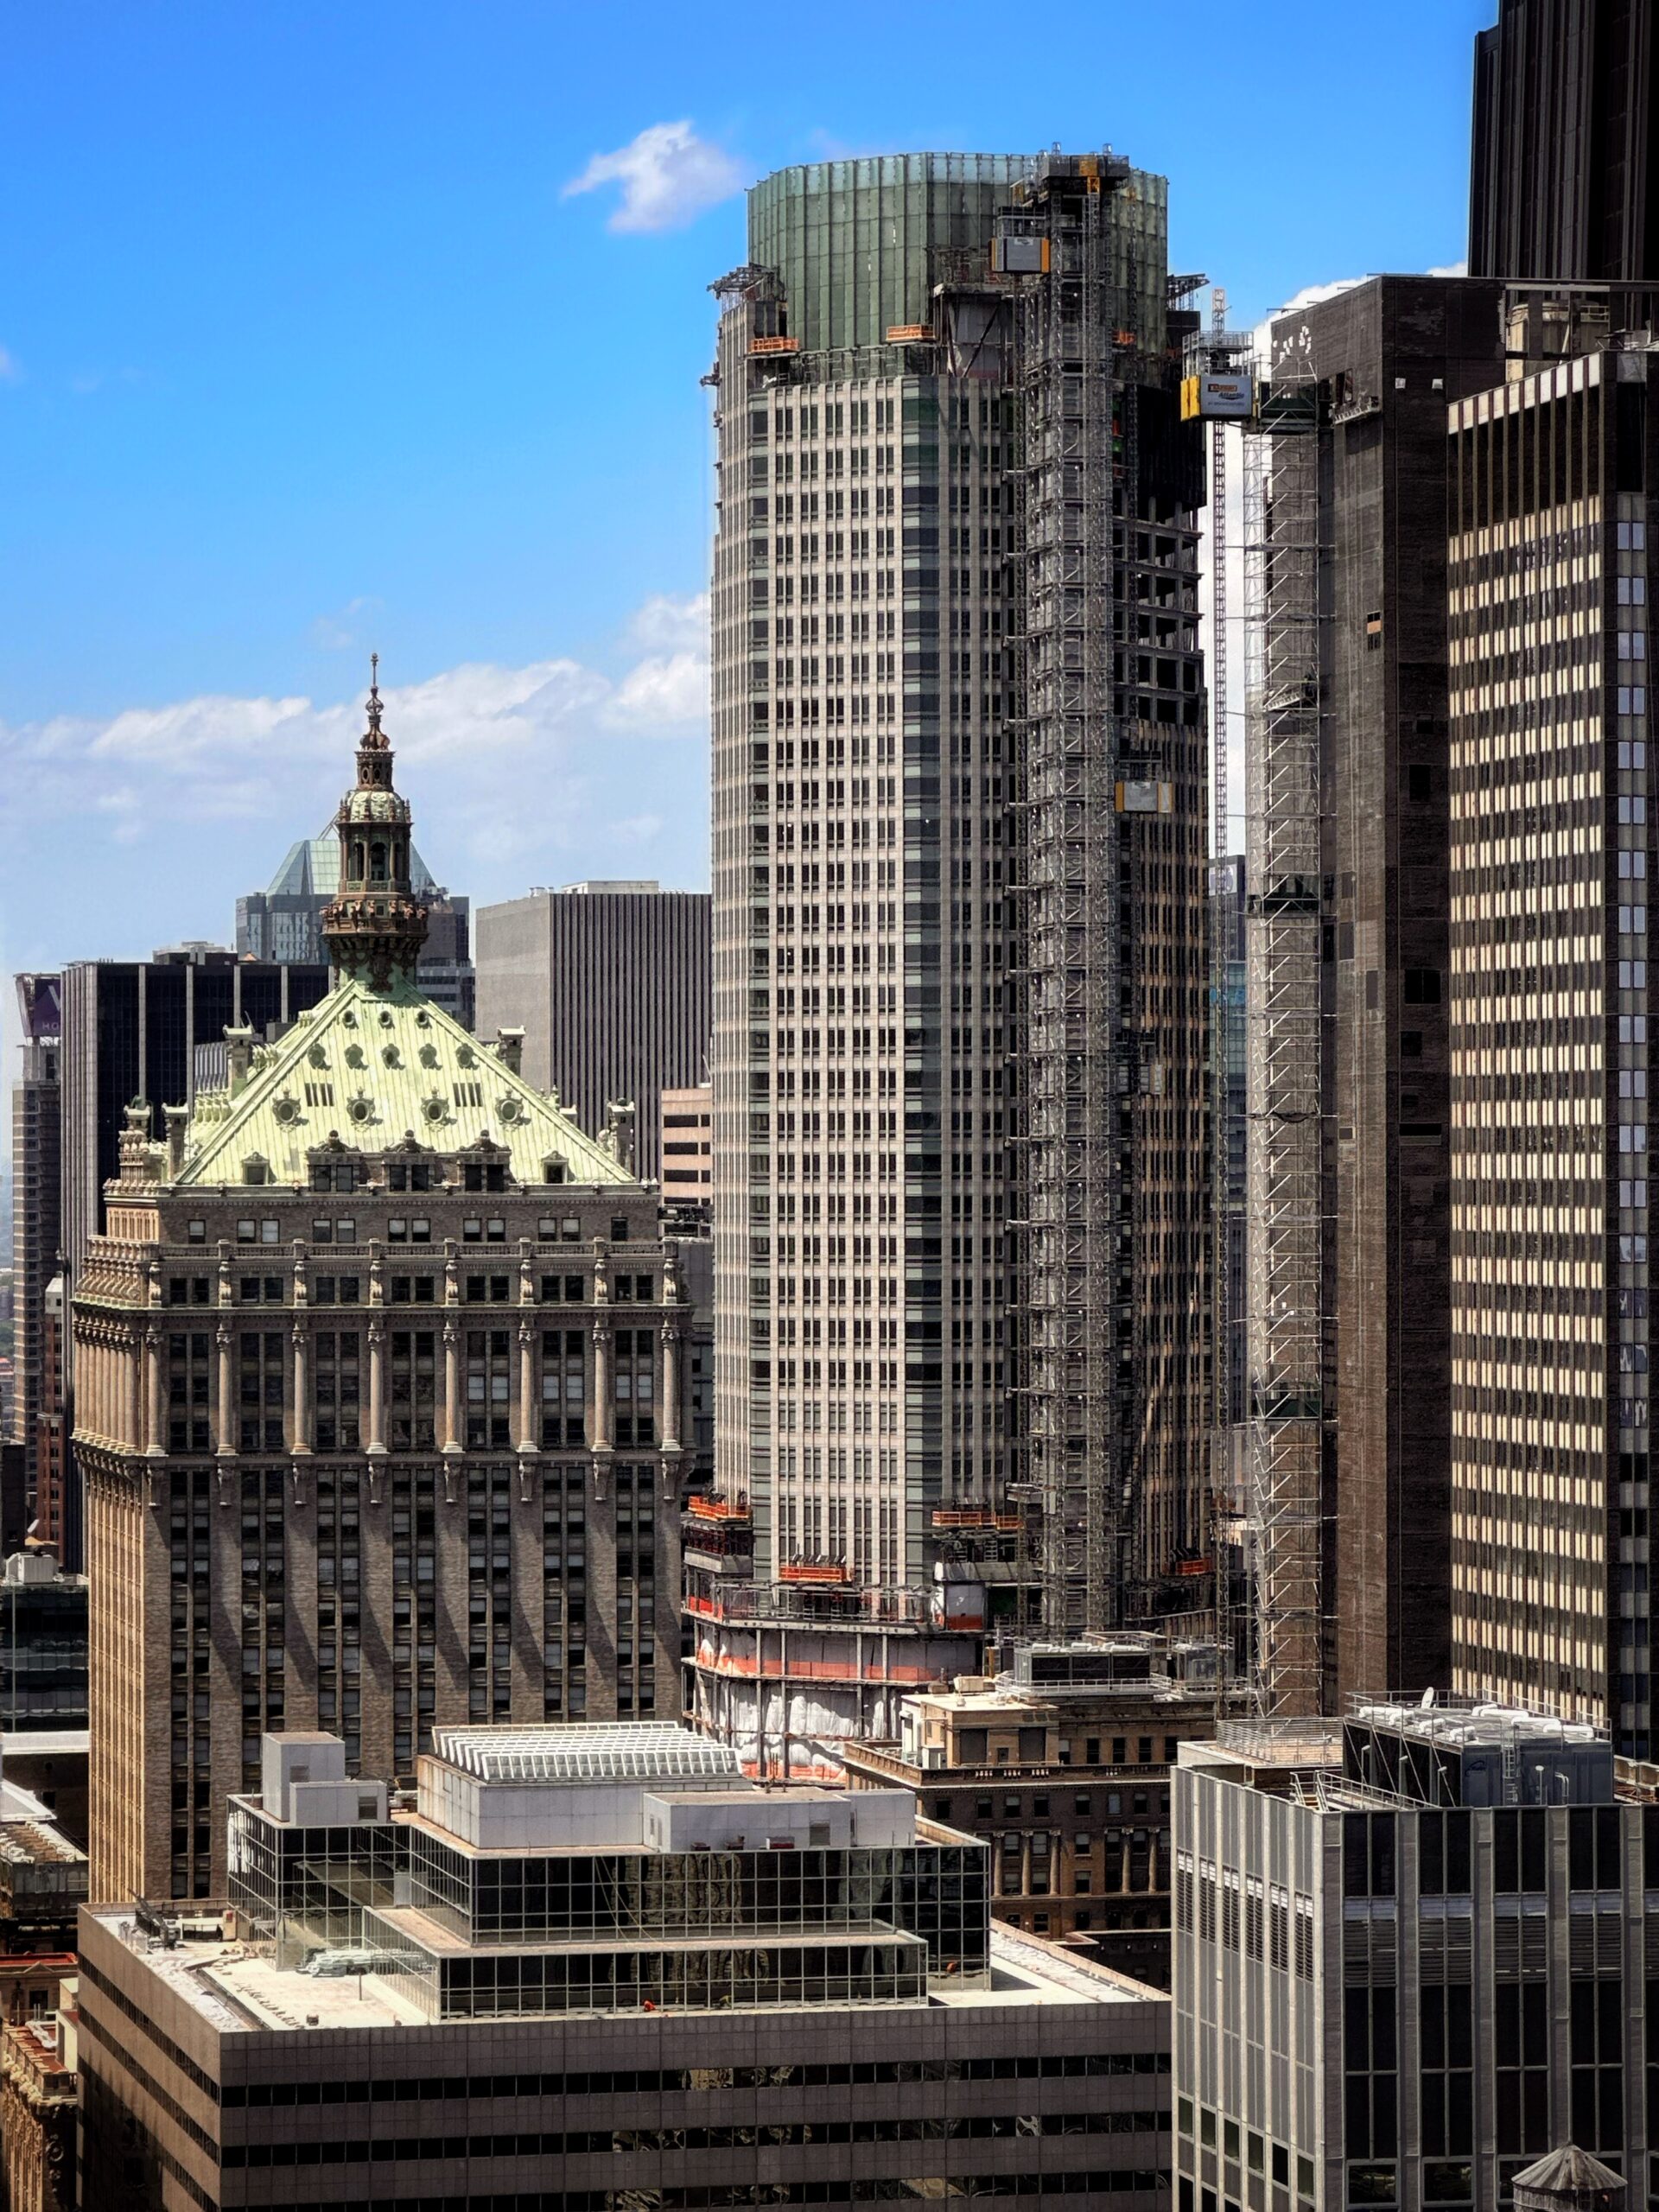
383 Madison Avenue. Photo by Michael Young.
In July, Governor Hochul took part in a groundbreaking ceremony at a launch site for a tunnel boring machine that, in the coming years, will extend the line through East Harlem and then crosstown westward along 125th Street. Utility relocation work, a tedious yet all-important process, has been ongoing for at least the past year.
The new subway line not only offers much-needed subway access to some of the most densely populated neighborhoods in the nation, but it also enabling a boom of high-density residential construction that is currently sweeping across the Upper East Side.
The multibillion-dollar project is being partially financed by the congestion pricing program (which tolls cars entering lower and mid-Manhattan), as is the MTA’s extensive accessibility program, which will equip over 60 stations with ADA features such as elevators by 2029 and aims to achieve 95 percent station accessibility by 2055.
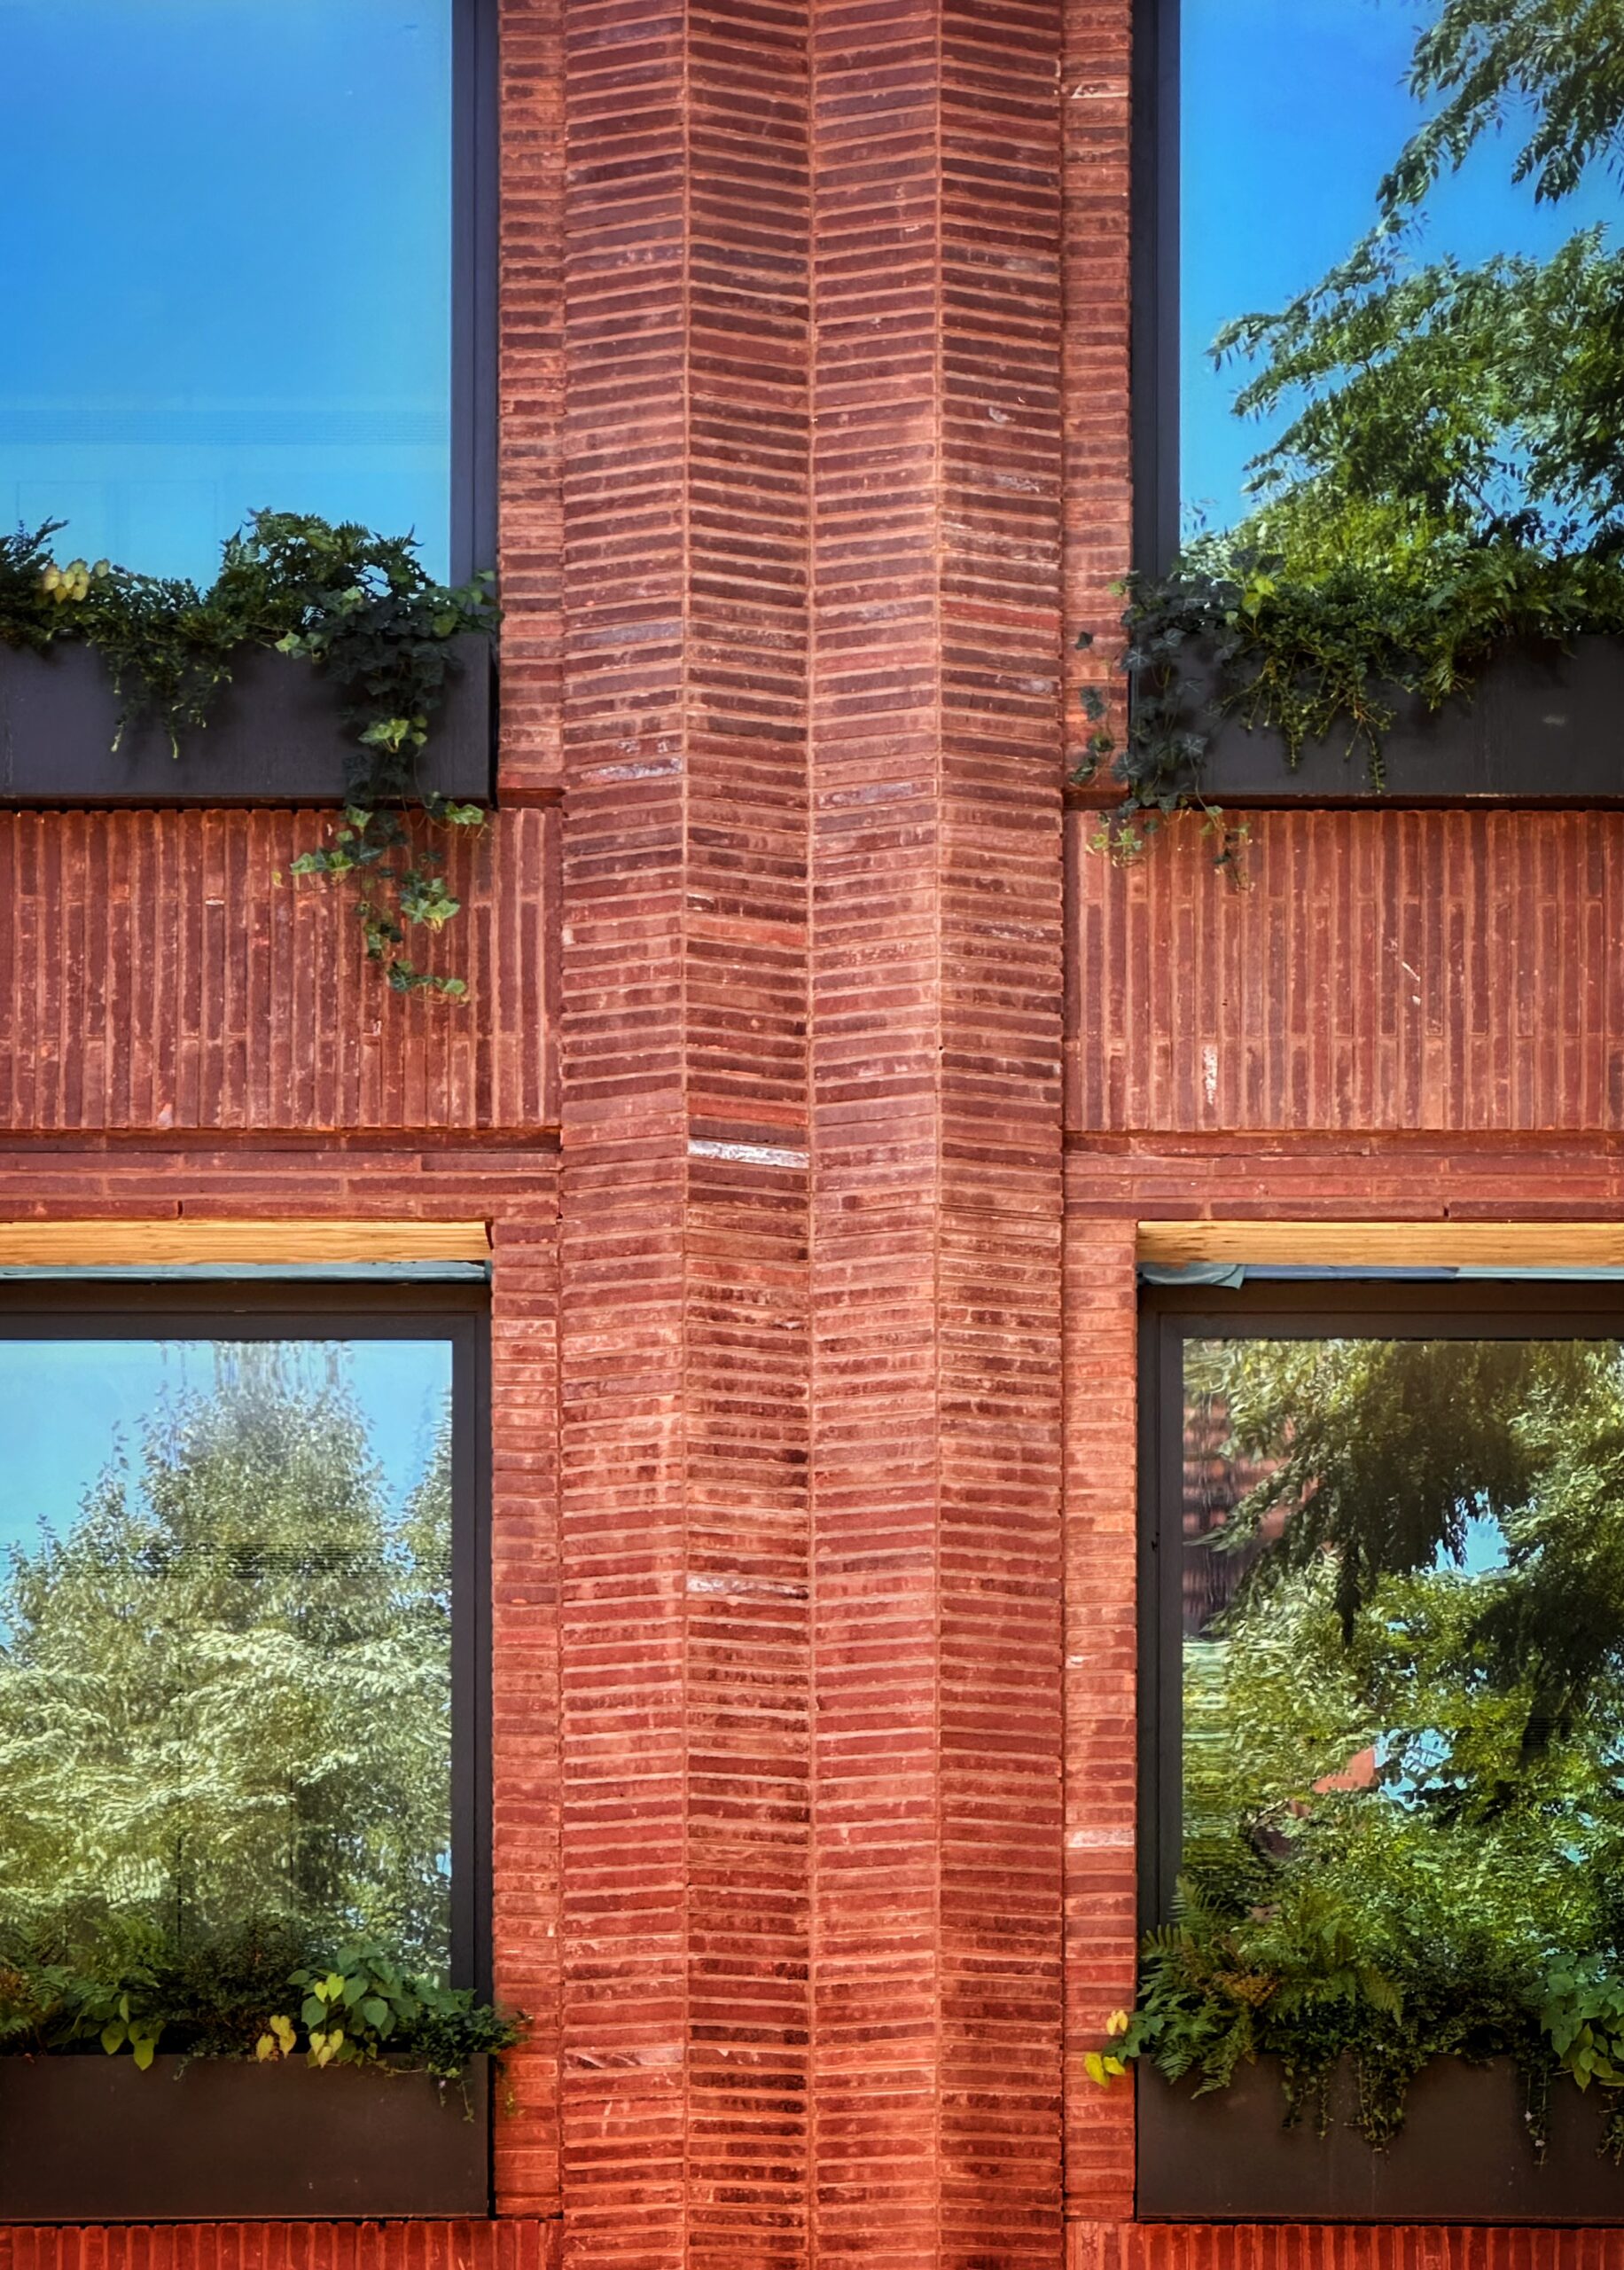
256 East 4th Street. Photo by Michael Young.
Equally important work is taking place elsewhere in the system. The Penn Station Access project will connect Metro-North Railroad‘s New Haven Line to Penn Station via the Hell Gate Bridge and add four commuter stations, allowing for direct commutes both to Midtown and Westchester County and Connecticut to residents of subway-starved areas in eastern Bronx; construction is currently in advanced stages of progress.
The MTA is also in the preliminary design and community outreach stages of planning for the Interborough Express, a light rail line proposed along an existing freight right-of-way. The IBX will introduce 18 new stations along an 14-mile route between Bay Ridge, Brooklyn, and Jackson Heights, Queens, with numerous subway and Long Island Rail Road connections along the way.
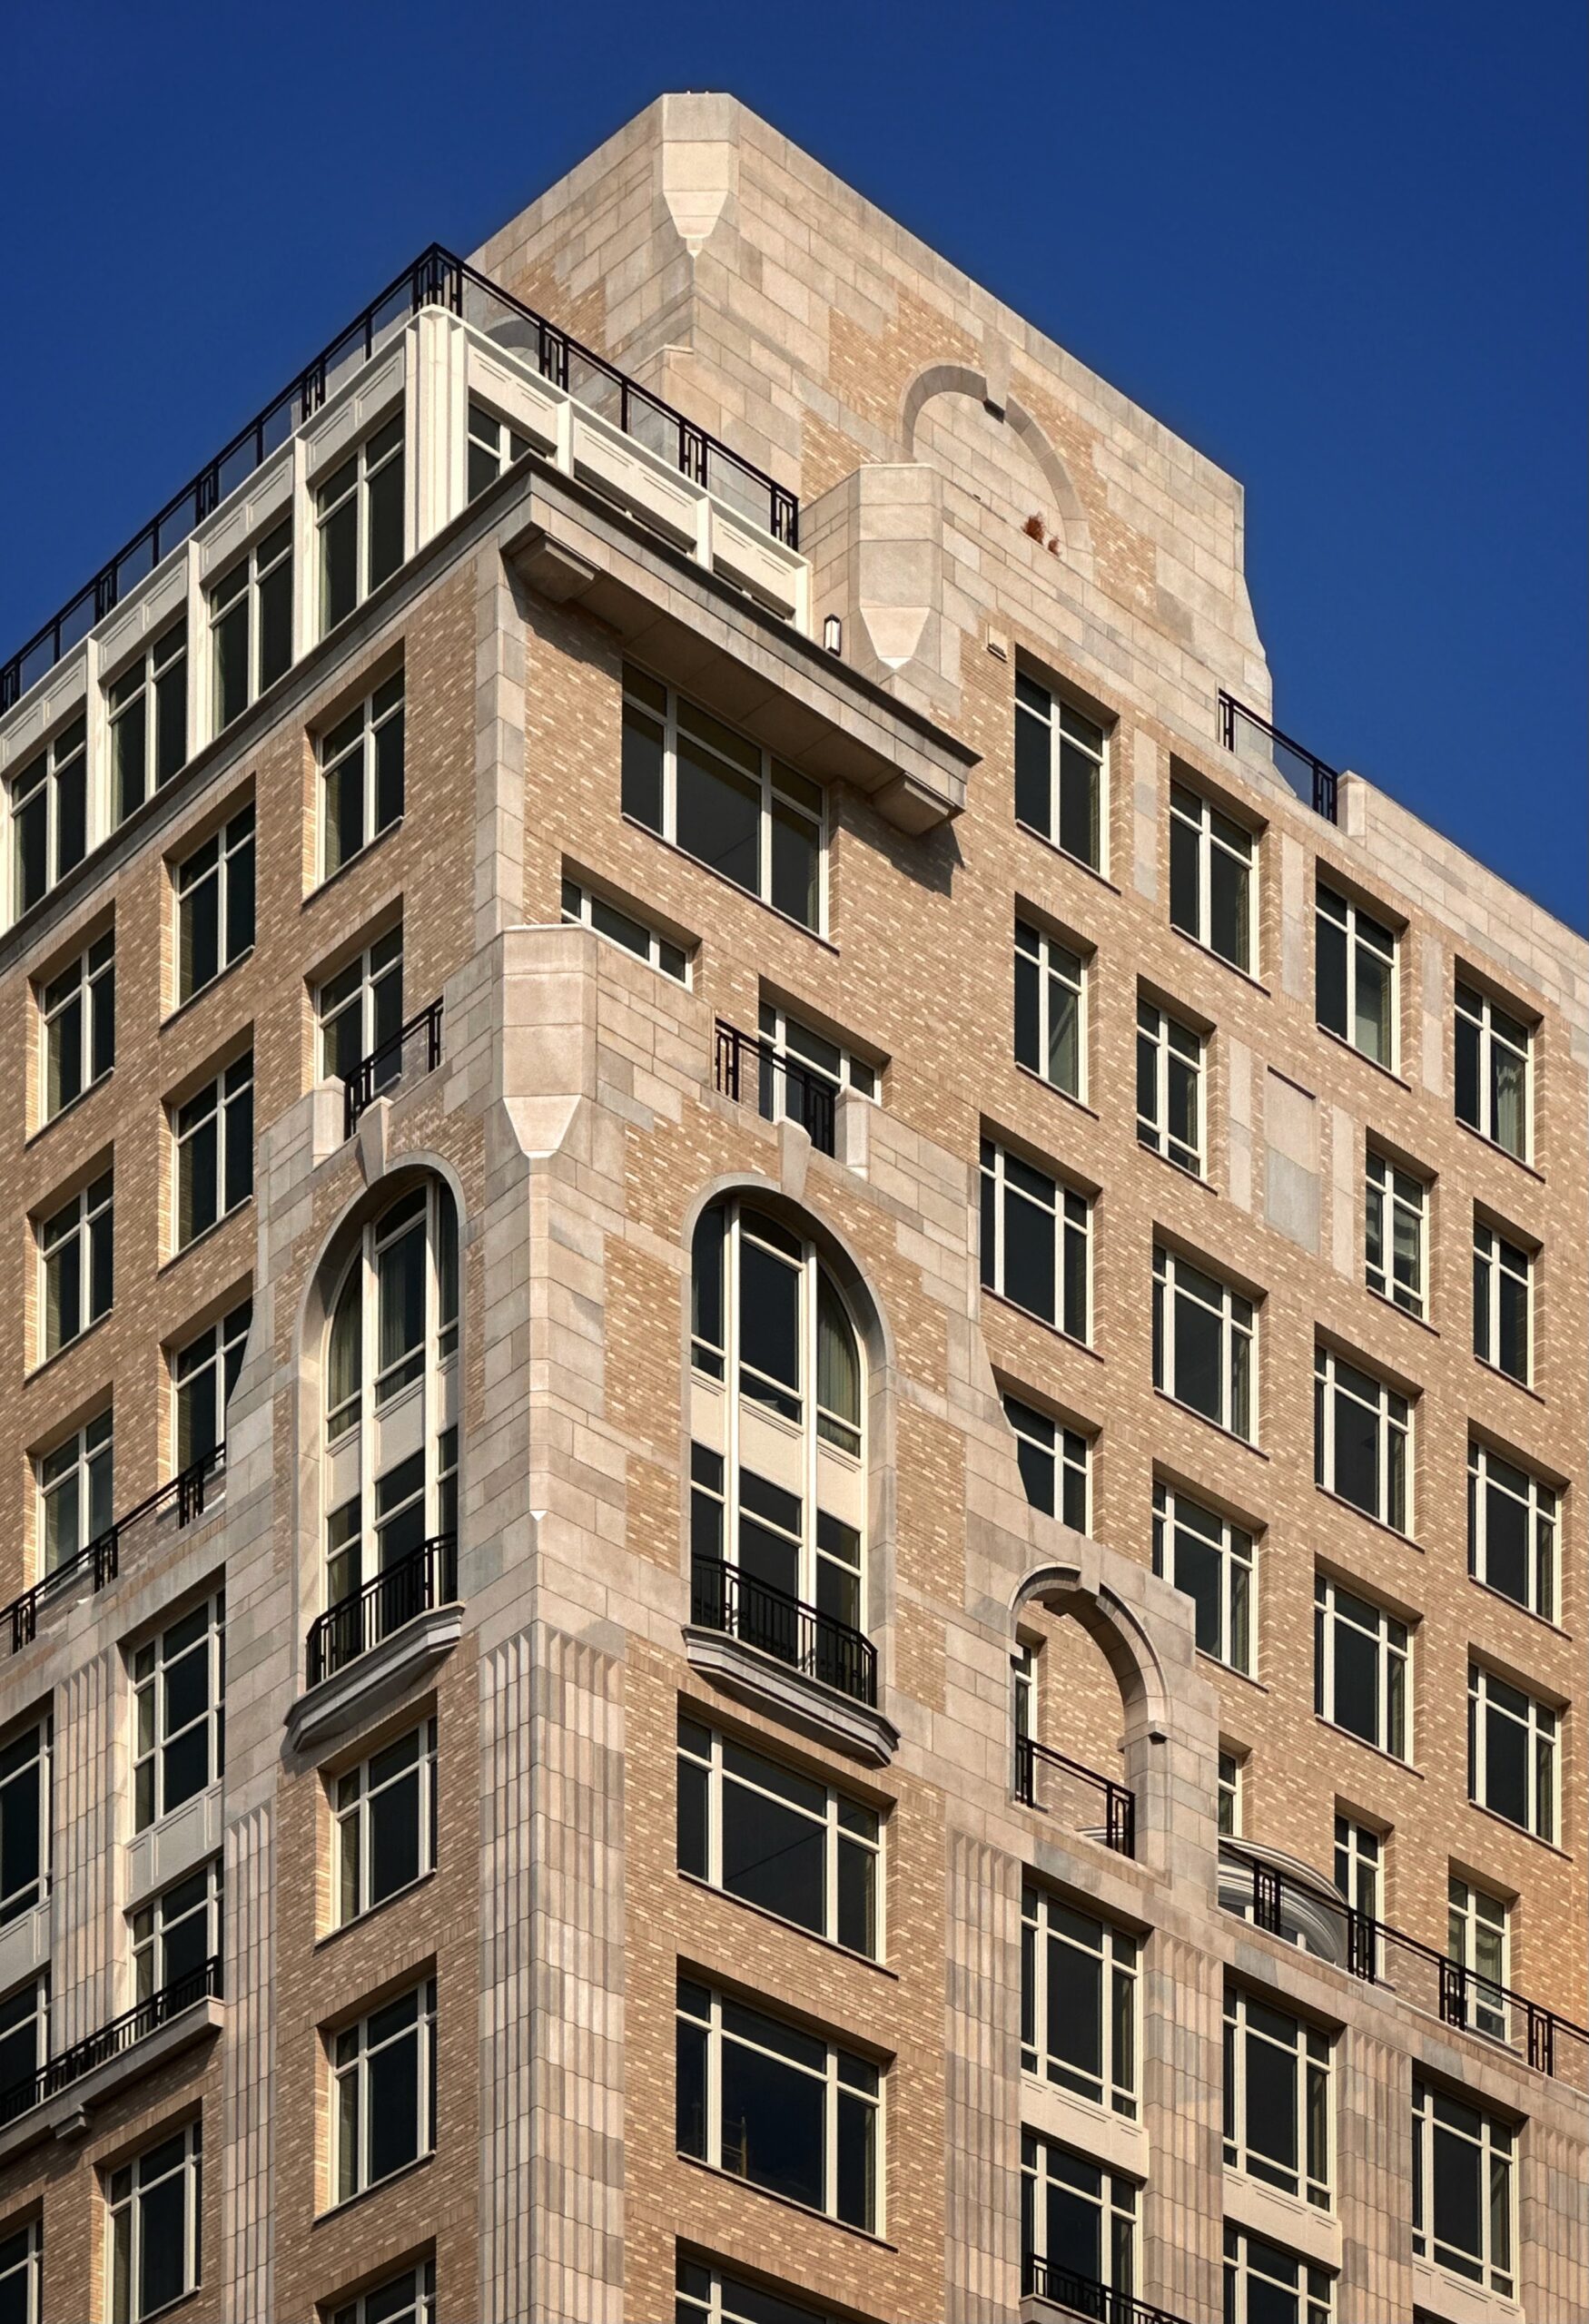
The Henry at 211 West 84th Street. Photo by Michael Young.
In the near future, two tunnels currently under construction under the Hudson River and through the adjacent area will significantly ease commuting between Penn Station, the busiest rail hub on the continent, and New Jersey and the rest of the Northeast Corridor.
Preliminary planning work is also currently in progress for a major overhaul for the transit hub, which will ideally not only increase platform sizes and passenger throughput capacity, but will also enable through-running, allowing for currently impossible direct commute mass transit options such as one between central Jersey and Connecticut.
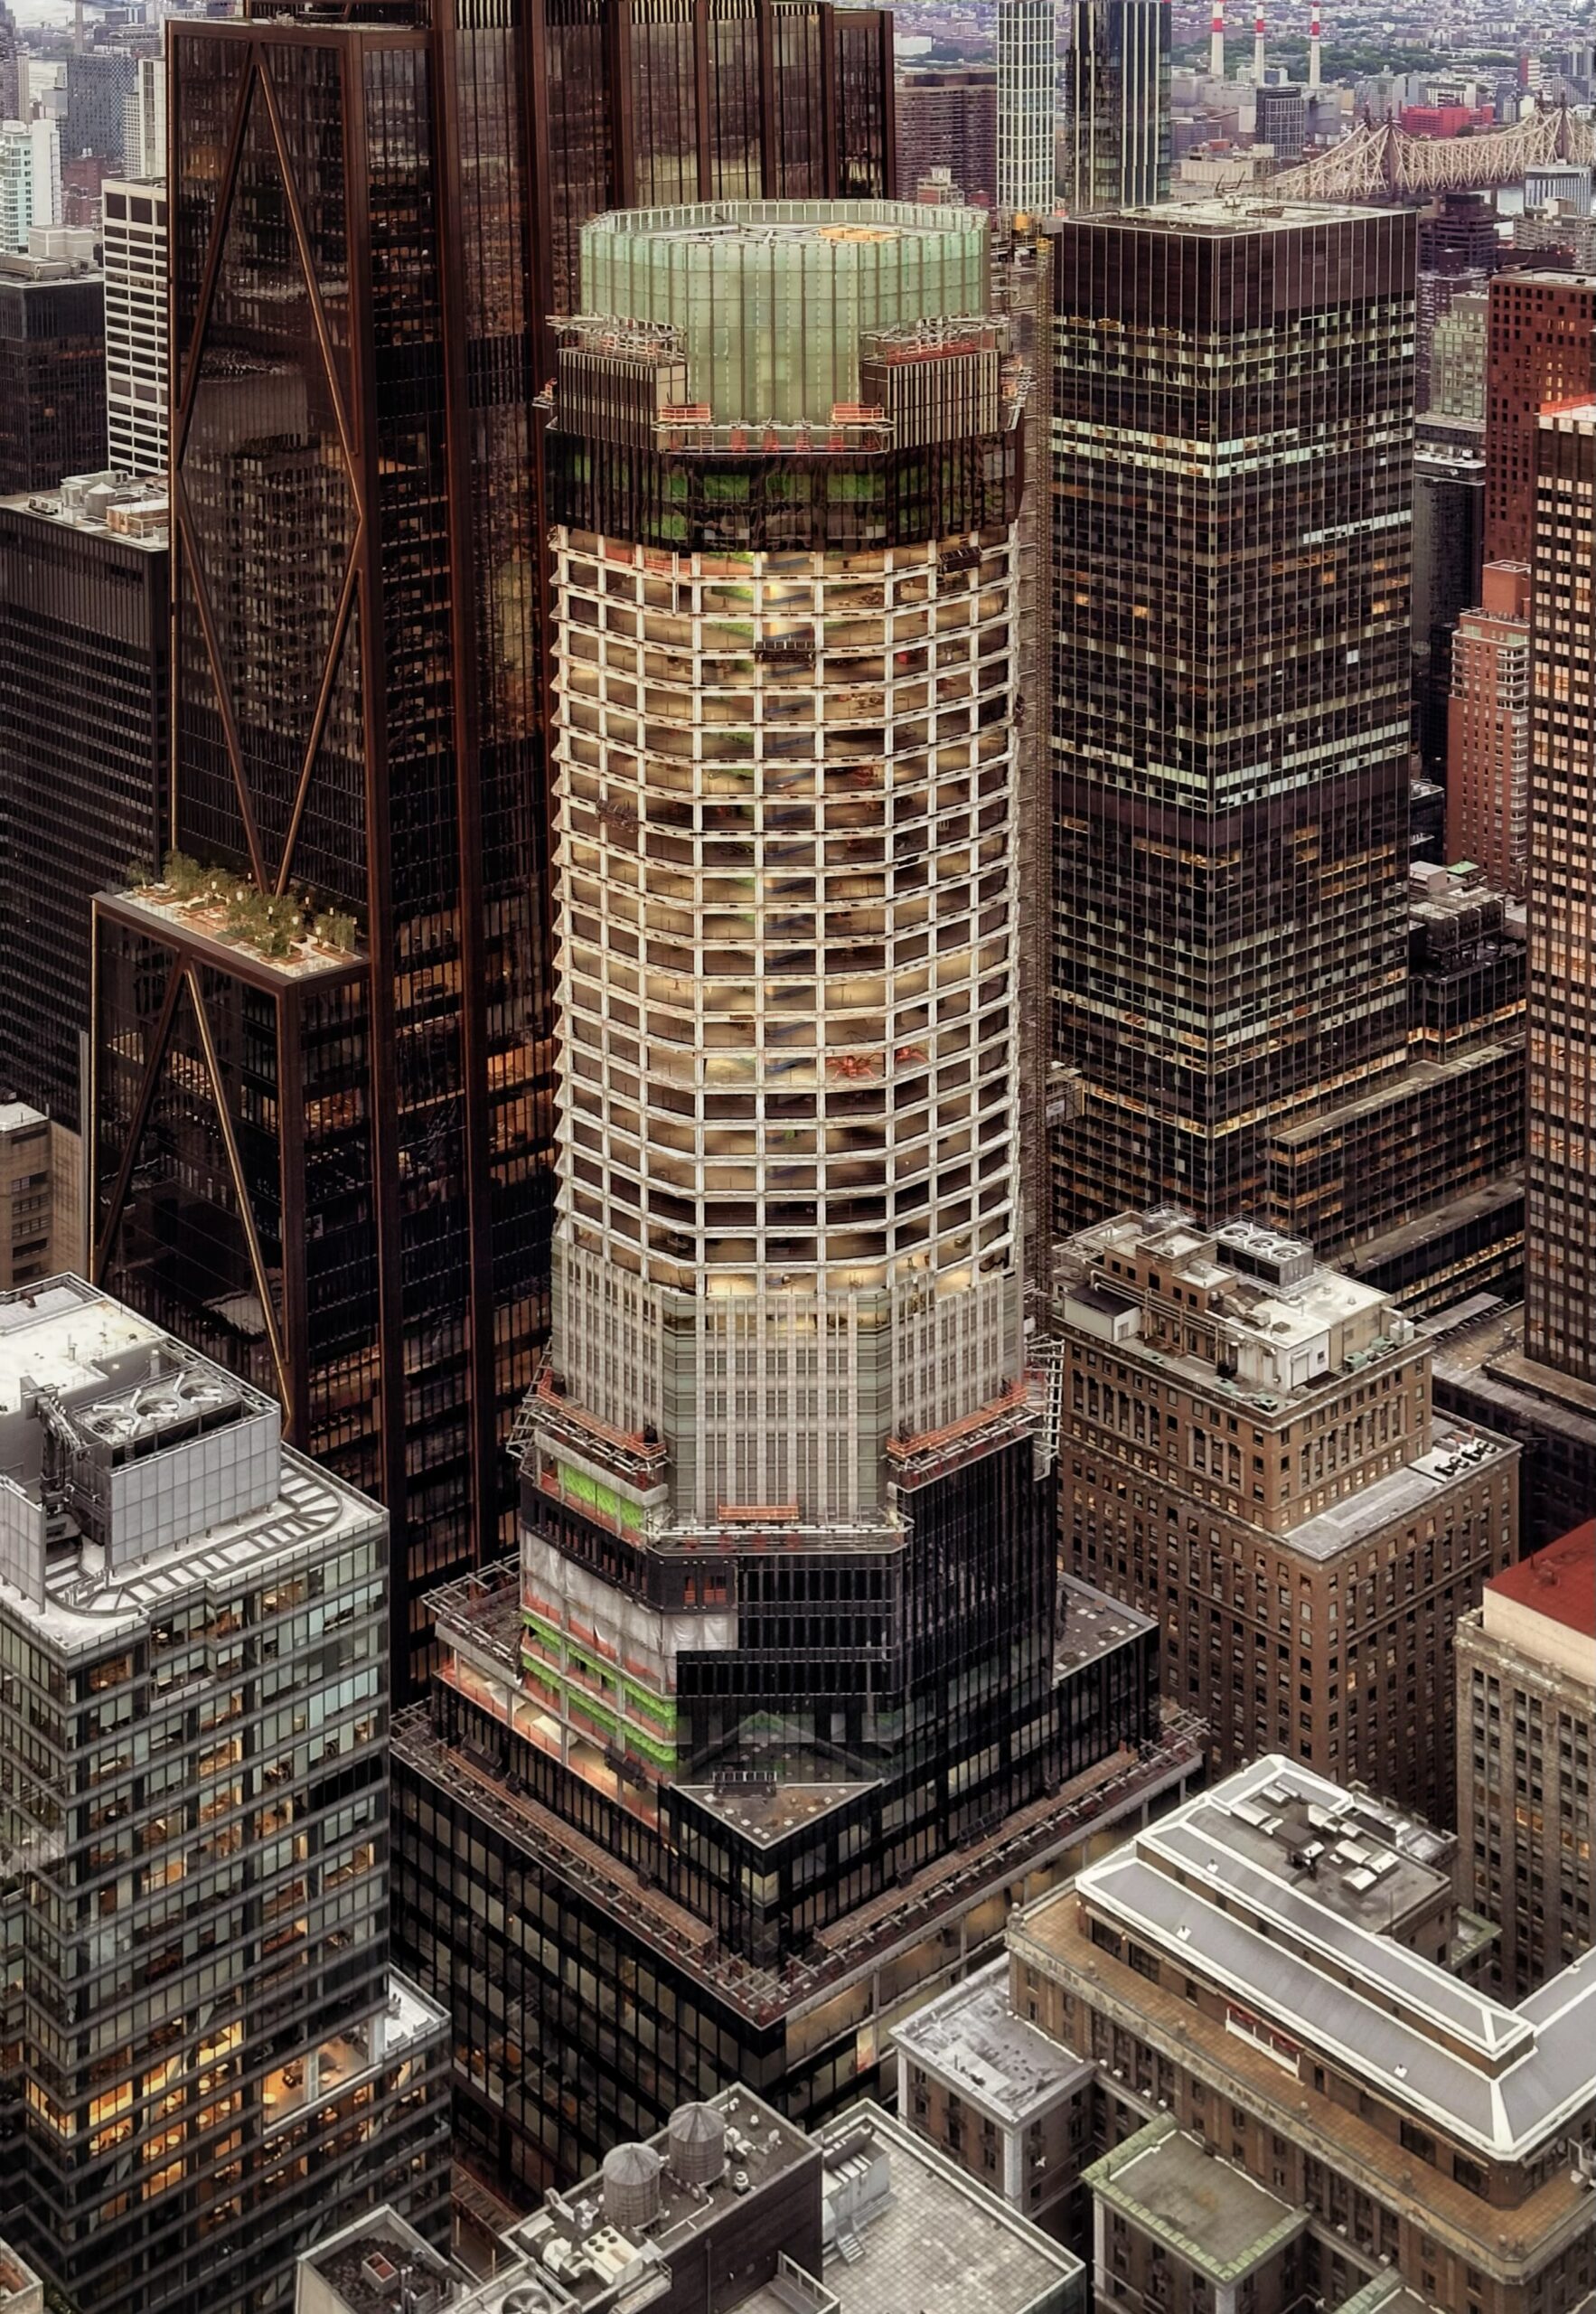
383 Madison Avenue. Photo by Michael Young.
When it comes to planning a metropolis such as the greater New York, there is always more work to be done than is currently in progress; to make the best use of already strained funds, it is always prudent to follow the path of least resistance, focusing efforts on improving existing infrastructure to maximum effect. Penn Station Access and the Interborough Express are two such projects, as they utilize existing train trackage and rights of way. Congestion pricing solves the problem of center-city car traffic by simultaneously giving a financial windfall for the MTA’s cash-strapped construction division.
Fortunately, the city is awash with similar improvement opportunities.
Transit authorities may both improve service for existing residents and allow for new housing development along transit lines via strategies such as elimination of regional rail grade crossings (as is being proposed along the Long Island Rail Road’s Ronkonkoma Branch) and electrifying diesel lines, allowing for faster and safer commutes; a unification of power-supply systems for local rail network would allow for eventual through-running. Following the Metro-North precedent in The Bronx, the MTA ought to introduce more infill stations along its existing regional rail line, at strategically considered points where they would maximize coverage in transit deserts while avoiding redundant stops that would slow down commuter services. For instance, such opportunities exist along the Atlantic and Montauk branches of the LIRR in southeast Jamaica as well as at Winfield Junction on Queens Boulevard in Woodside; an Interborough Express station also ought to be introduced at the latter location, which, together with an LIRR station, would use existing infrastructure to create a transit hub along a rapidly developing yet rail transit-inaccessible stretch of Queens Boulevard.
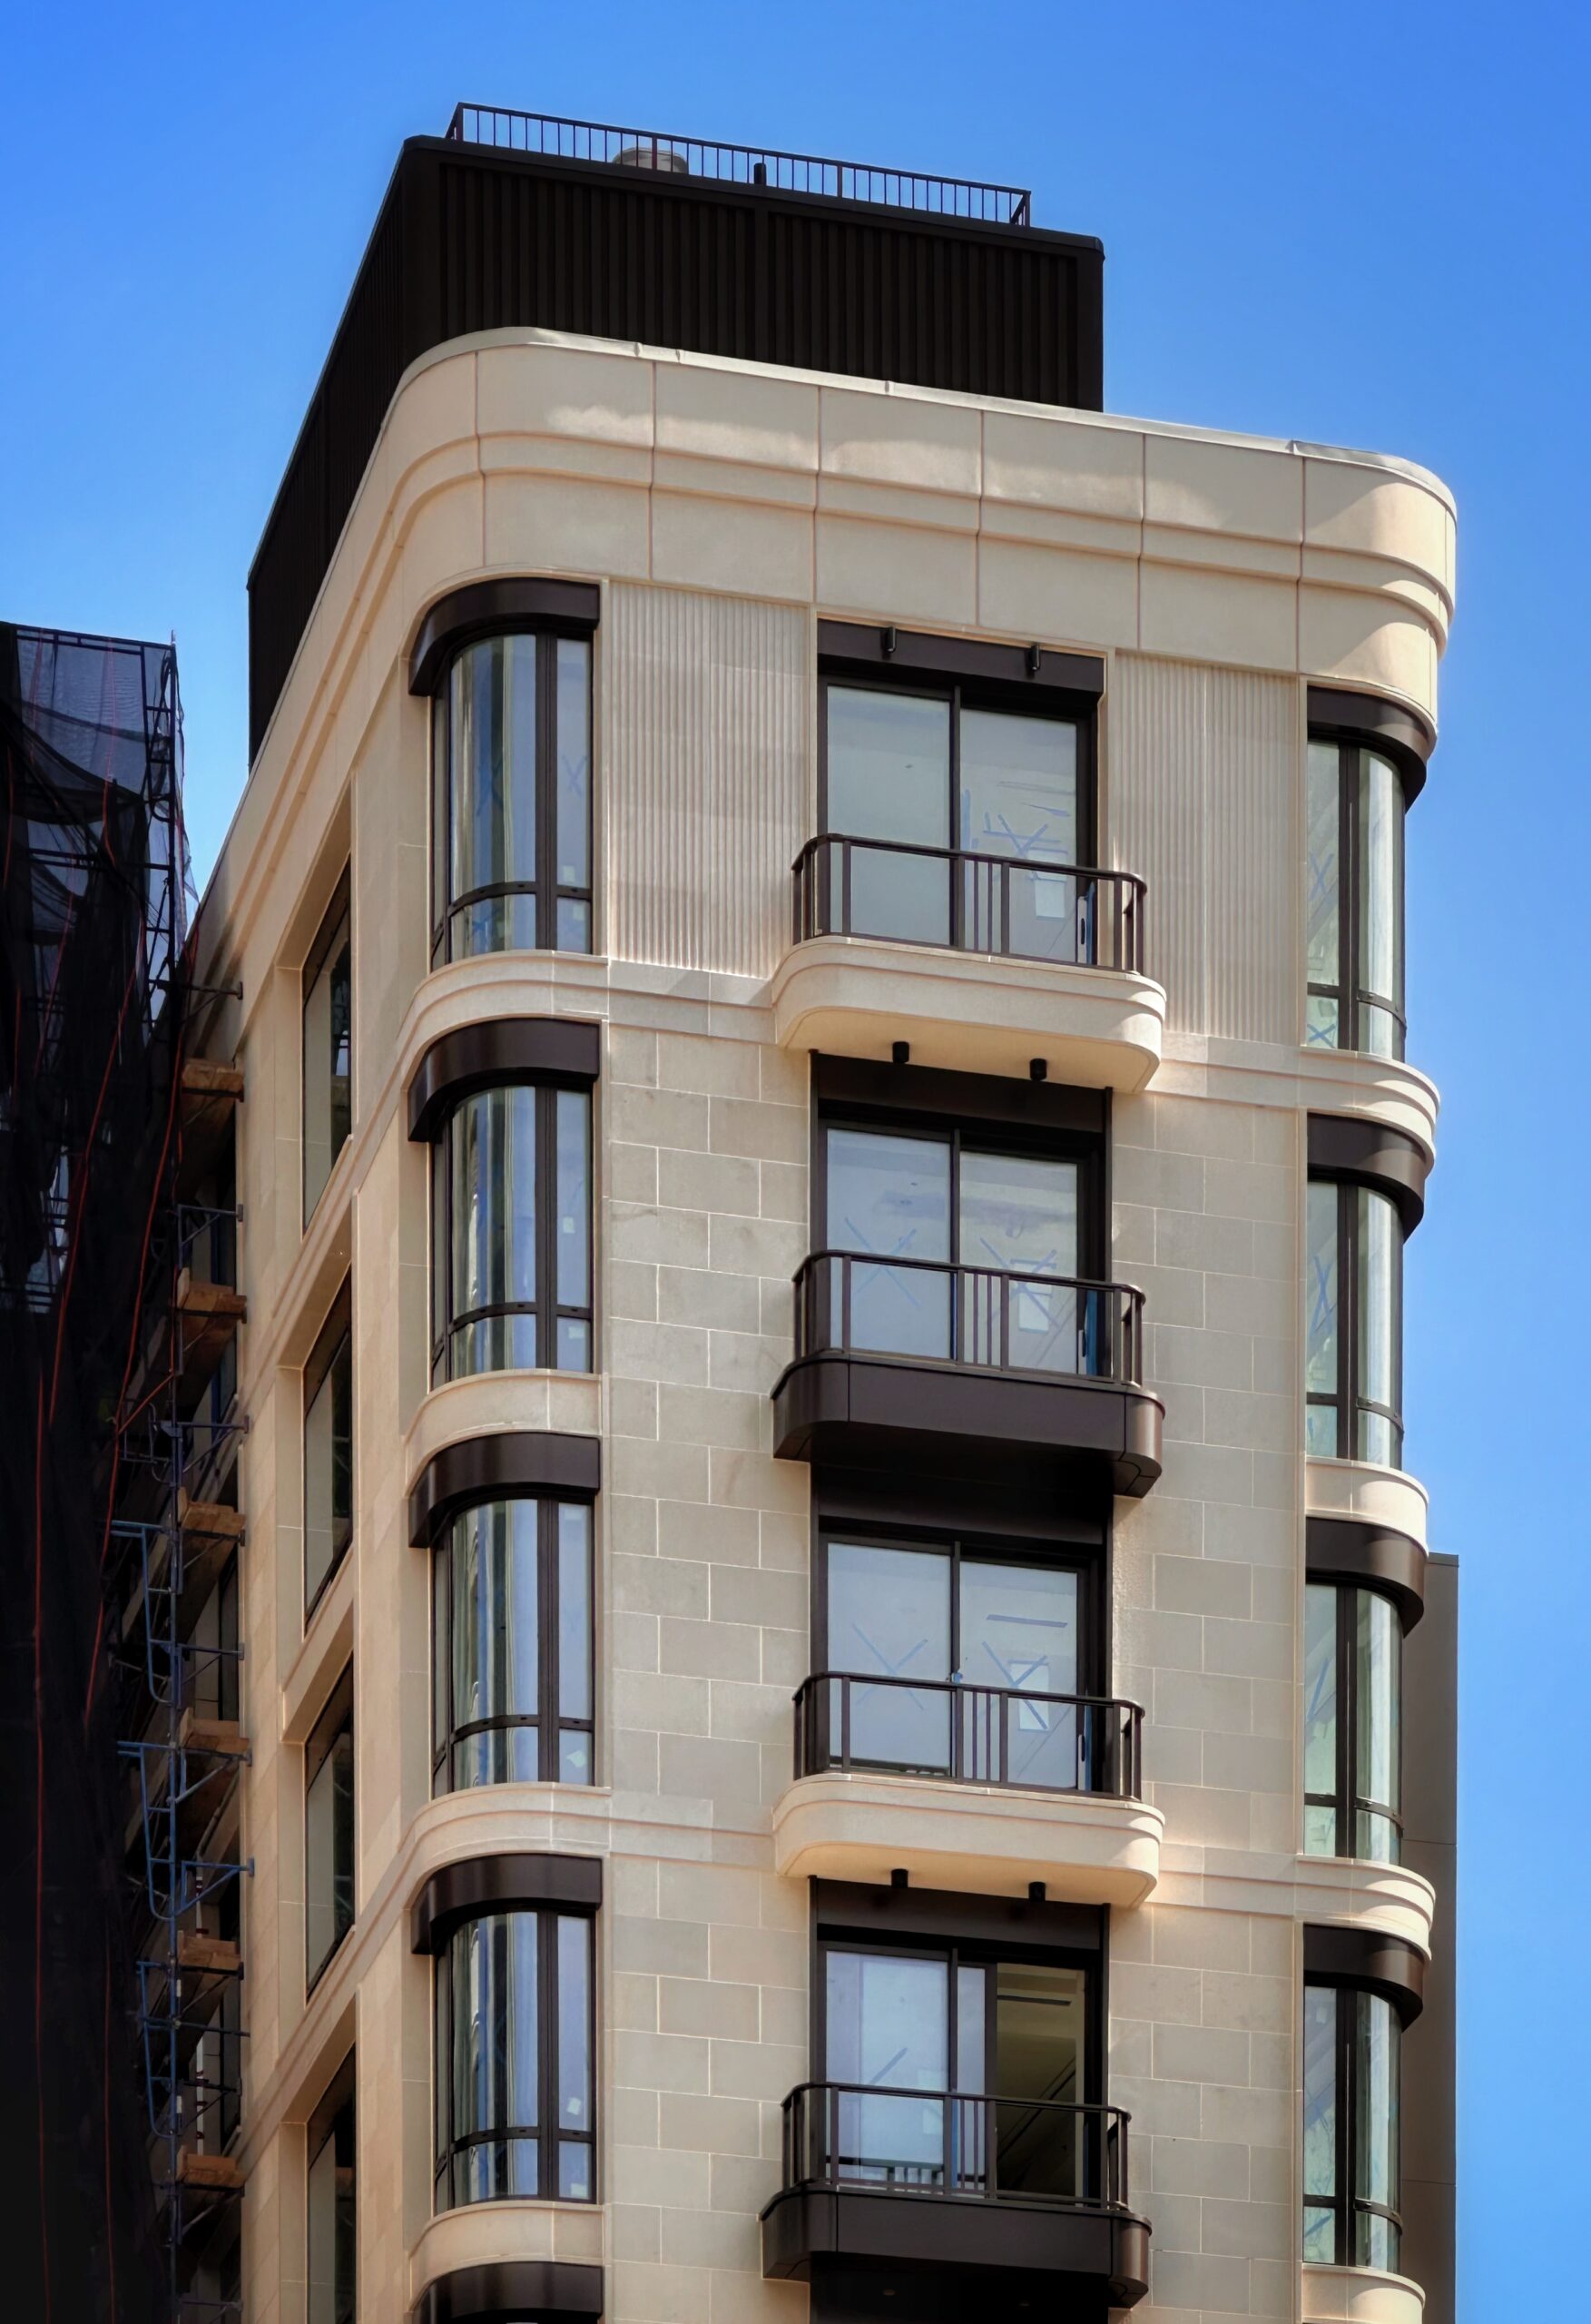
500 East 81st Street. Photo by Michael Young.
It also makes fiscal sense to extend existing subway lines, particularly in outlying, transit-underserved areas, rather than constructing brand new ones, in order to capitalize on existing amenities such as rail yards, lines connecting to central business districts, etc.
Such improvements may be partially funded by value capture programs that would generate tax income along improved transit corridors, similar to how the MTA’s Zoning for Accessibility program allows private developers to gain significant floor area density and height bonuses in exchange for funding and constructing station improvements such as elevators.
If introduced via legislation, similar programs may fund other projects that would capitalize on existing infrastructure and create housing, park space, and public amenities such as schools atop transit-accessible, railyard-capping projects a la Hudson Yards (albeit, most certainly, at lower building heights and densities) on sites throughout the city such as in Sunnyside (once the world’s largest passenger rail yard at 180 acres), Inwood, Jamaica, Coney Island, and elsewhere.
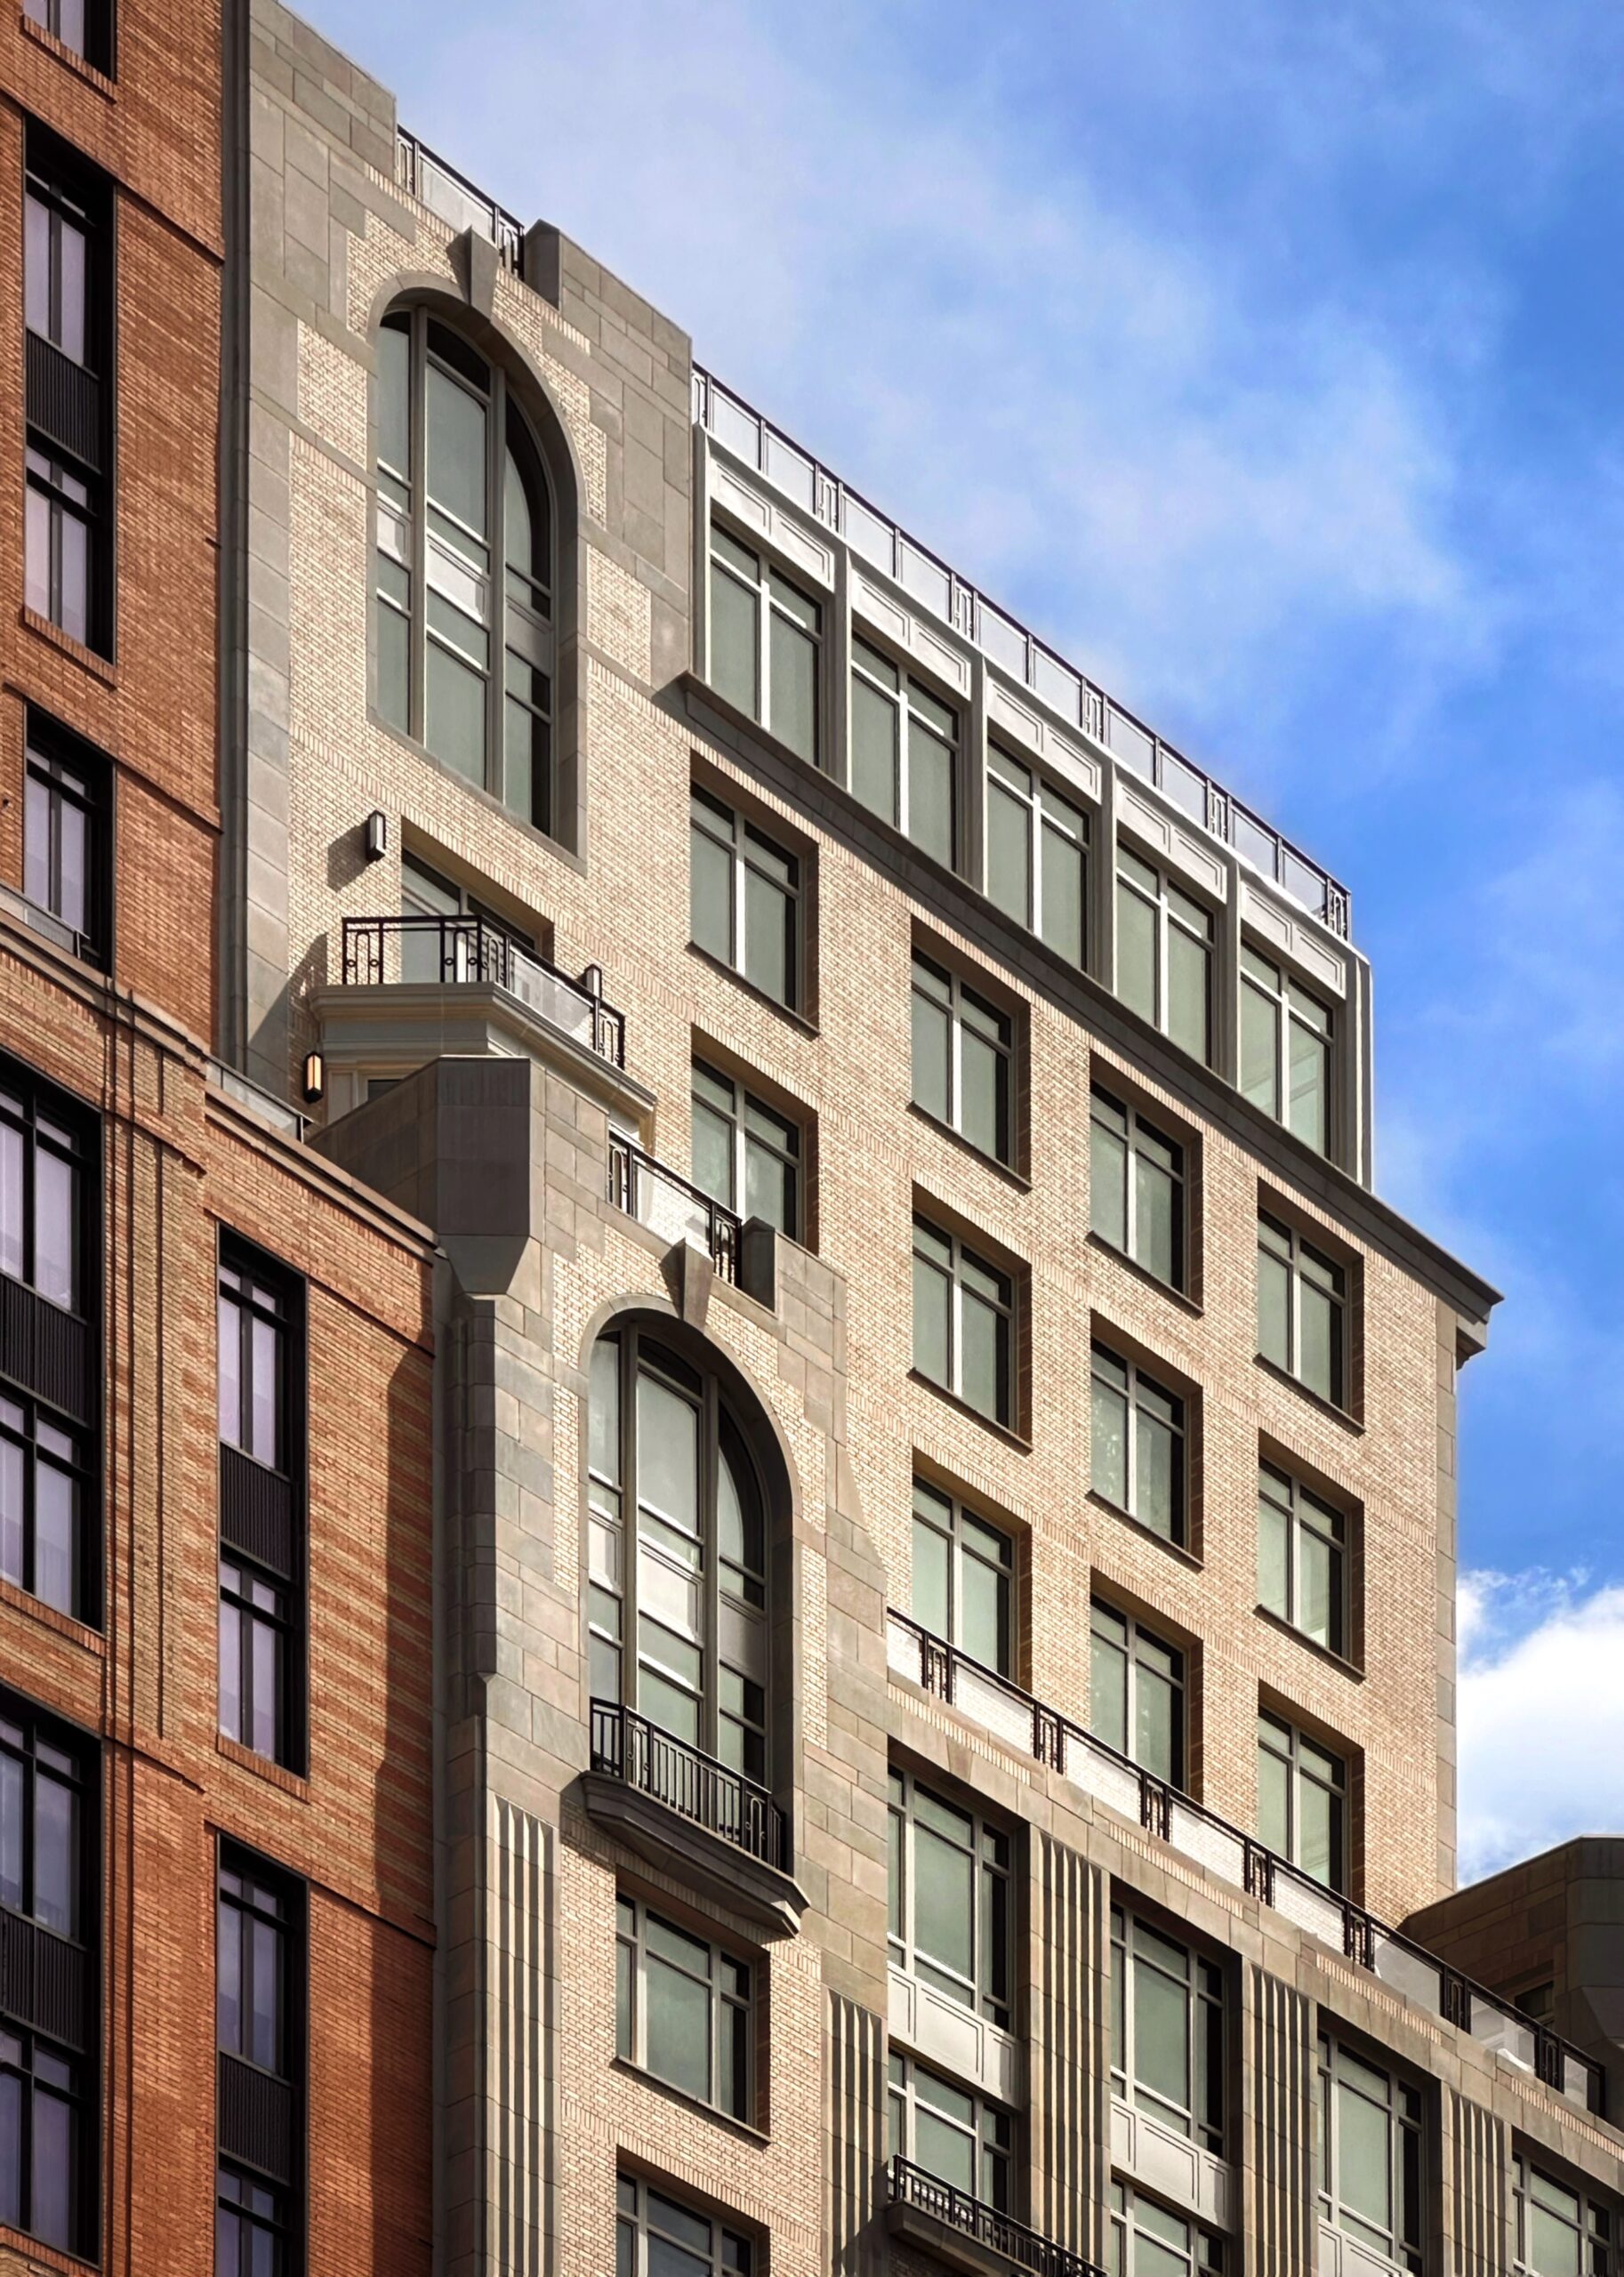
The Henry at 211 West 84th Street. Photo by Michael Young.
Park space may be effectively expanded in a piecemeal fashion that takes advantage of small, hyper-local opportunities. In a salient example of this approach, the city is currently considering purchasing of 47 private properties in park-starved western Queens for conversion to public open space. Something to keep in mind, however, is preservation of rights of way for future transit line expansions in order to avoid future planning complications and avoidable construction expenses.
Sometimes, urban planning solutions are purely political in nature. In Nassau County, the Village of Hempstead is currently working on enacting a city charter, which, under the state’s Aid and Incentives for Municipalities (AIM) regulations, would allow the municipality, if incorporated into a city, to receive significantly higher state aid compared to villages, even without a change in population or fiscal needs.
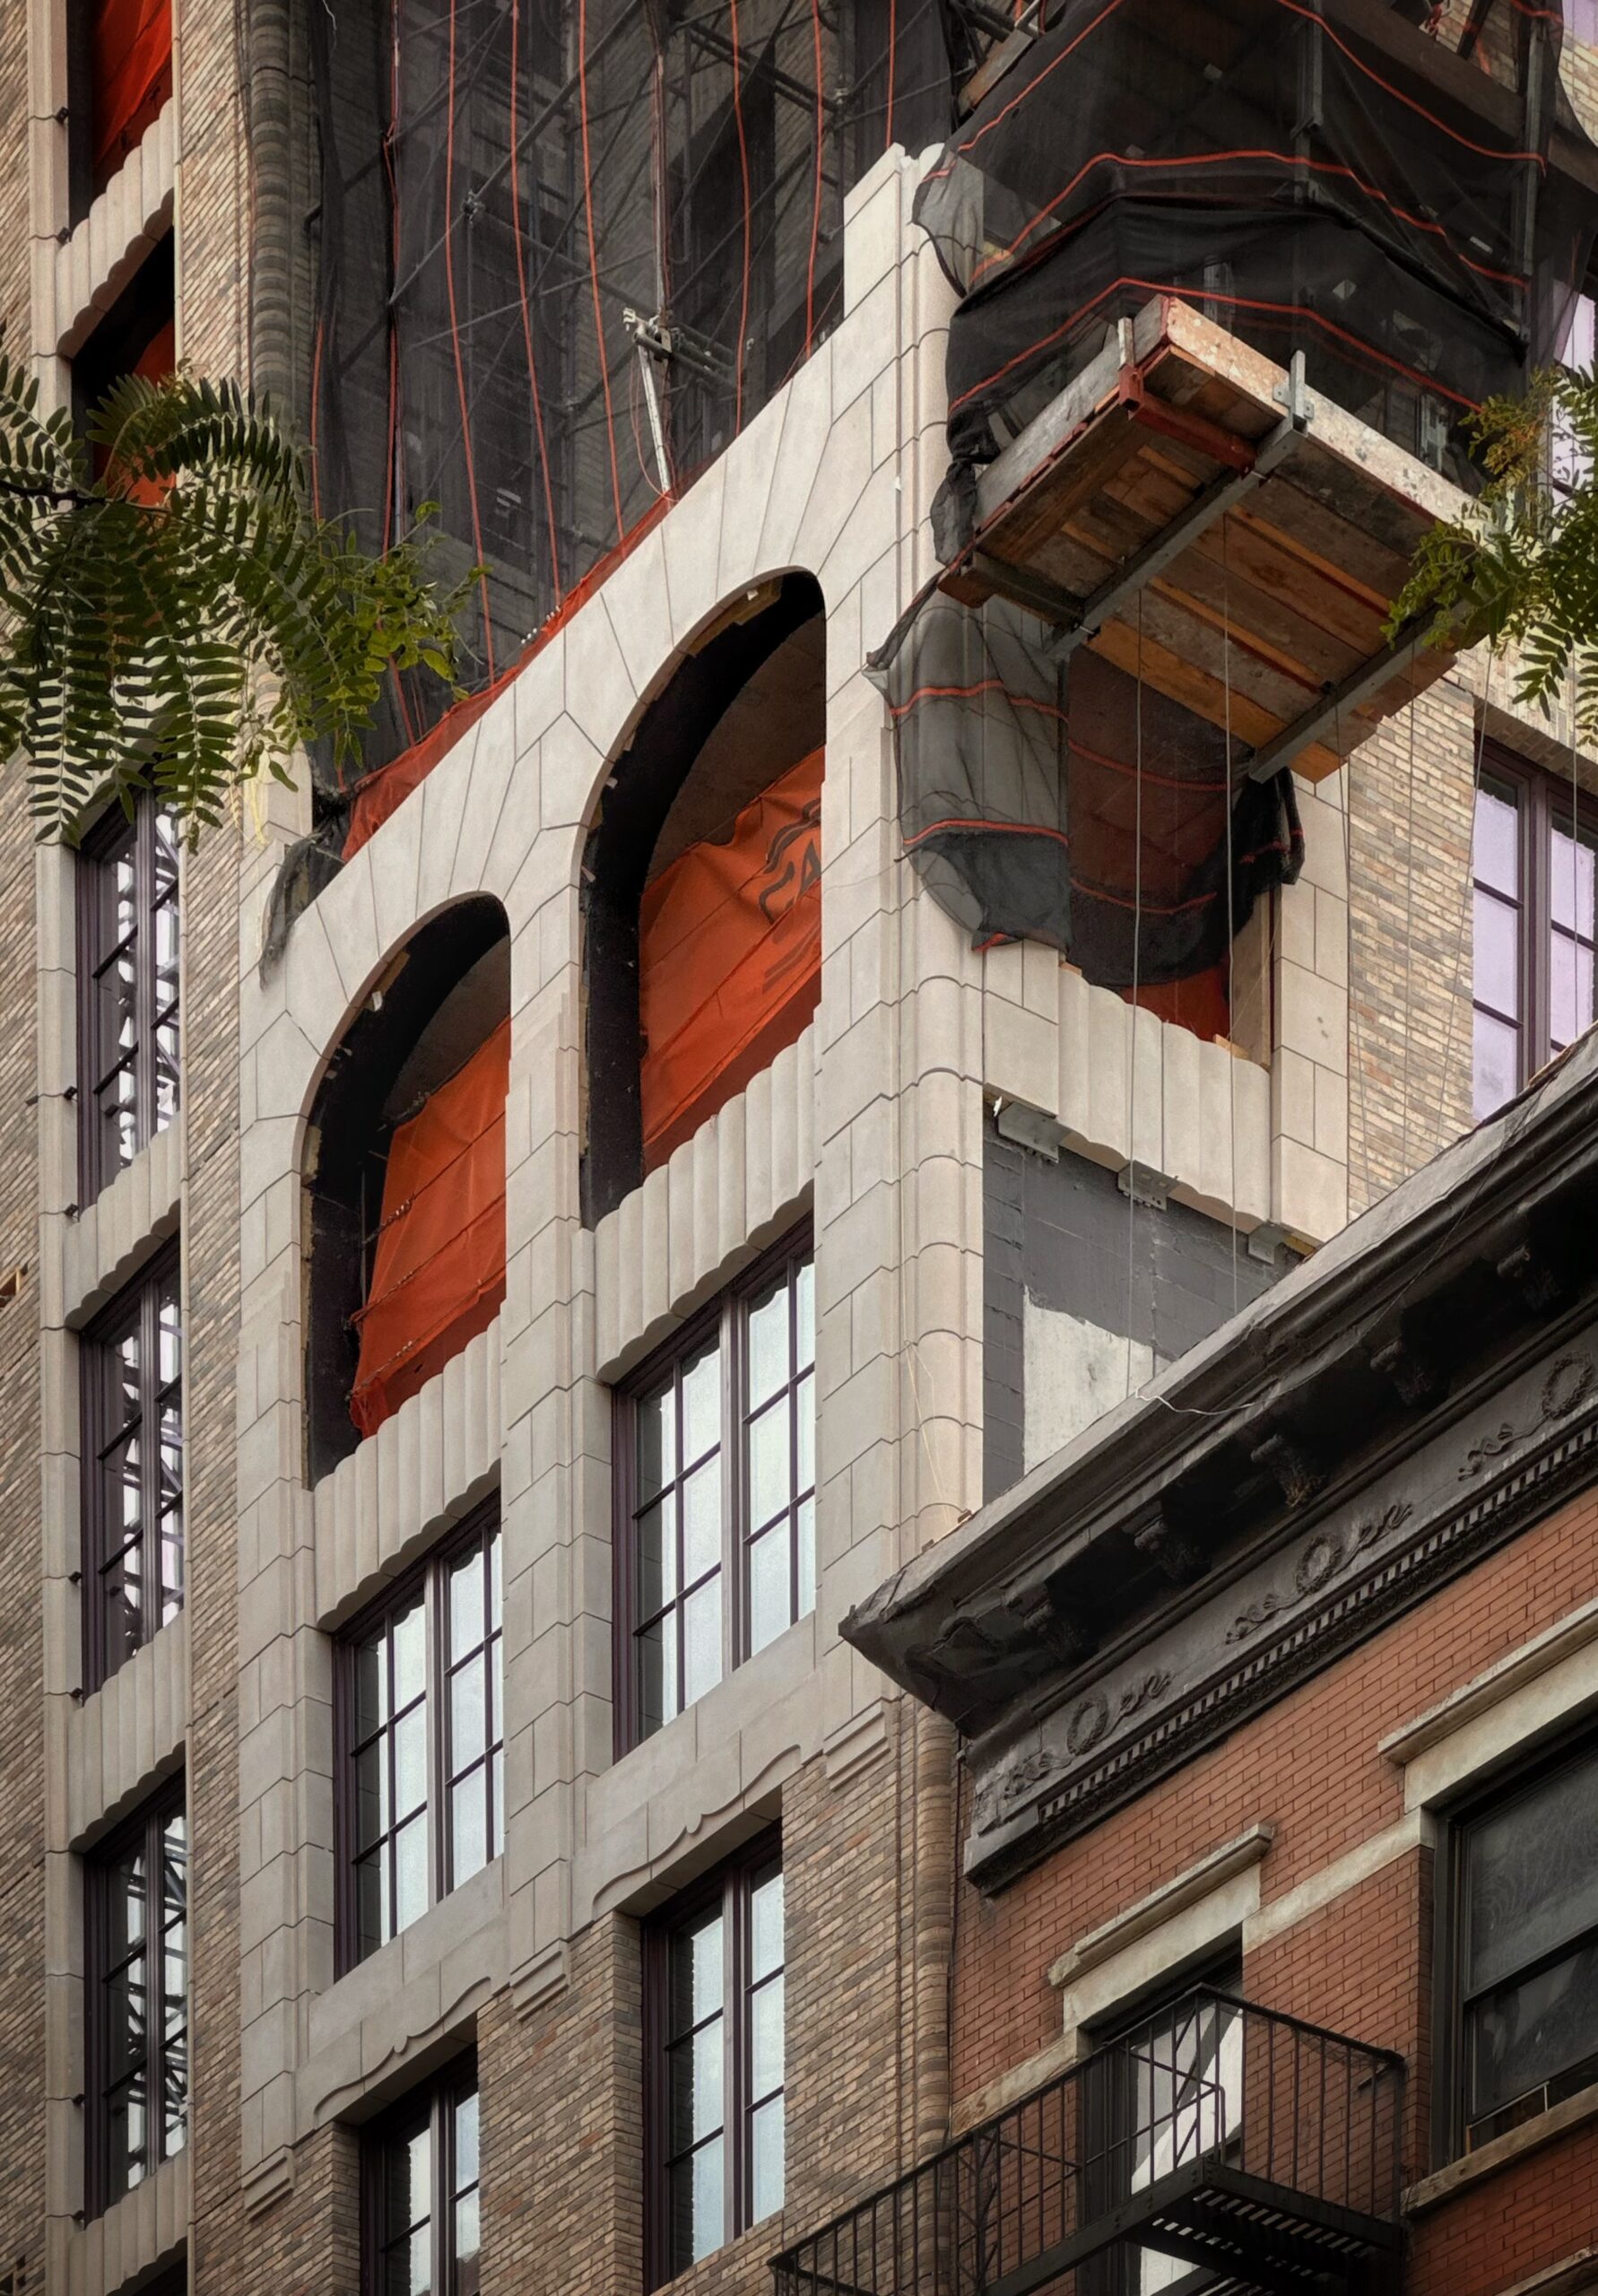
200 West 88th Street. Photo by Michael Young.
Similarly, a political solution would fix the conundrum where numerous developers opt to construct new residential buildings with exactly 99 residential units. A total of 24 such buildings were planned in the second quarter of 2026, as opposed to two proposals apiece with 98 and 97 units, one with 100 units, and none at all with anywhere between 101 and 115 units.
The move is made in order to circumvent wage mandates stemming from the state’s 485-x tax exemption program (which replaces the expired 421-a program), which offers property tax relief for residential buildings that include affordable housing, yet requires paying construction workers a minimum hourly wage of $40 for projects with 100 residential units or more.
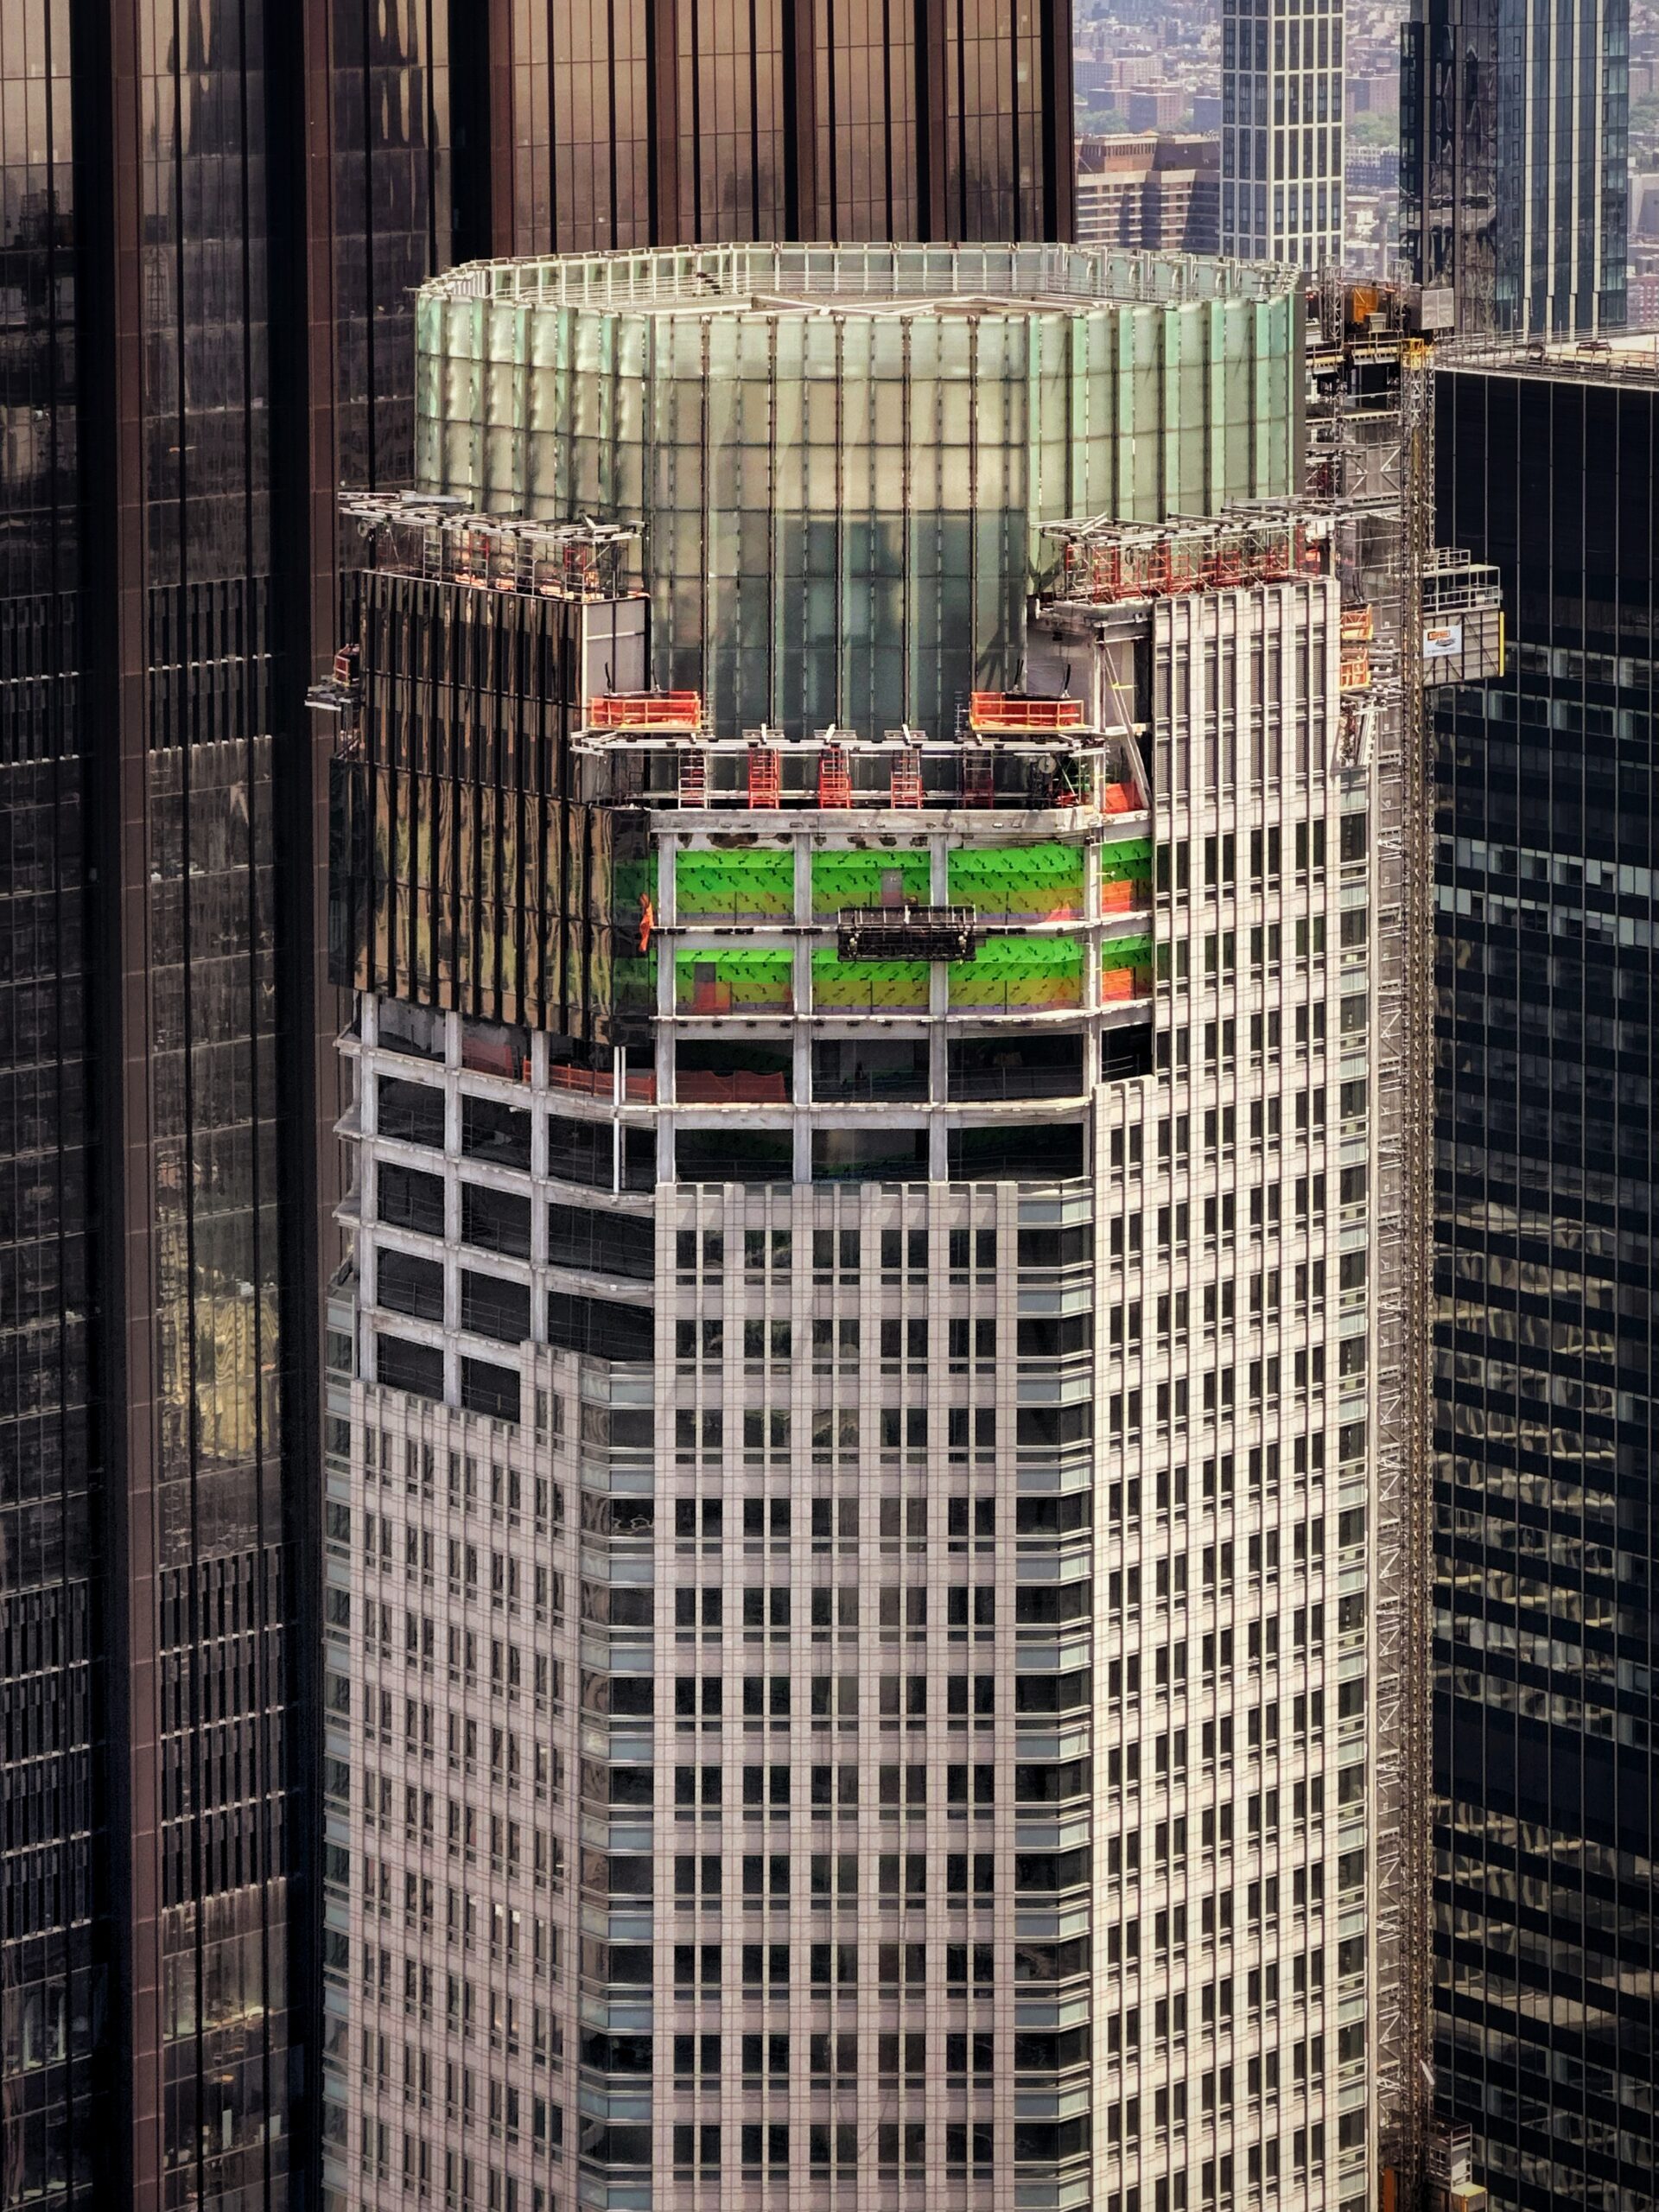
383 Madison Avenue. Photo by Michael Young.
Some developers go to extreme lengths to comply with the stipulations, crafting an all-but-in-name single-building project into several adjacent yet technically “separate” buildings with 99 units each (full info on such projects is available in the Q2 2026 spreadsheet via YIMBY’s Building Wire subscription).
Without addressing the benefits and drawbacks of the program itself, perhaps the current planning-intensive, resource-consuming situation may be addressed by restructuring it with a more nuanced formula with several unit count and concurrent pay tier levels, a formula that directly correlates unit counts with worker compensation, or some other system more nuanced than the current binary, over-or-under 100-unit system.
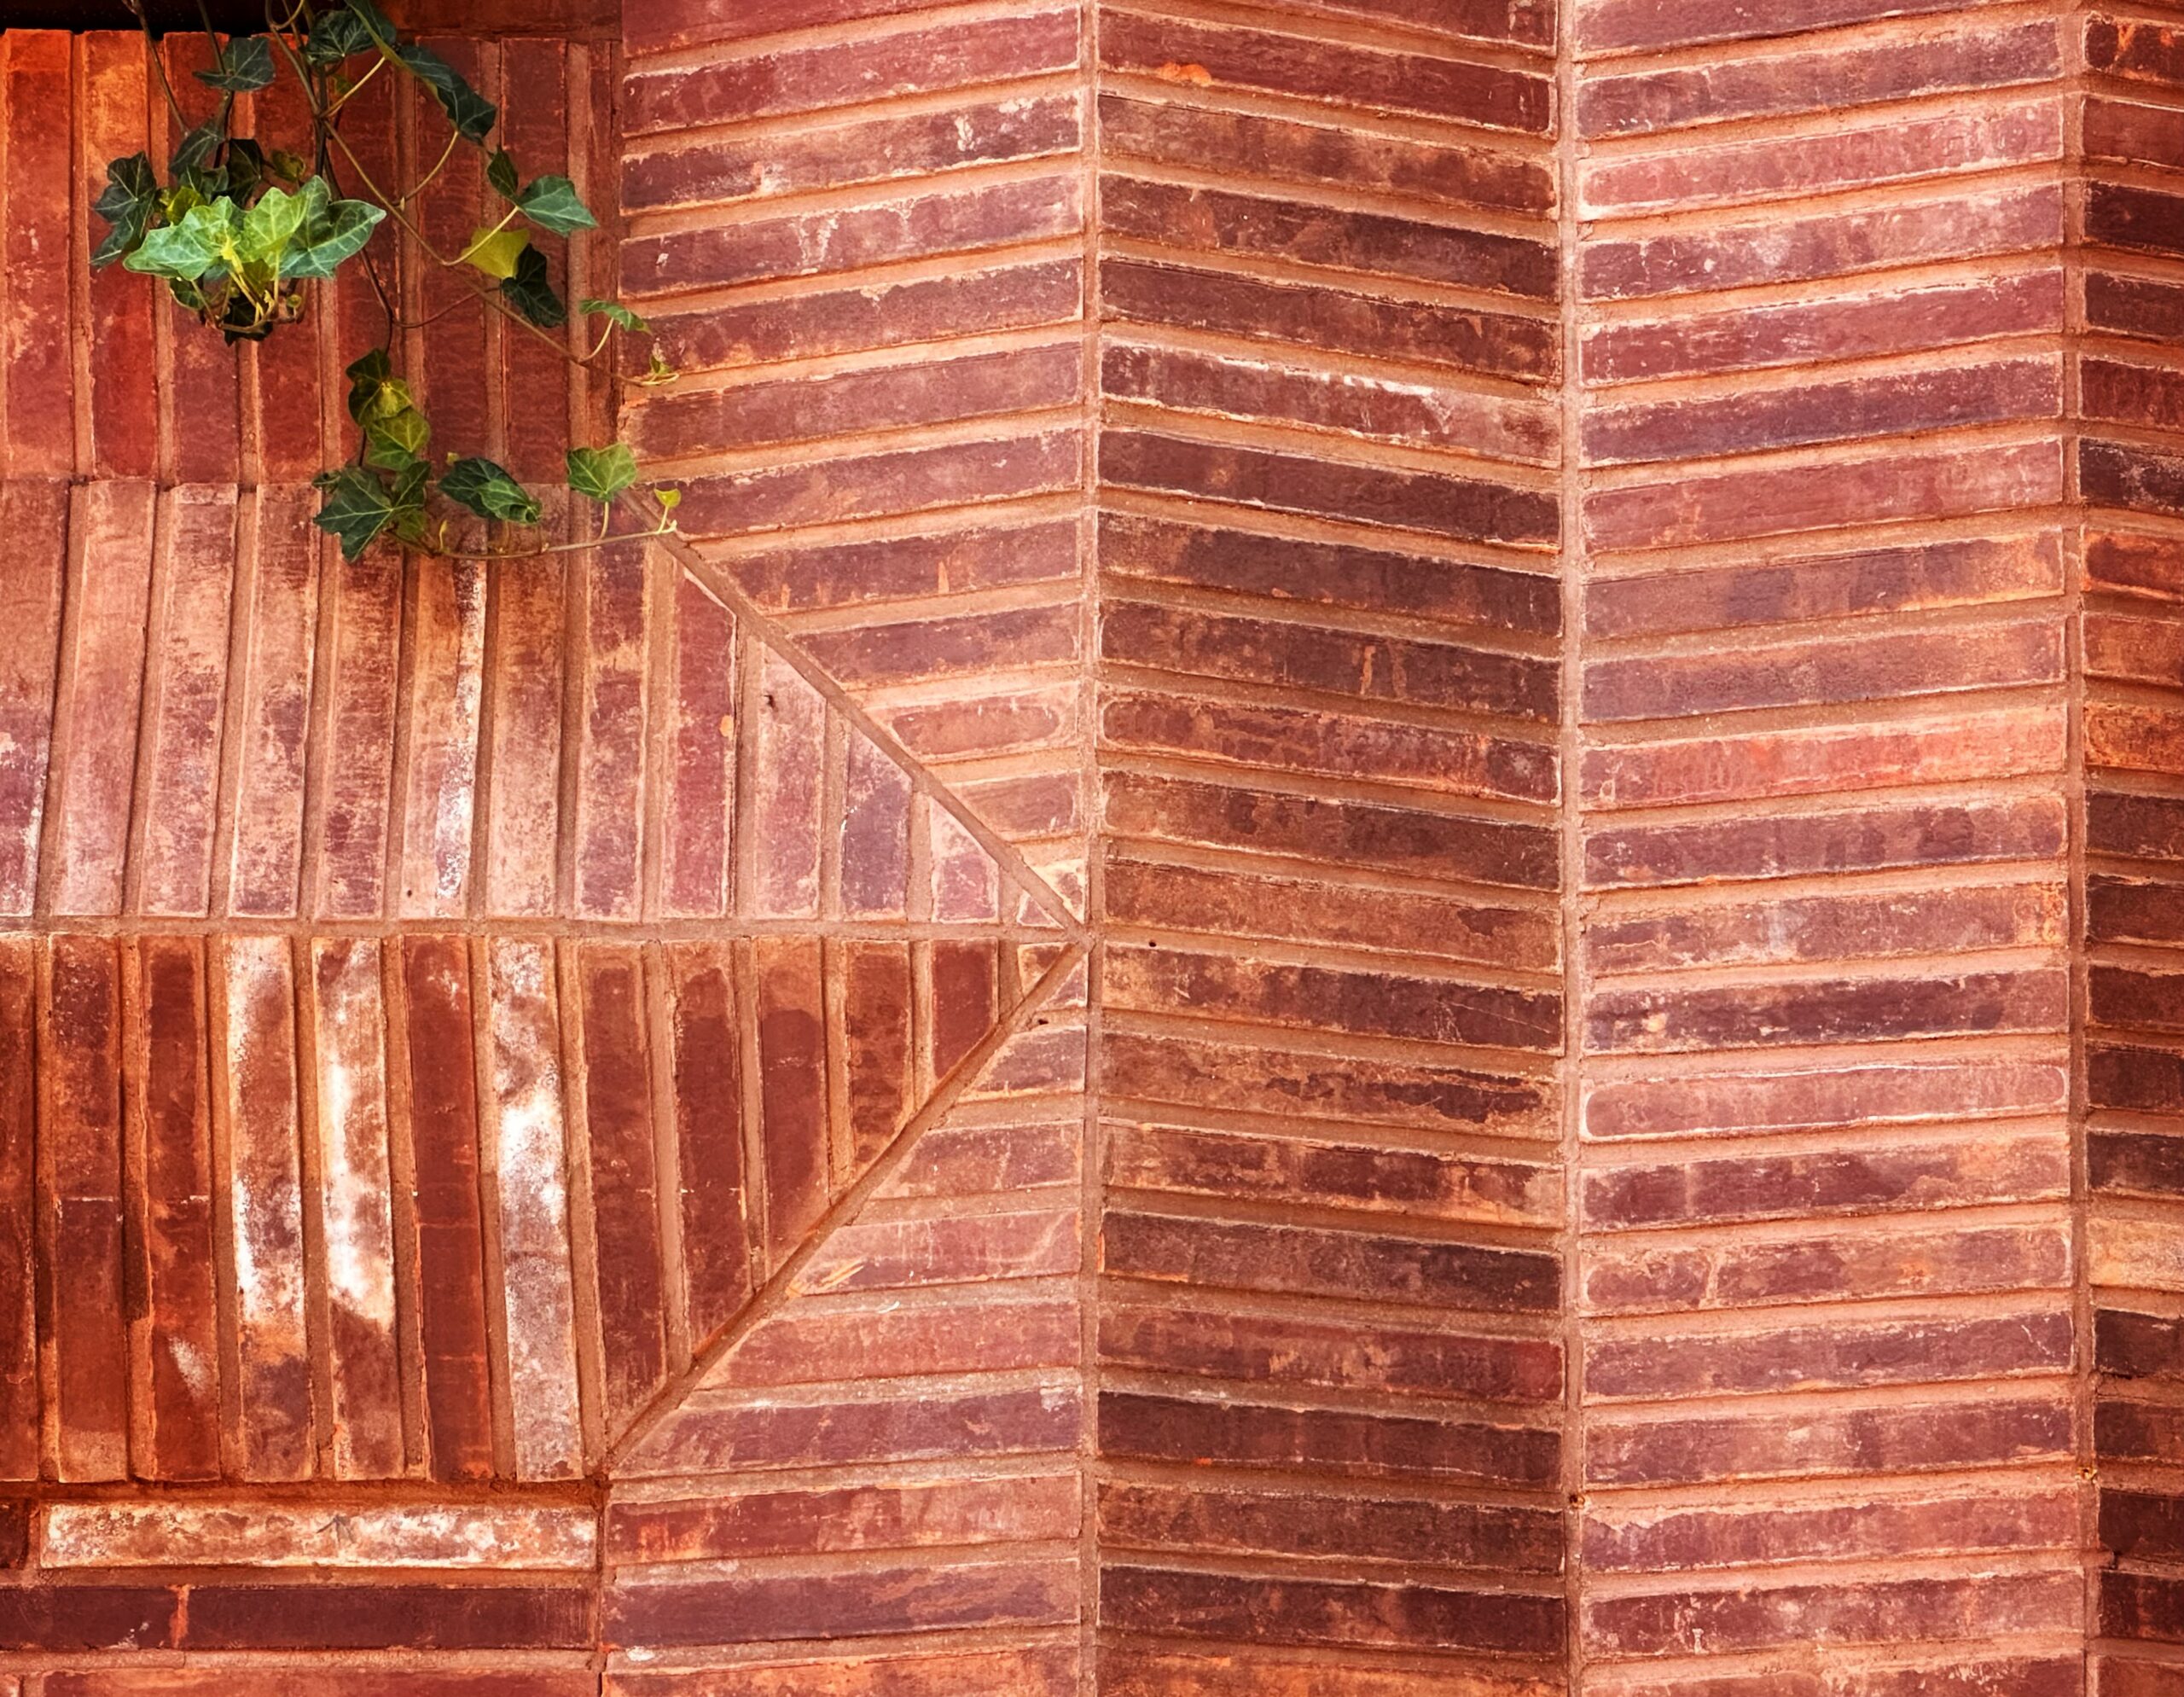
256 East 4th Street. Photo by Michael Young.
Frequently, urban-scale planning problems require a complex mix of both political and practical engineering solutions. One such case may present itself for QueensLink, a proposal to repurpose a long-abandoned, 3.5-mile-long section of the Long Island Rail Road Rockaway Beach Branch into a subway line connecting the Queens Boulevard line to the section of the A train that runs to the Rockaways (which, incidentally, was also converted from an abandoned LIRR branch to subway service in 1956).
In addition to creating a key north-south subway link for Queens, drastically improving commute options for Rockaway residents, the grassroots-sourced, multi-modal proposal would also create a public greenway running alongside the subway.
Despite a groundswell of popular support, the project hit a major hurdle when Mayor Zohran Mamdami appeared to unexpectedly reverse his earlier pro-QueensLink campaign stance in favor of QueensWay, a truncated version of the plan that consists of a greenway only and excludes the subway altogether.
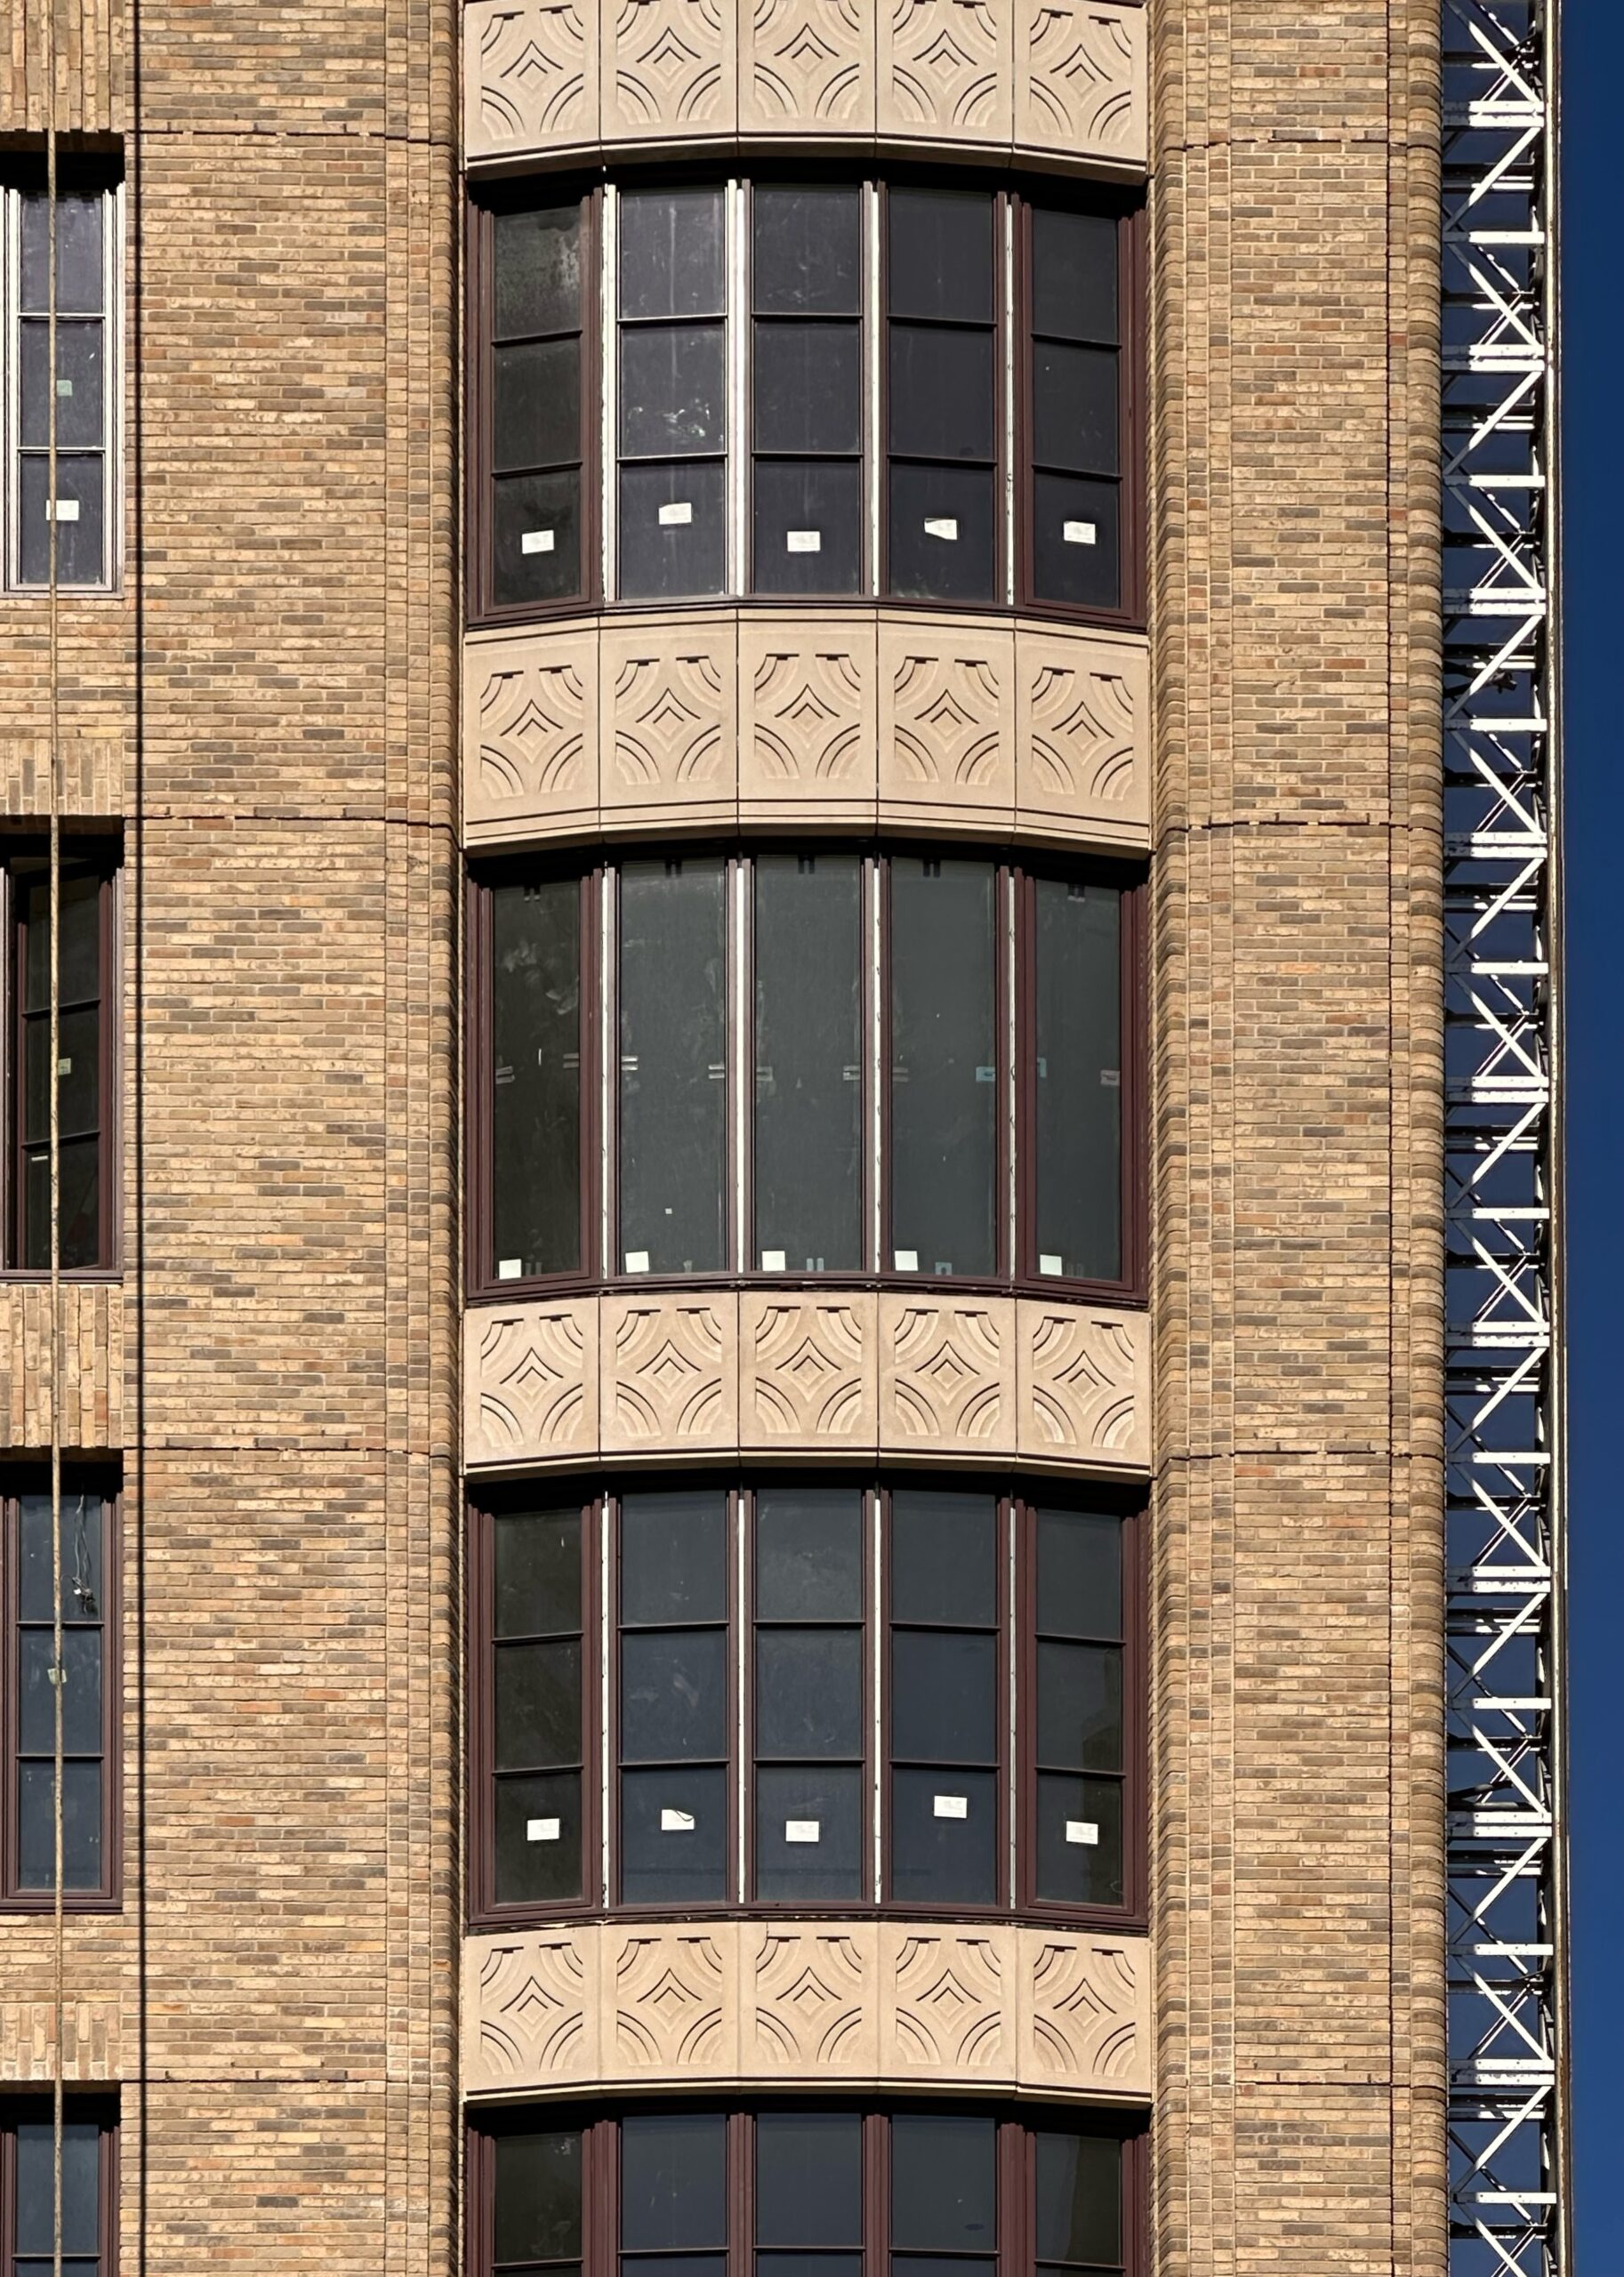
200 West 88th Street. Photo by Michael Young.
Since this reversal, QueensLink supporters have largely turned their advocacy to the state, which ultimately controls the city’s subway system. While some described the position shift by the Mayor as a tactic designed to secure quicker political payoff from a simpler, watered-down proposal that may be completed in his tenure, others pointed out physical challenges of QueensLink, such as its lack of stations in the newly built section, as well as technical and political difficulties of reactivating an elevated train trestle section south of Yellowstone Boulevard, which runs adjacent to residential backyards.
A solution to the latter issue, however, may be offered by shifting the section south of Yellowstone Boulevard from the abandoned elevated trestle to under the nearby Woodhaven Boulevard to the west, which would be built using the less expensive cut-and-cover method. This would transform the derelict, backyard-adjacent right-of-way elevated berm into a linear park, while running the section south of Yellowstone along a wide, busy commercial corridor where stations may sit closer to a greater number of riders (the section to the north of Yellowstone would remain as presented in the QueensLink plan).
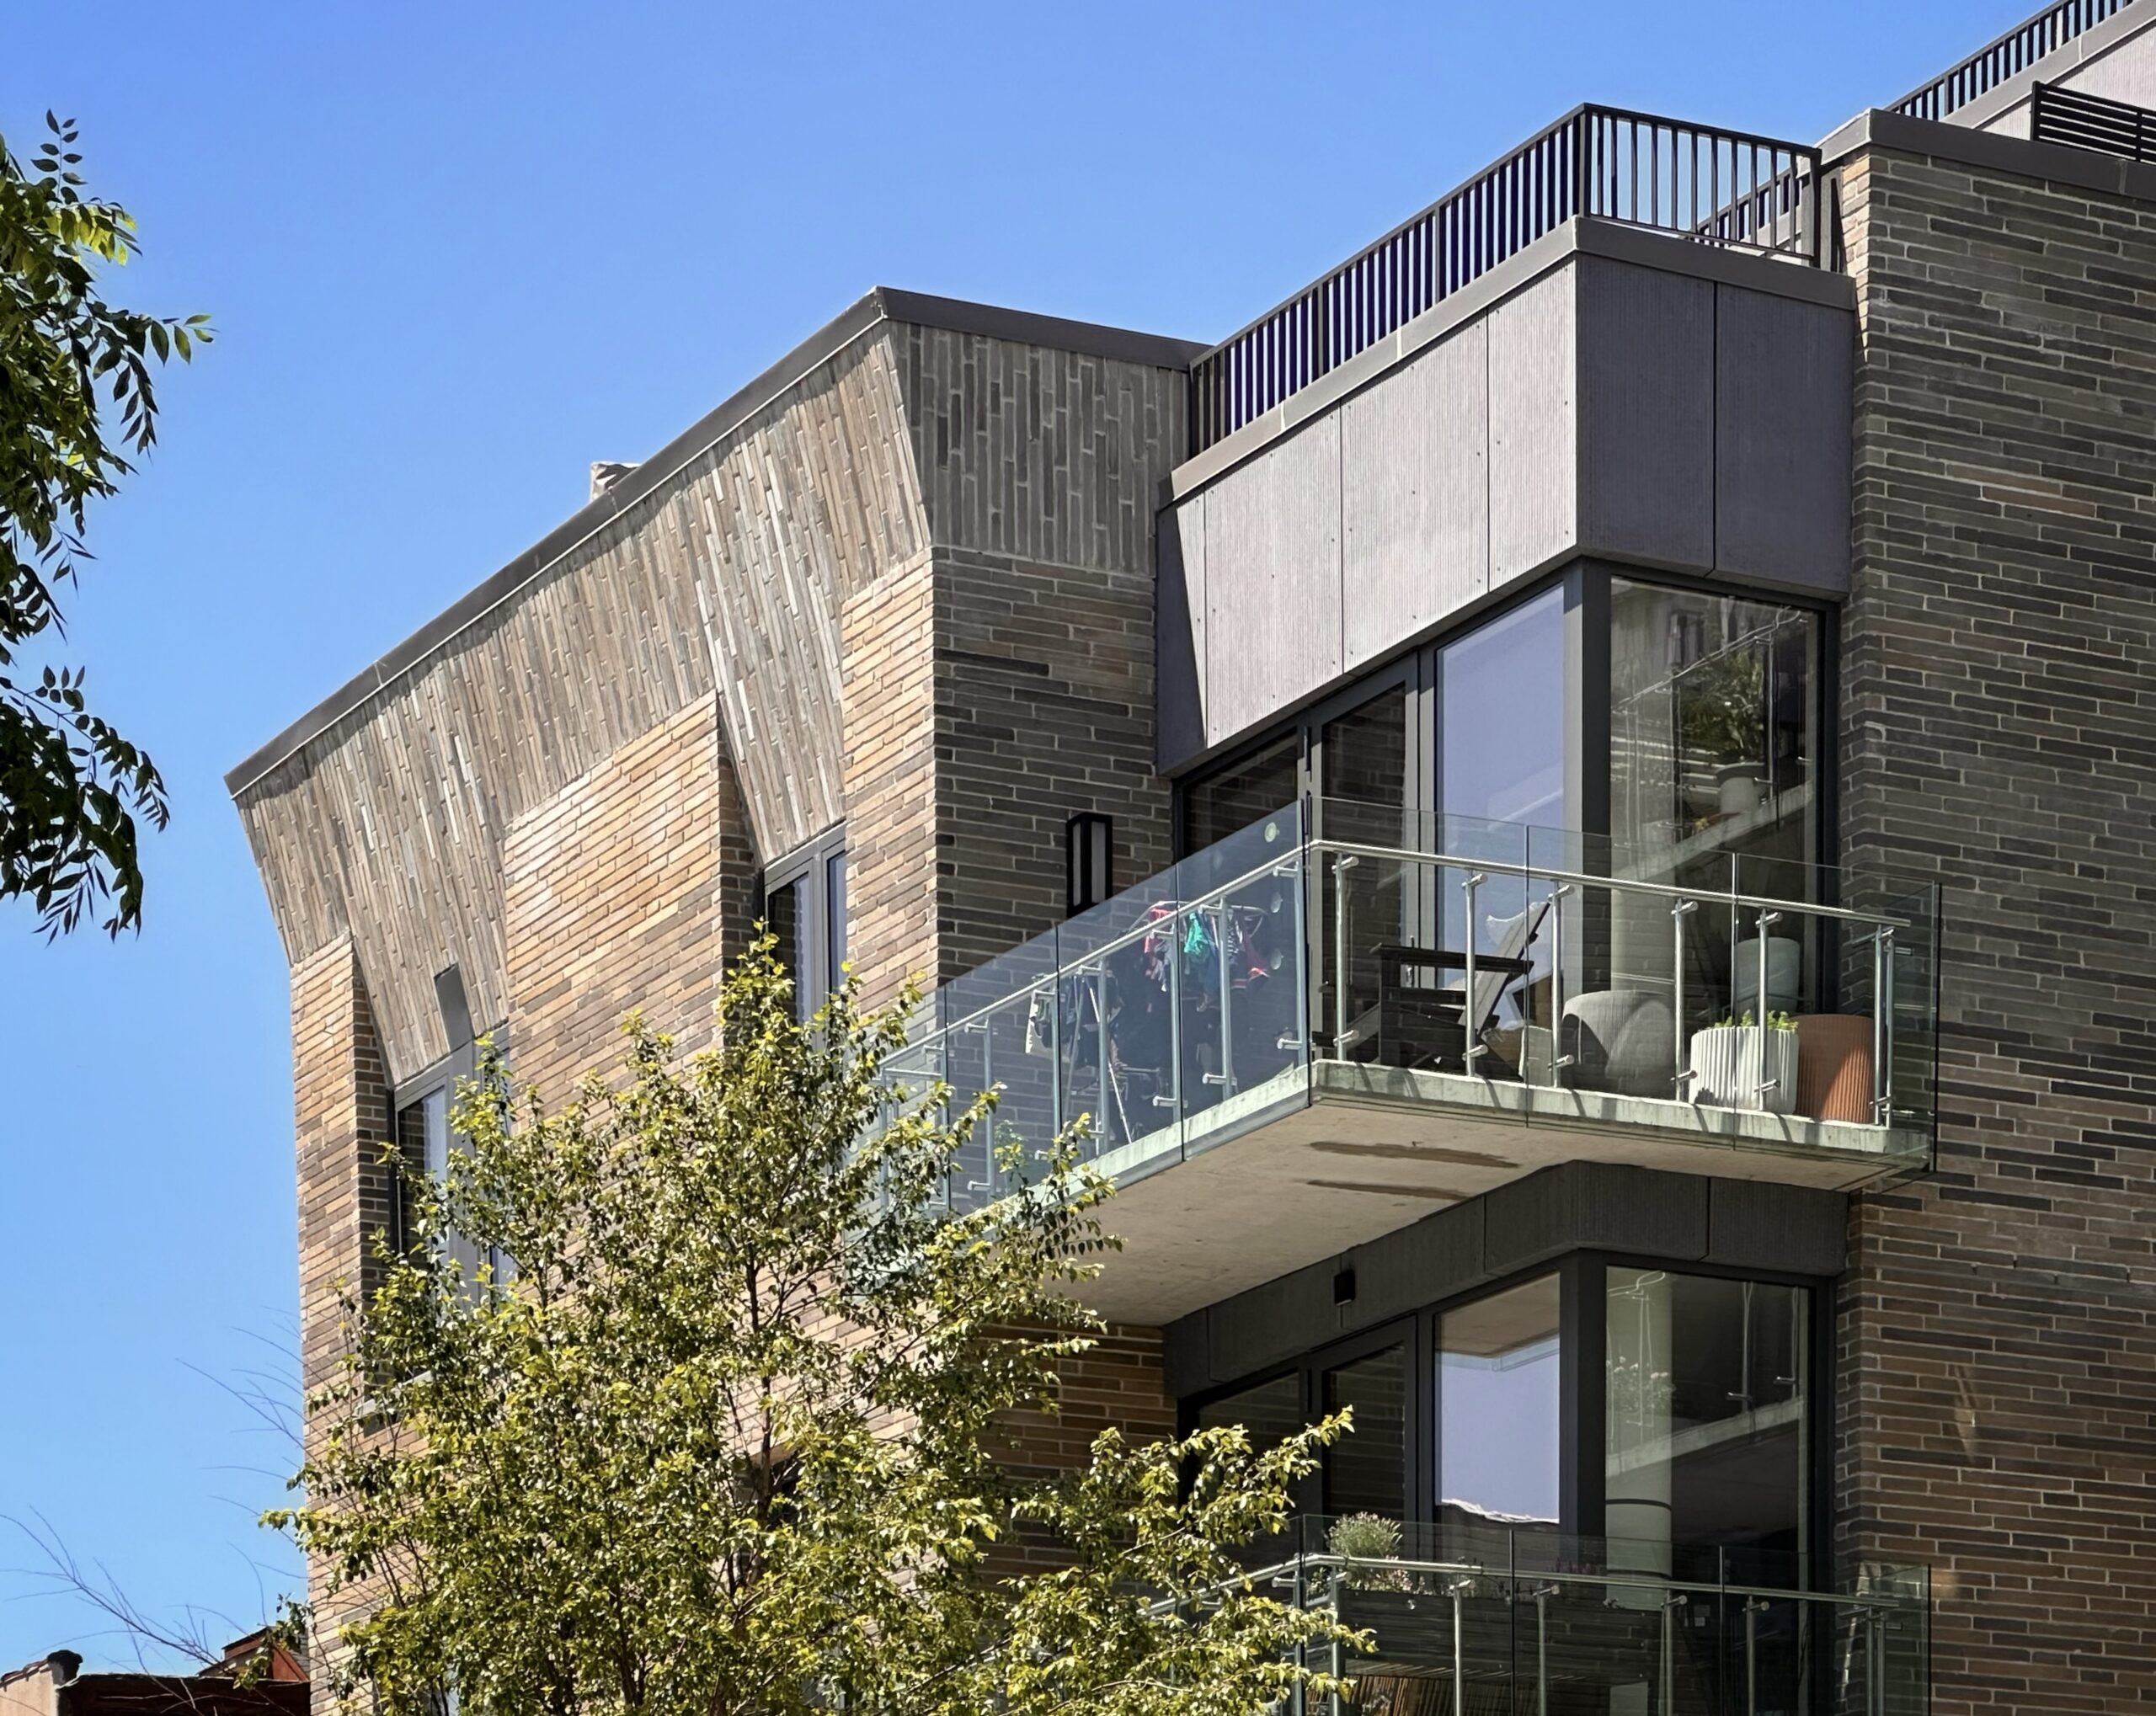
630 Grand Avenue. Photo by Michael Young.
If the proposed right of way relocated to Woodhaven Boulevard were to be quadruple-tracked (a near-impossibility for the narrow abandoned elevated berm), it may also do double duty as a direct subway shuttle between the Woodside-61st Street Station on the 7 train and the LIRR and the Howard Beach-JFK Airport station on the A train, which connects to the JFK-bound AirTrain.
For much of its 7-mile-plus run, the JFK airport shuttle would utilize existing abandoned train trackage, both along the subway trestle to the south of the A train (south of the QueensLink proper section) and along the unused LIRR tracks west of Rego Park (which, incidentally, were slated for use for the Queens Super-Express proposal for direct subway service to the airport).
This re-route is just another example of a multi-modal solution maximizing existing infrastructure and resources while introducing relatively minor modifications to current plans to satisfy both the engineering requirements and political concerns of a complex project.
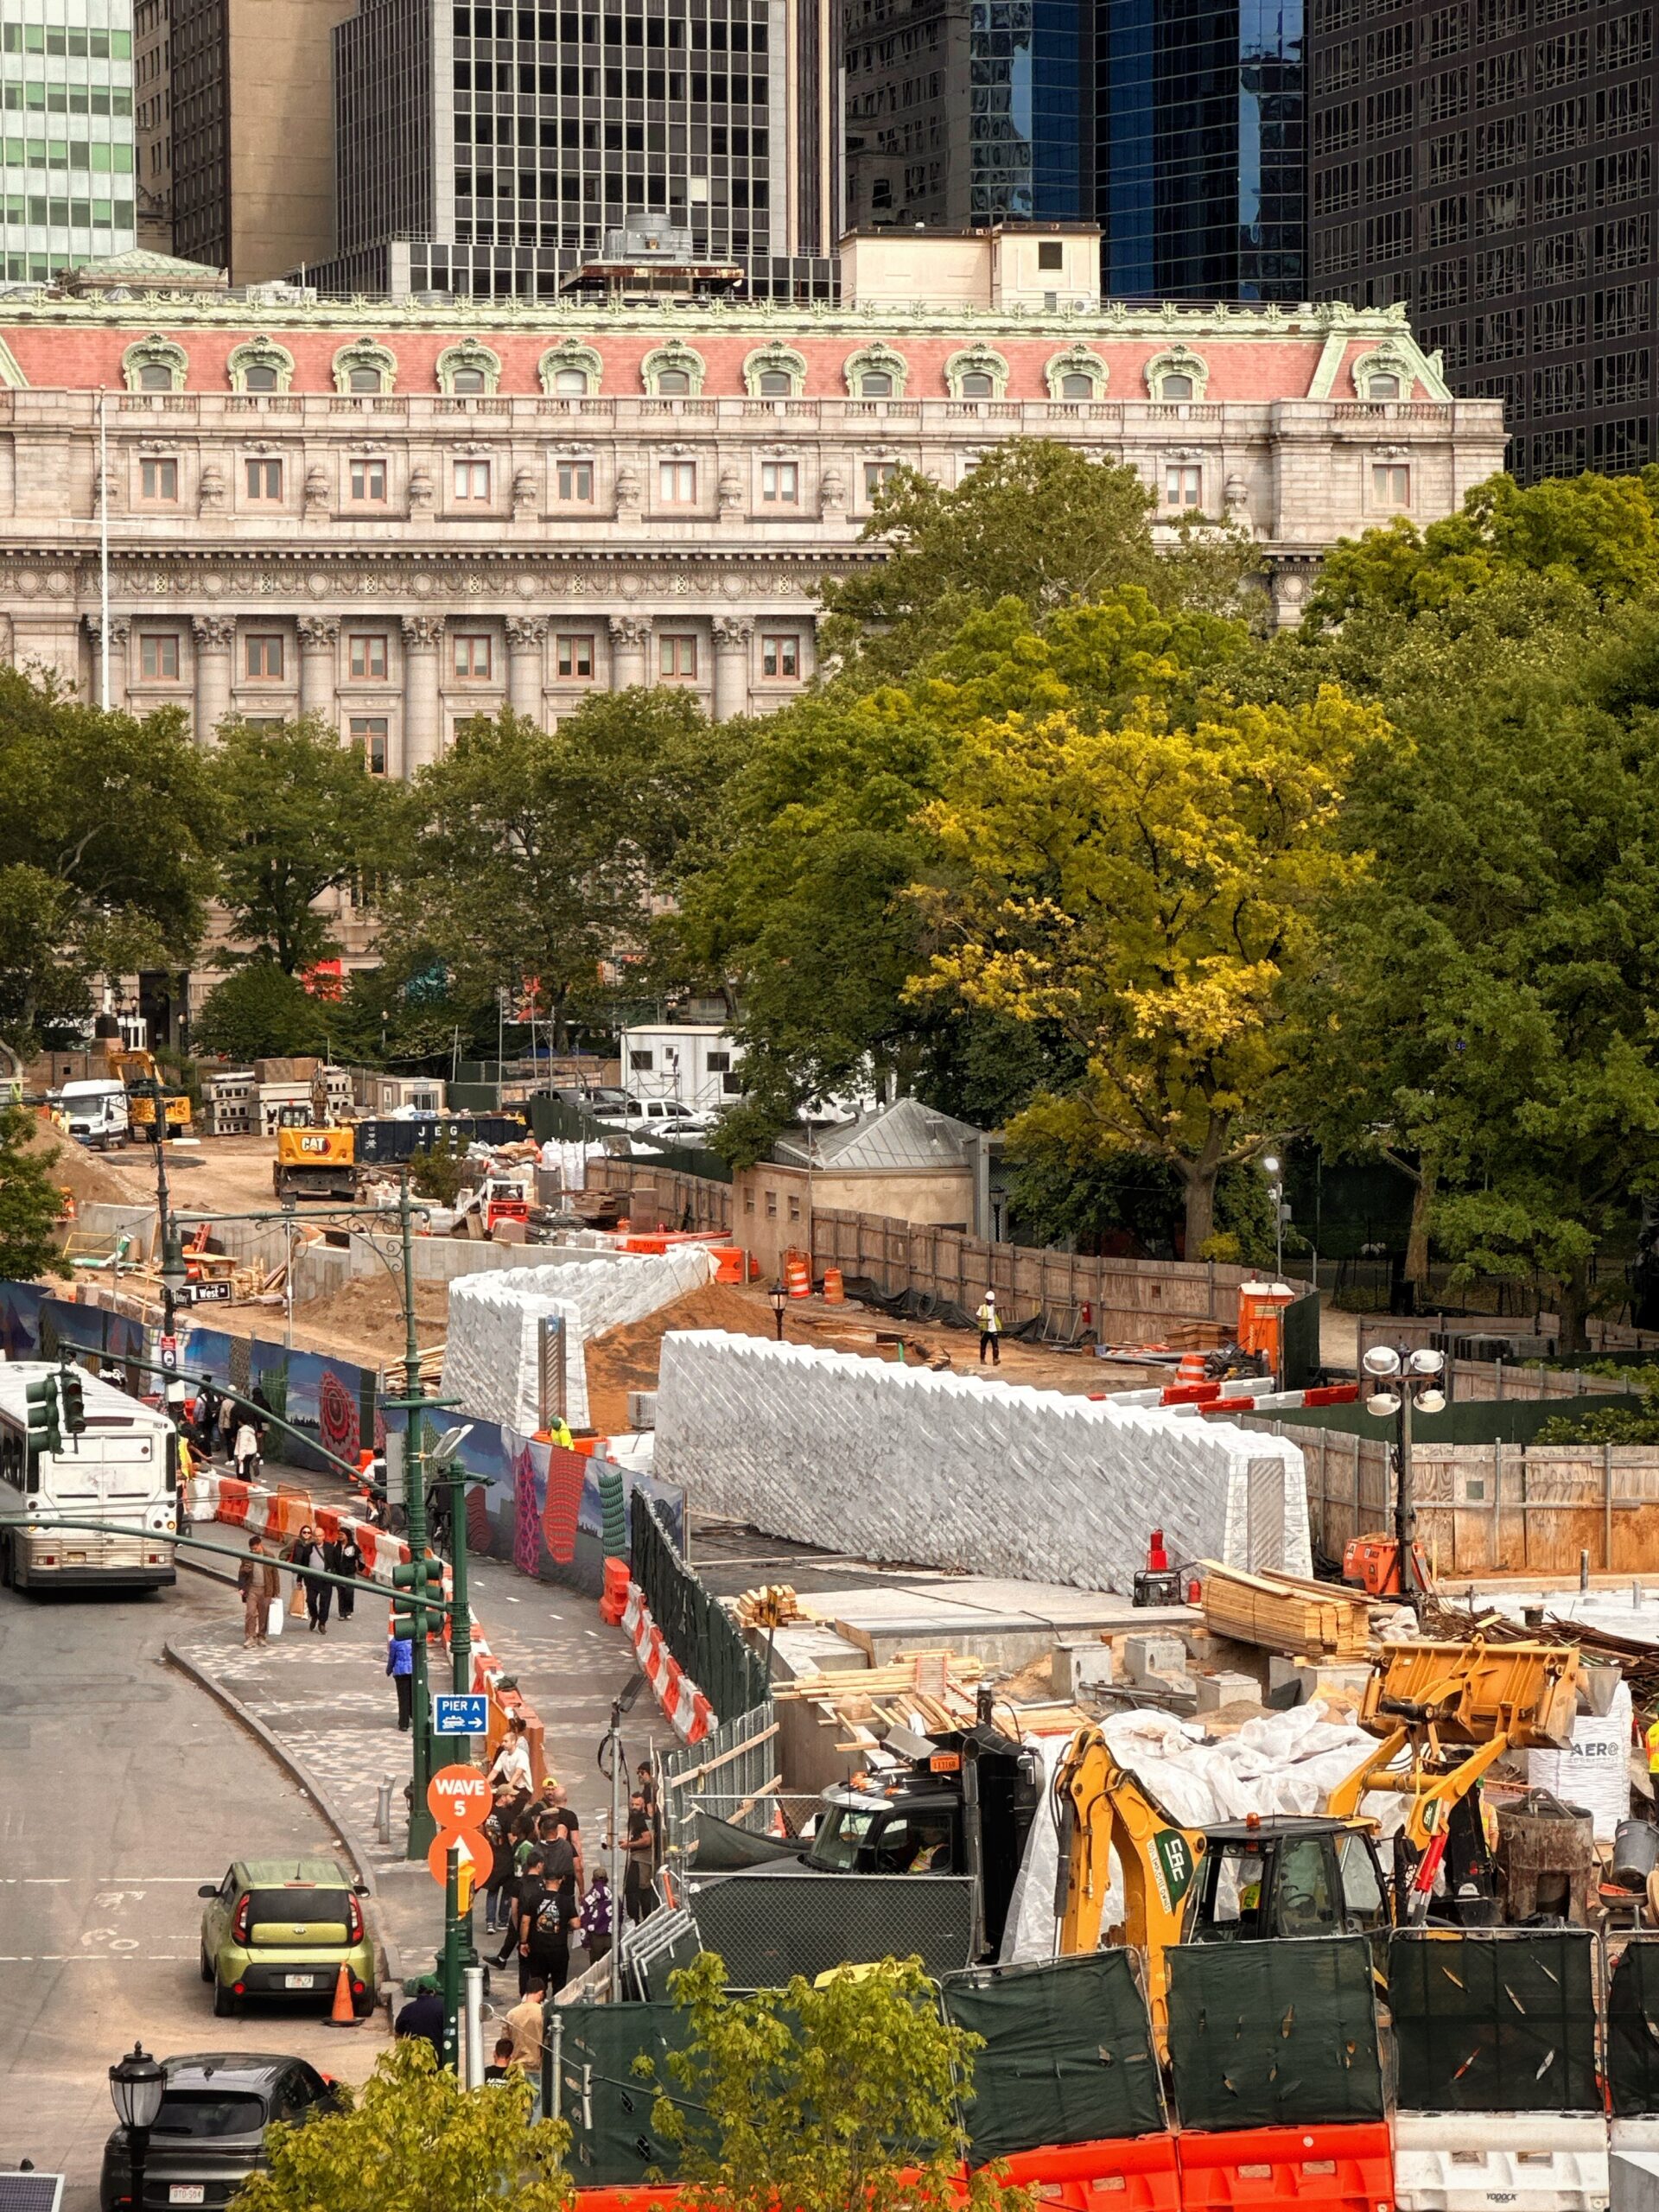
South Battery Park City Resiliency Project. Photo by Michael Young.
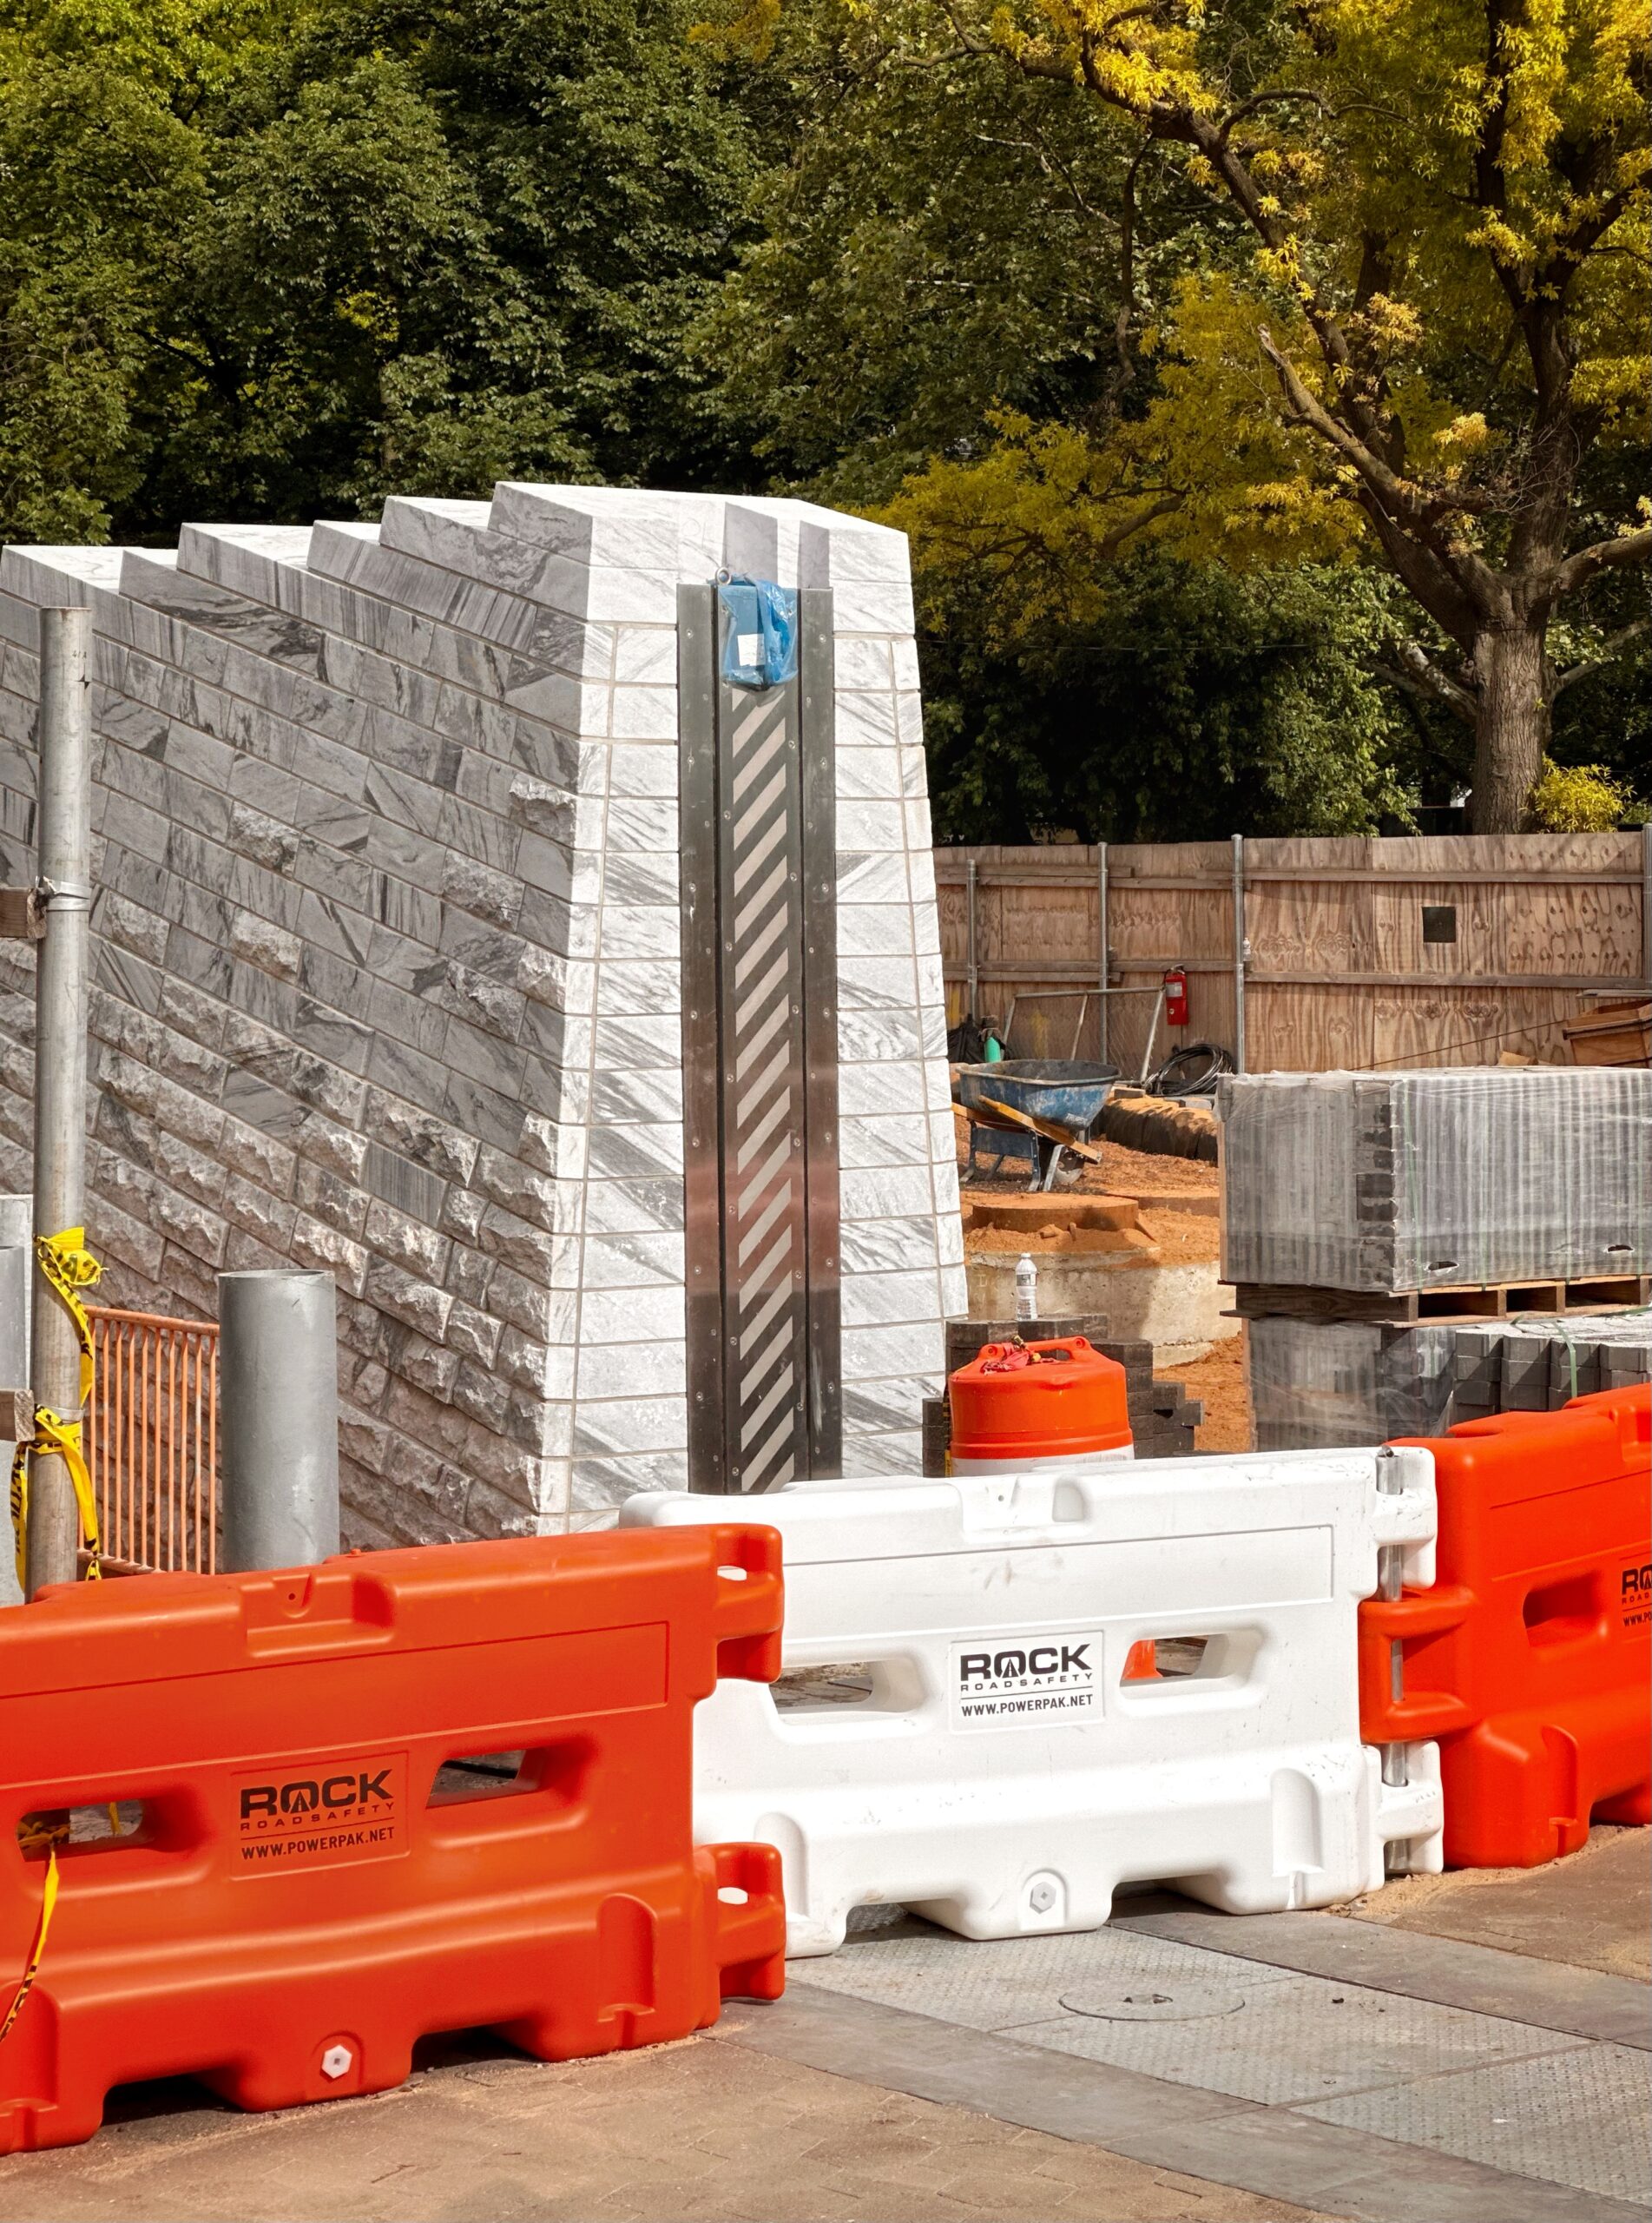
South Battery Park City Resiliency Project. Photo by Michael Young.
As outlined above, the city is in desperate need of a large volume of new housing. Eager to maximize allowable zoning rights to the last square foot, the private sector is clearly eager to build; in many cases, what is missing is the political will, legislative support, and public infrastructure necessary for such an endeavor.
While political decisions are made in City Hall and Albany, they are fueled and influenced by a well-informed, civically minded public, as are proposals and decisions for major infrastructure investments, whether in the form of transit, parks, schools, or other forms. Here, planning and engineering challenges also play a major role, but, as the above examples show, unorthodox yet flexible solutions sometimes readily present themselves.
At the end of the day, investments both in housing creation and infrastructure improvements benefits everyone in the city across the board, whether in the form of housing, jobs, added tax revenue, economic opportunities, and more. Comprehensive development of the city is ultimately in everyone’s best interest.
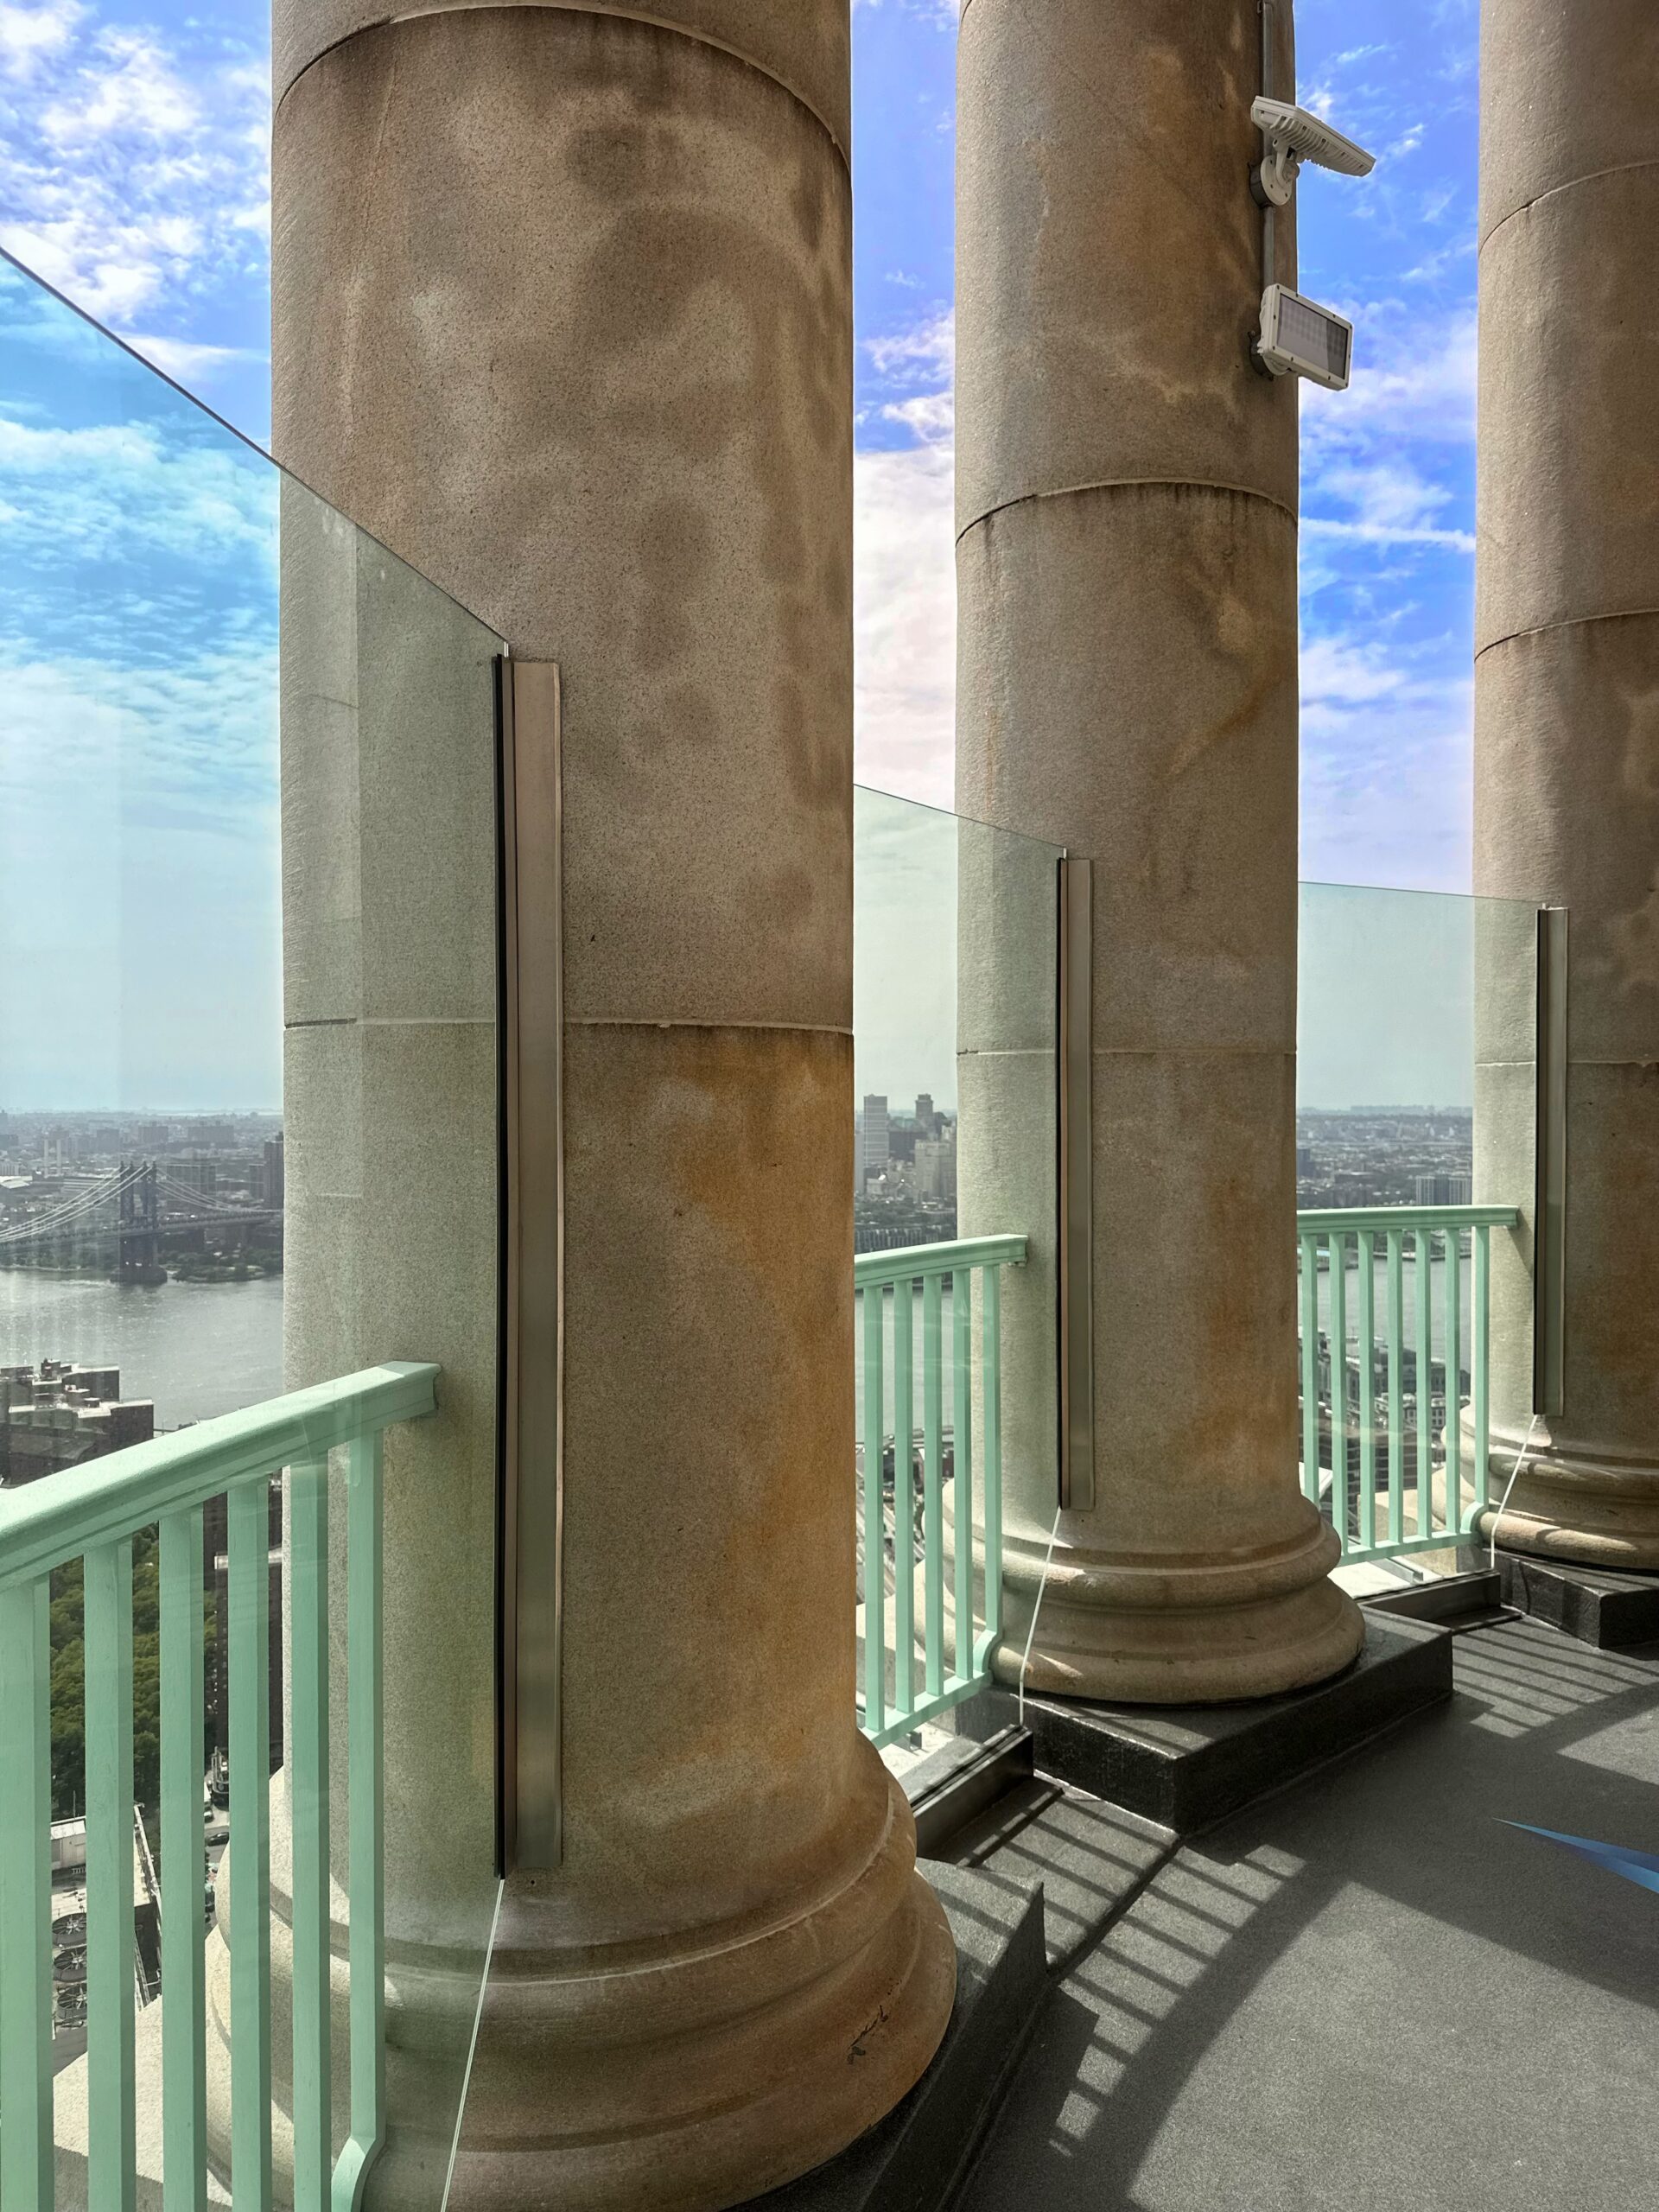
The cupola at 1 Centre Street. Photo by Michael Young.
The challenges the city’s built environment, transit, and housing market face are immense, yet there is much hope for future generations. Far below the lofty city and state politics, the pro-housing, Yes-In-My-Back-Yard movement is gaining momentum even at the most down-to-earth grassroots levels. The YIMBY club, which was formed in Stuyvesant High School in 2024, currently counts around 30 members.
There is a collective will in the city that demands construction of ample new housing, new commercial space to sustain the economy, conversion of obsolete offices into new residences, and creation of new transit, parks, schools, and other social amenities to make it all possible. Let’s keep this collective will growing to keep New York thriving years into the future.
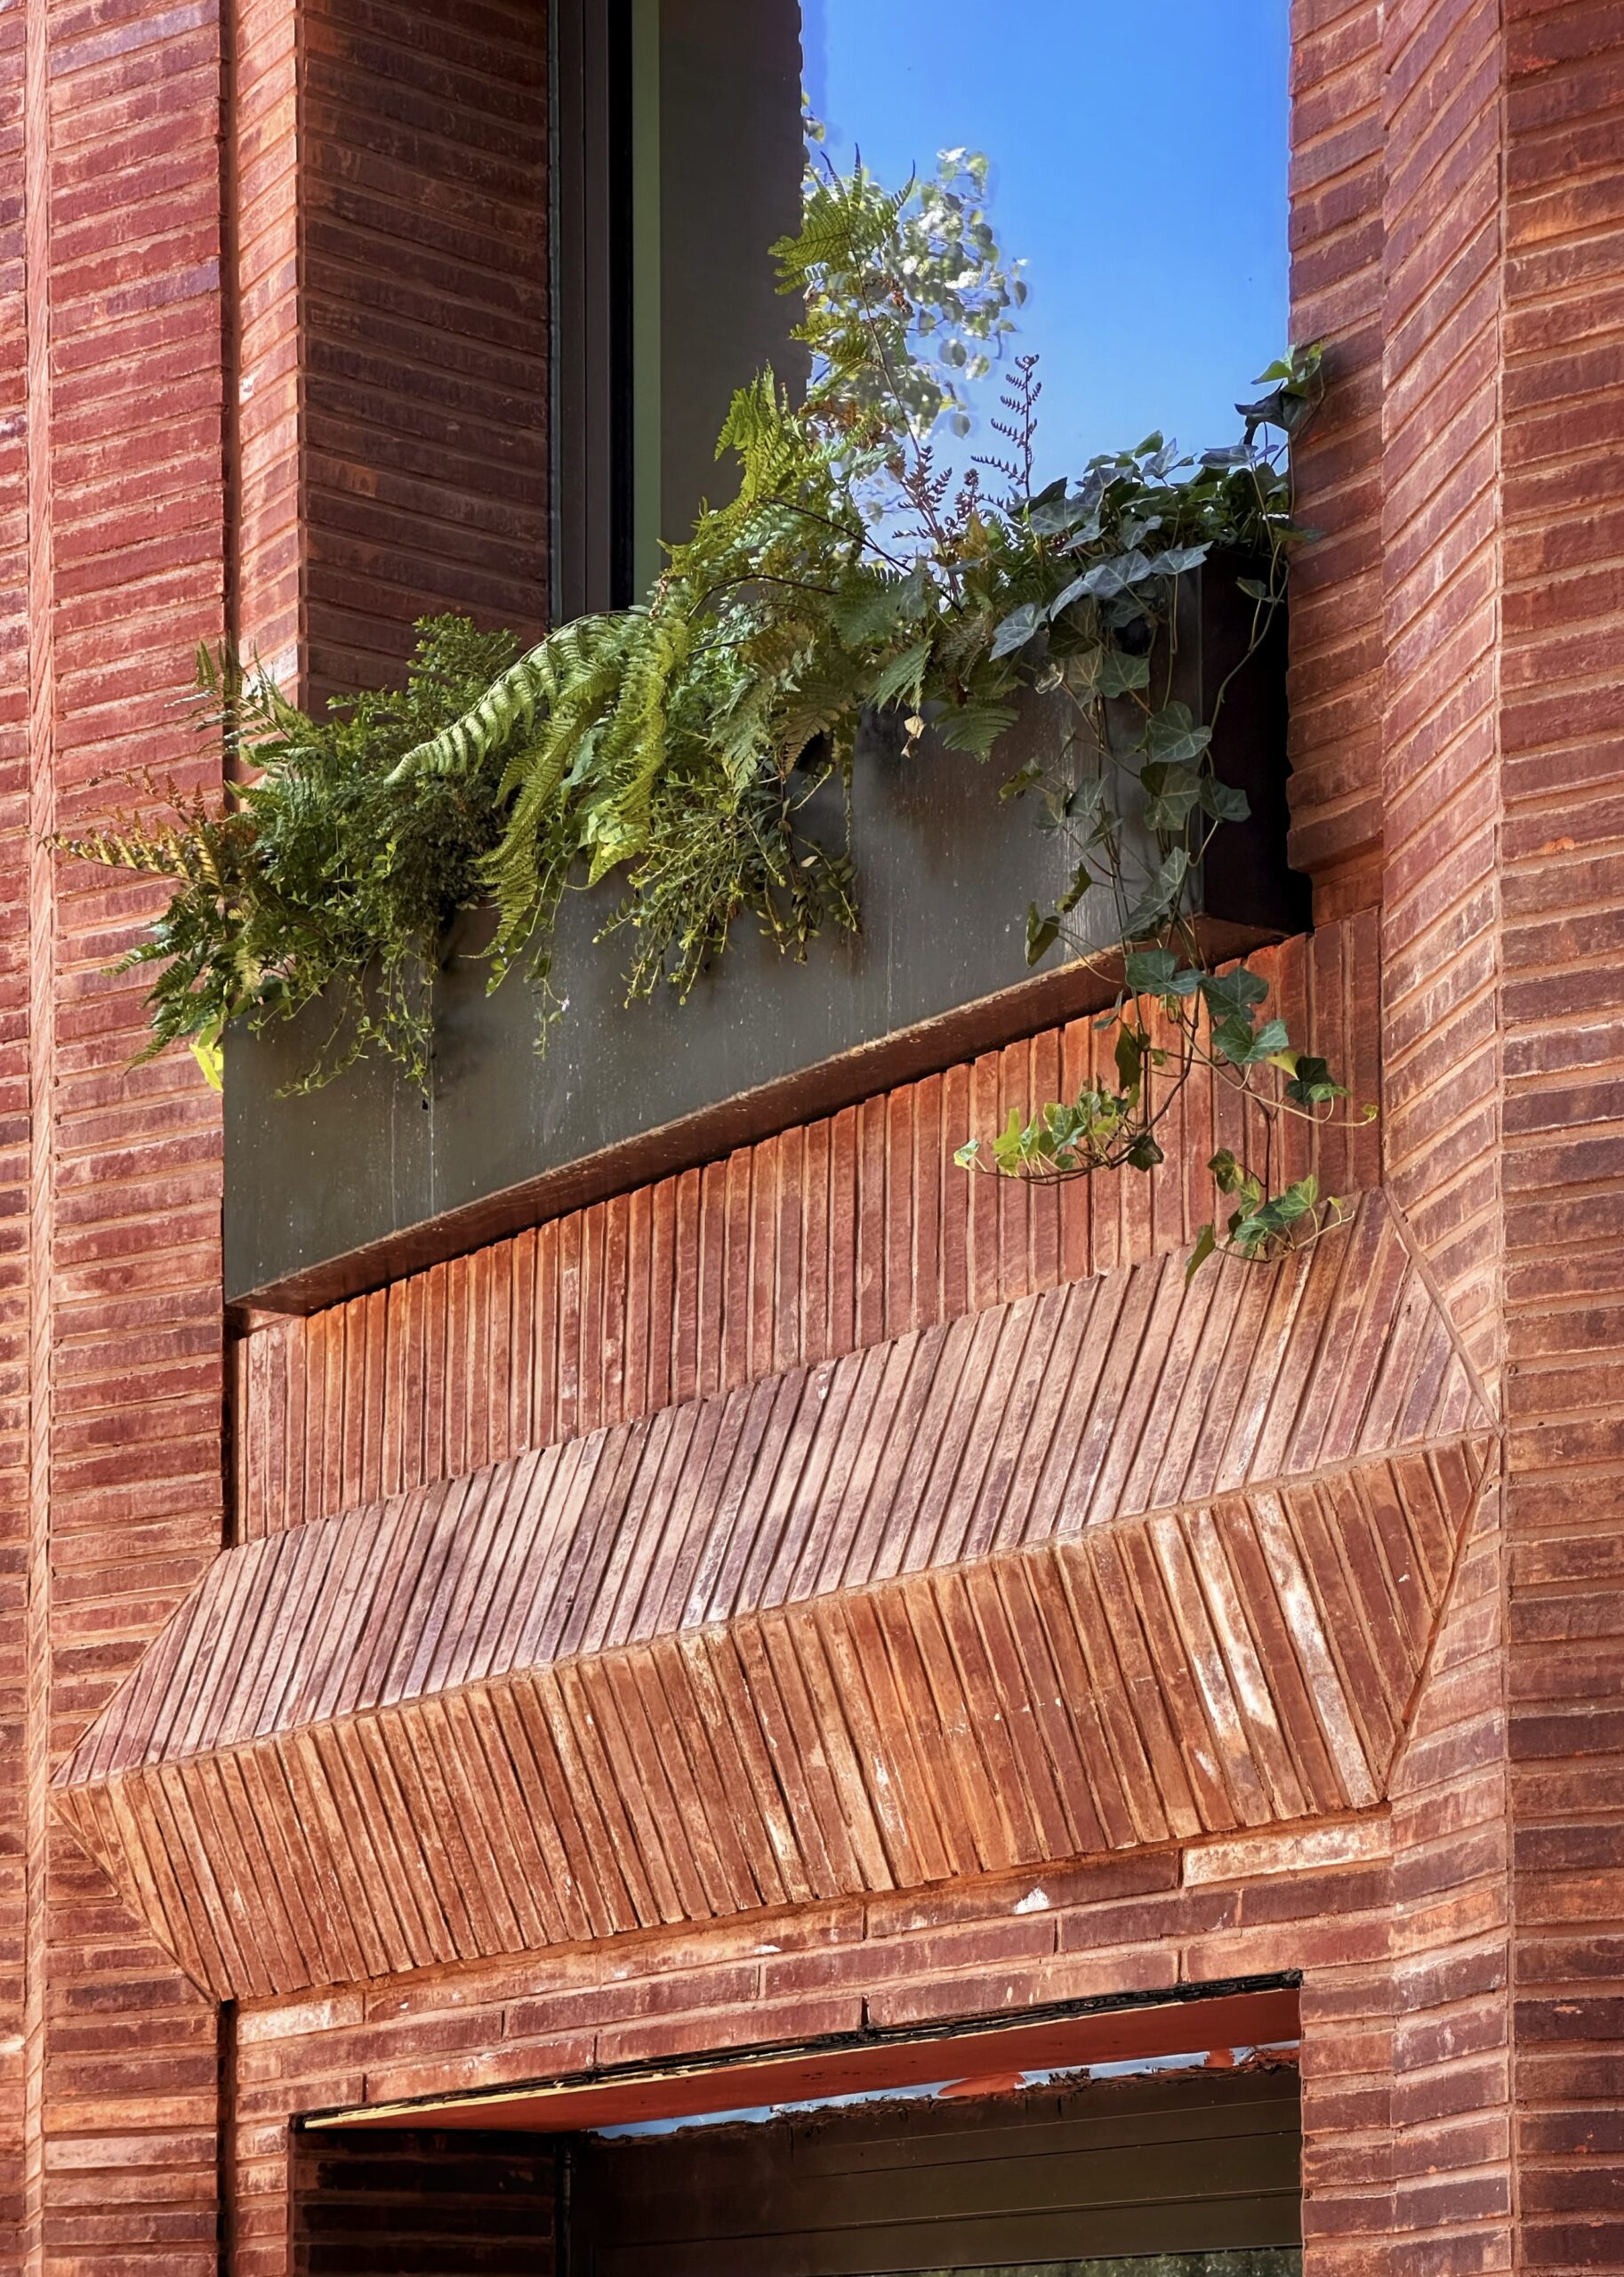
256 East 4th Street. Photo by Michael Young.
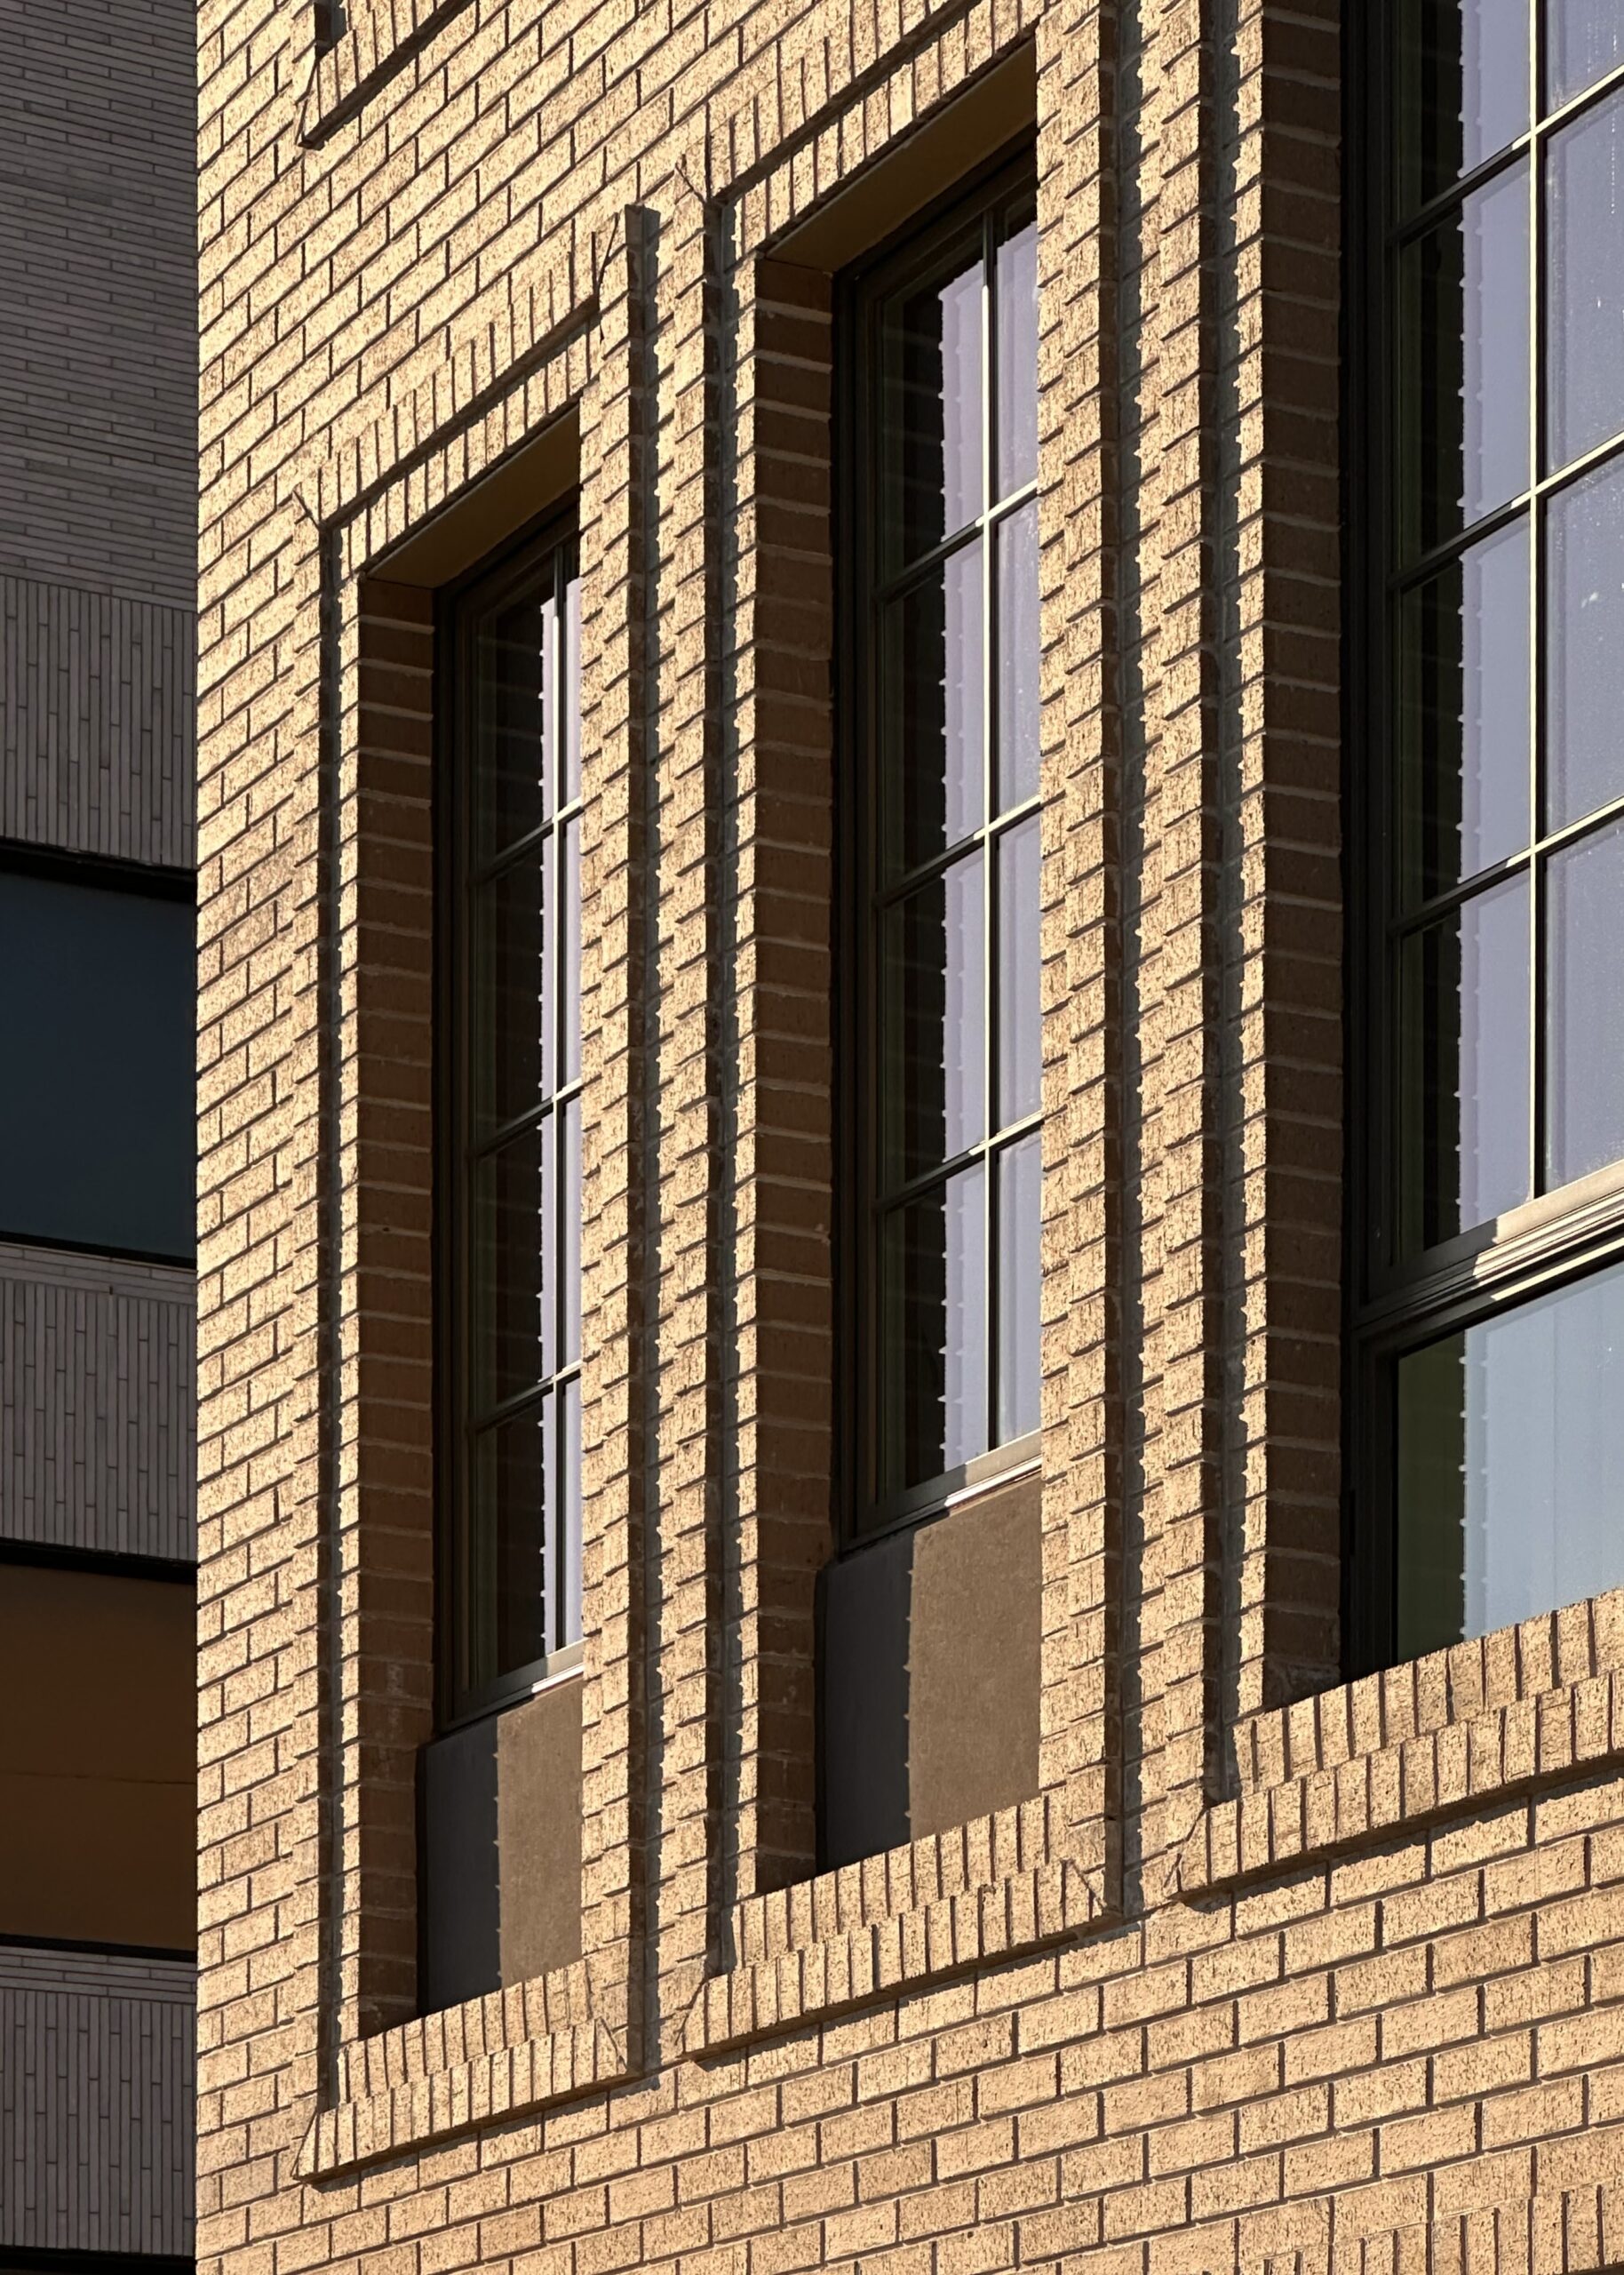
655 Baltic Avenue. Photo by Michael Young.
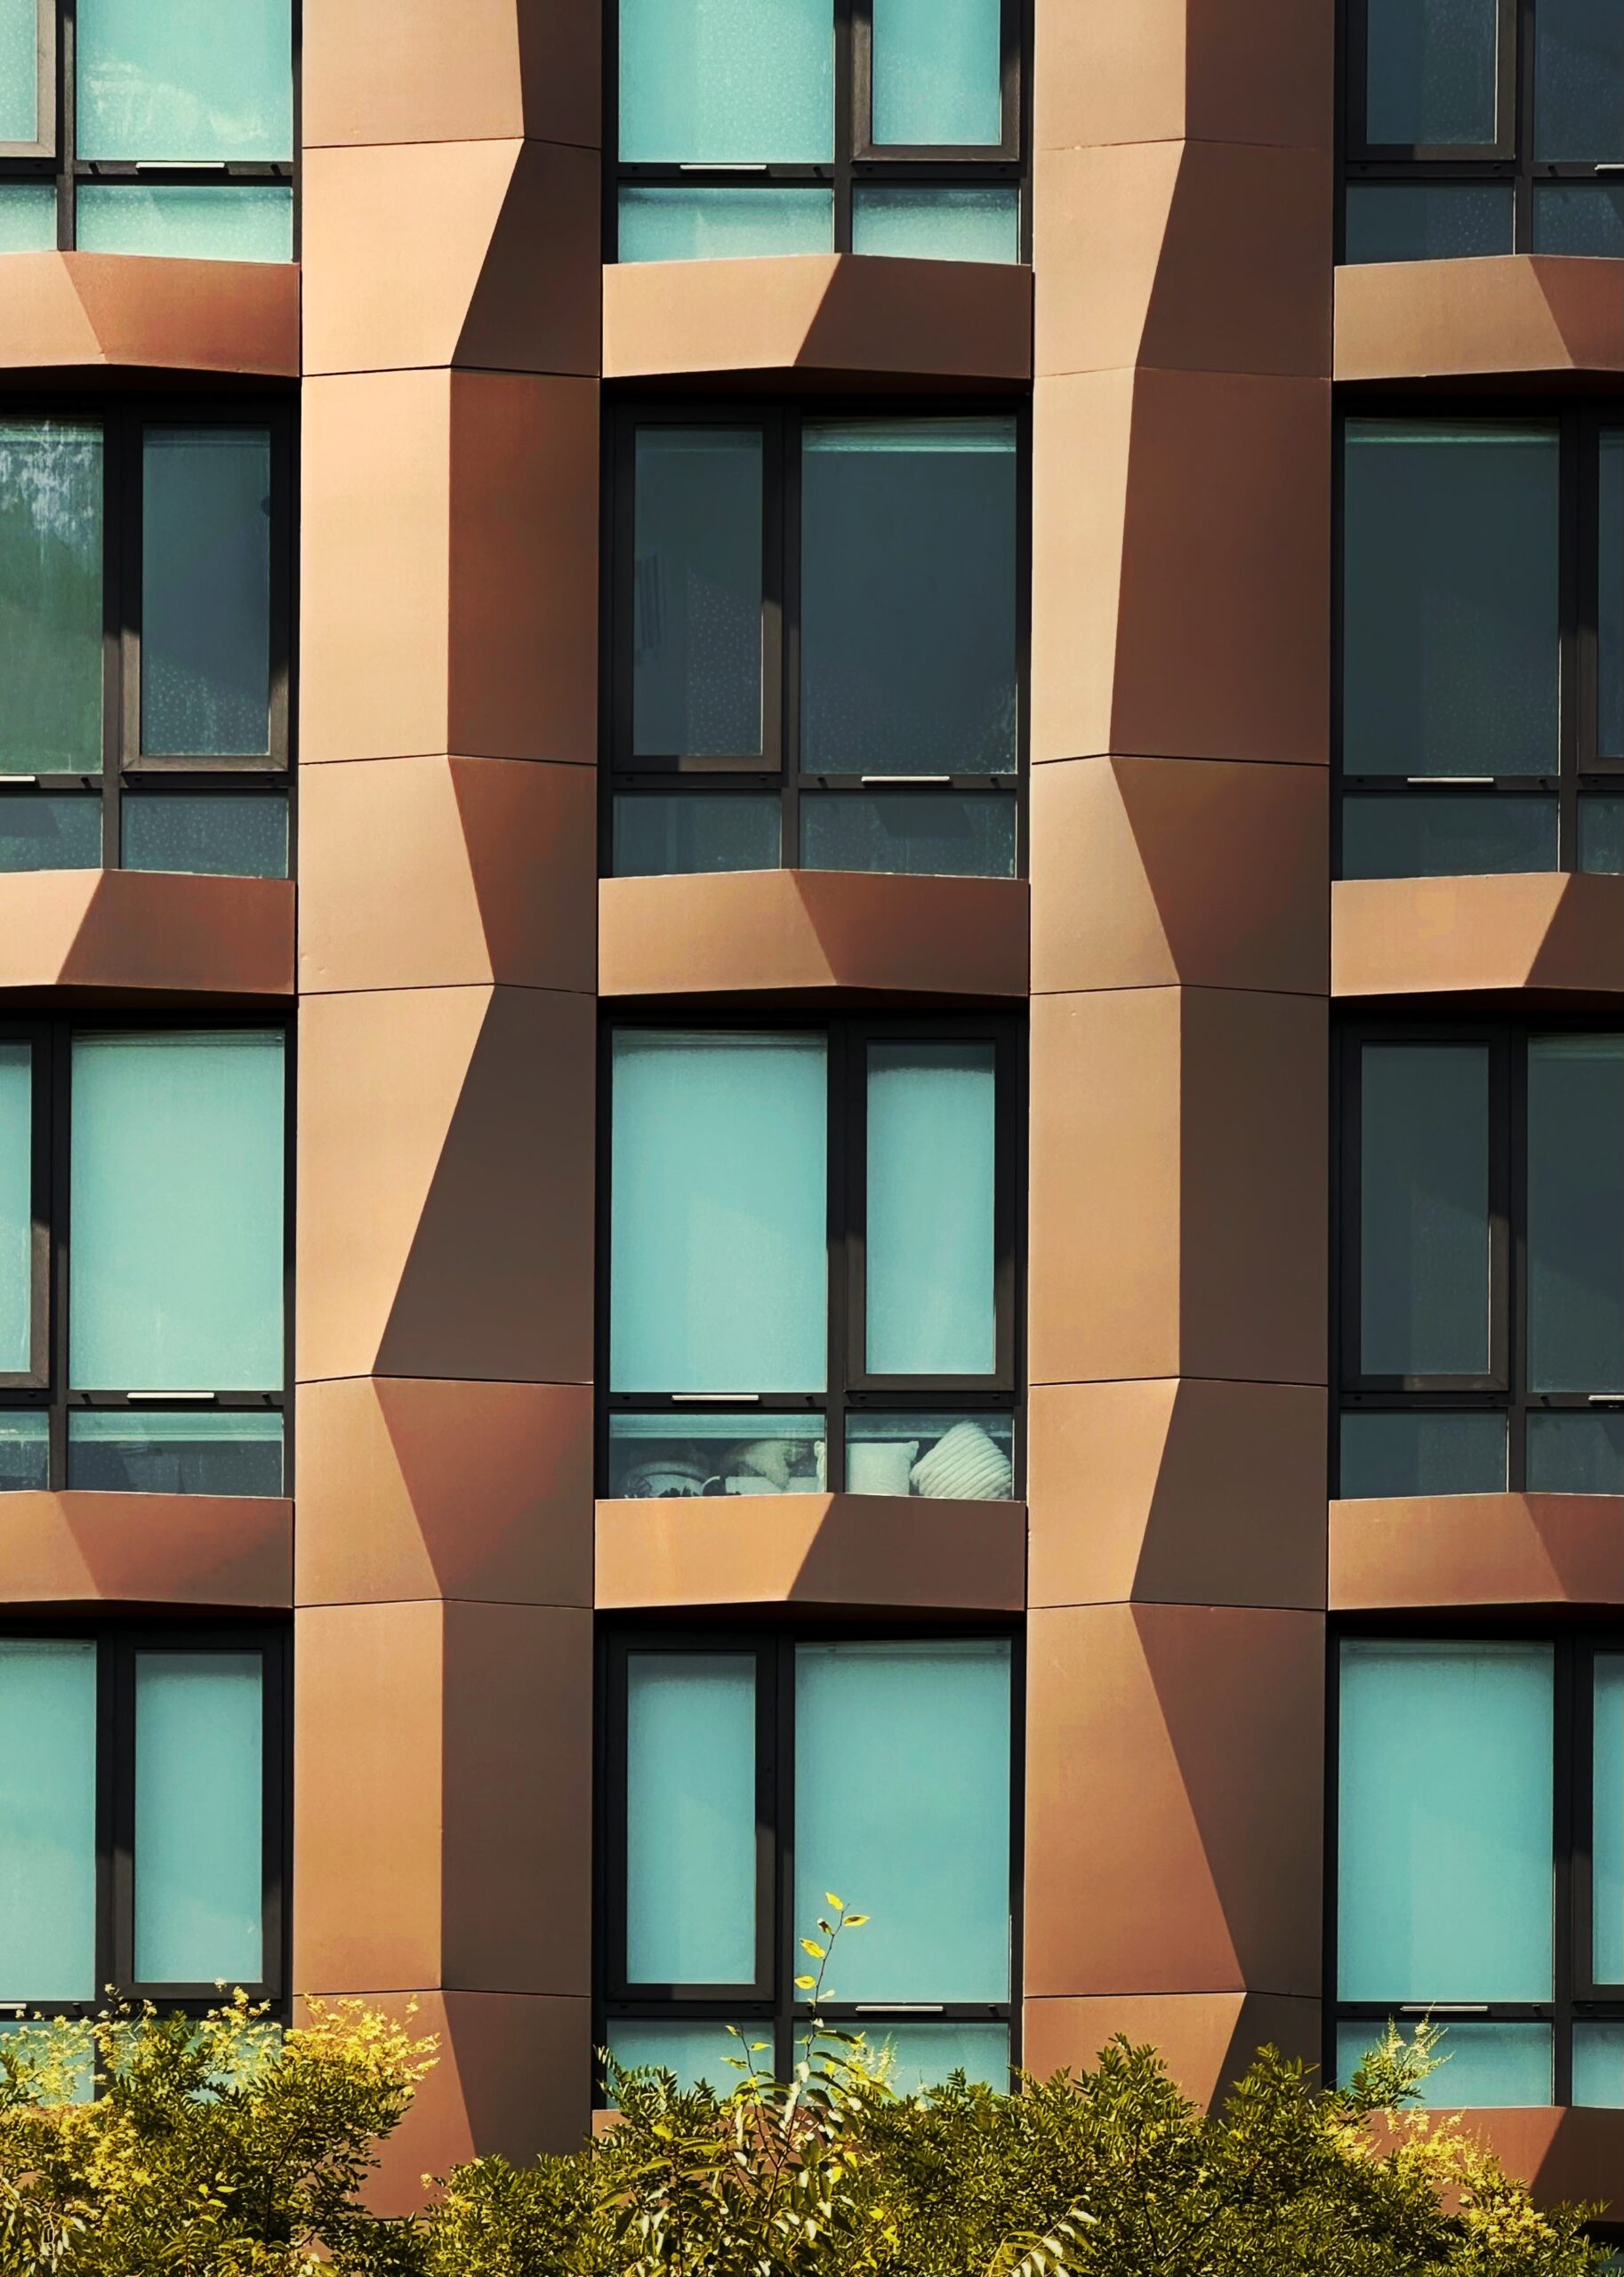
125 Chrystie Street. Photo by Michael Young.
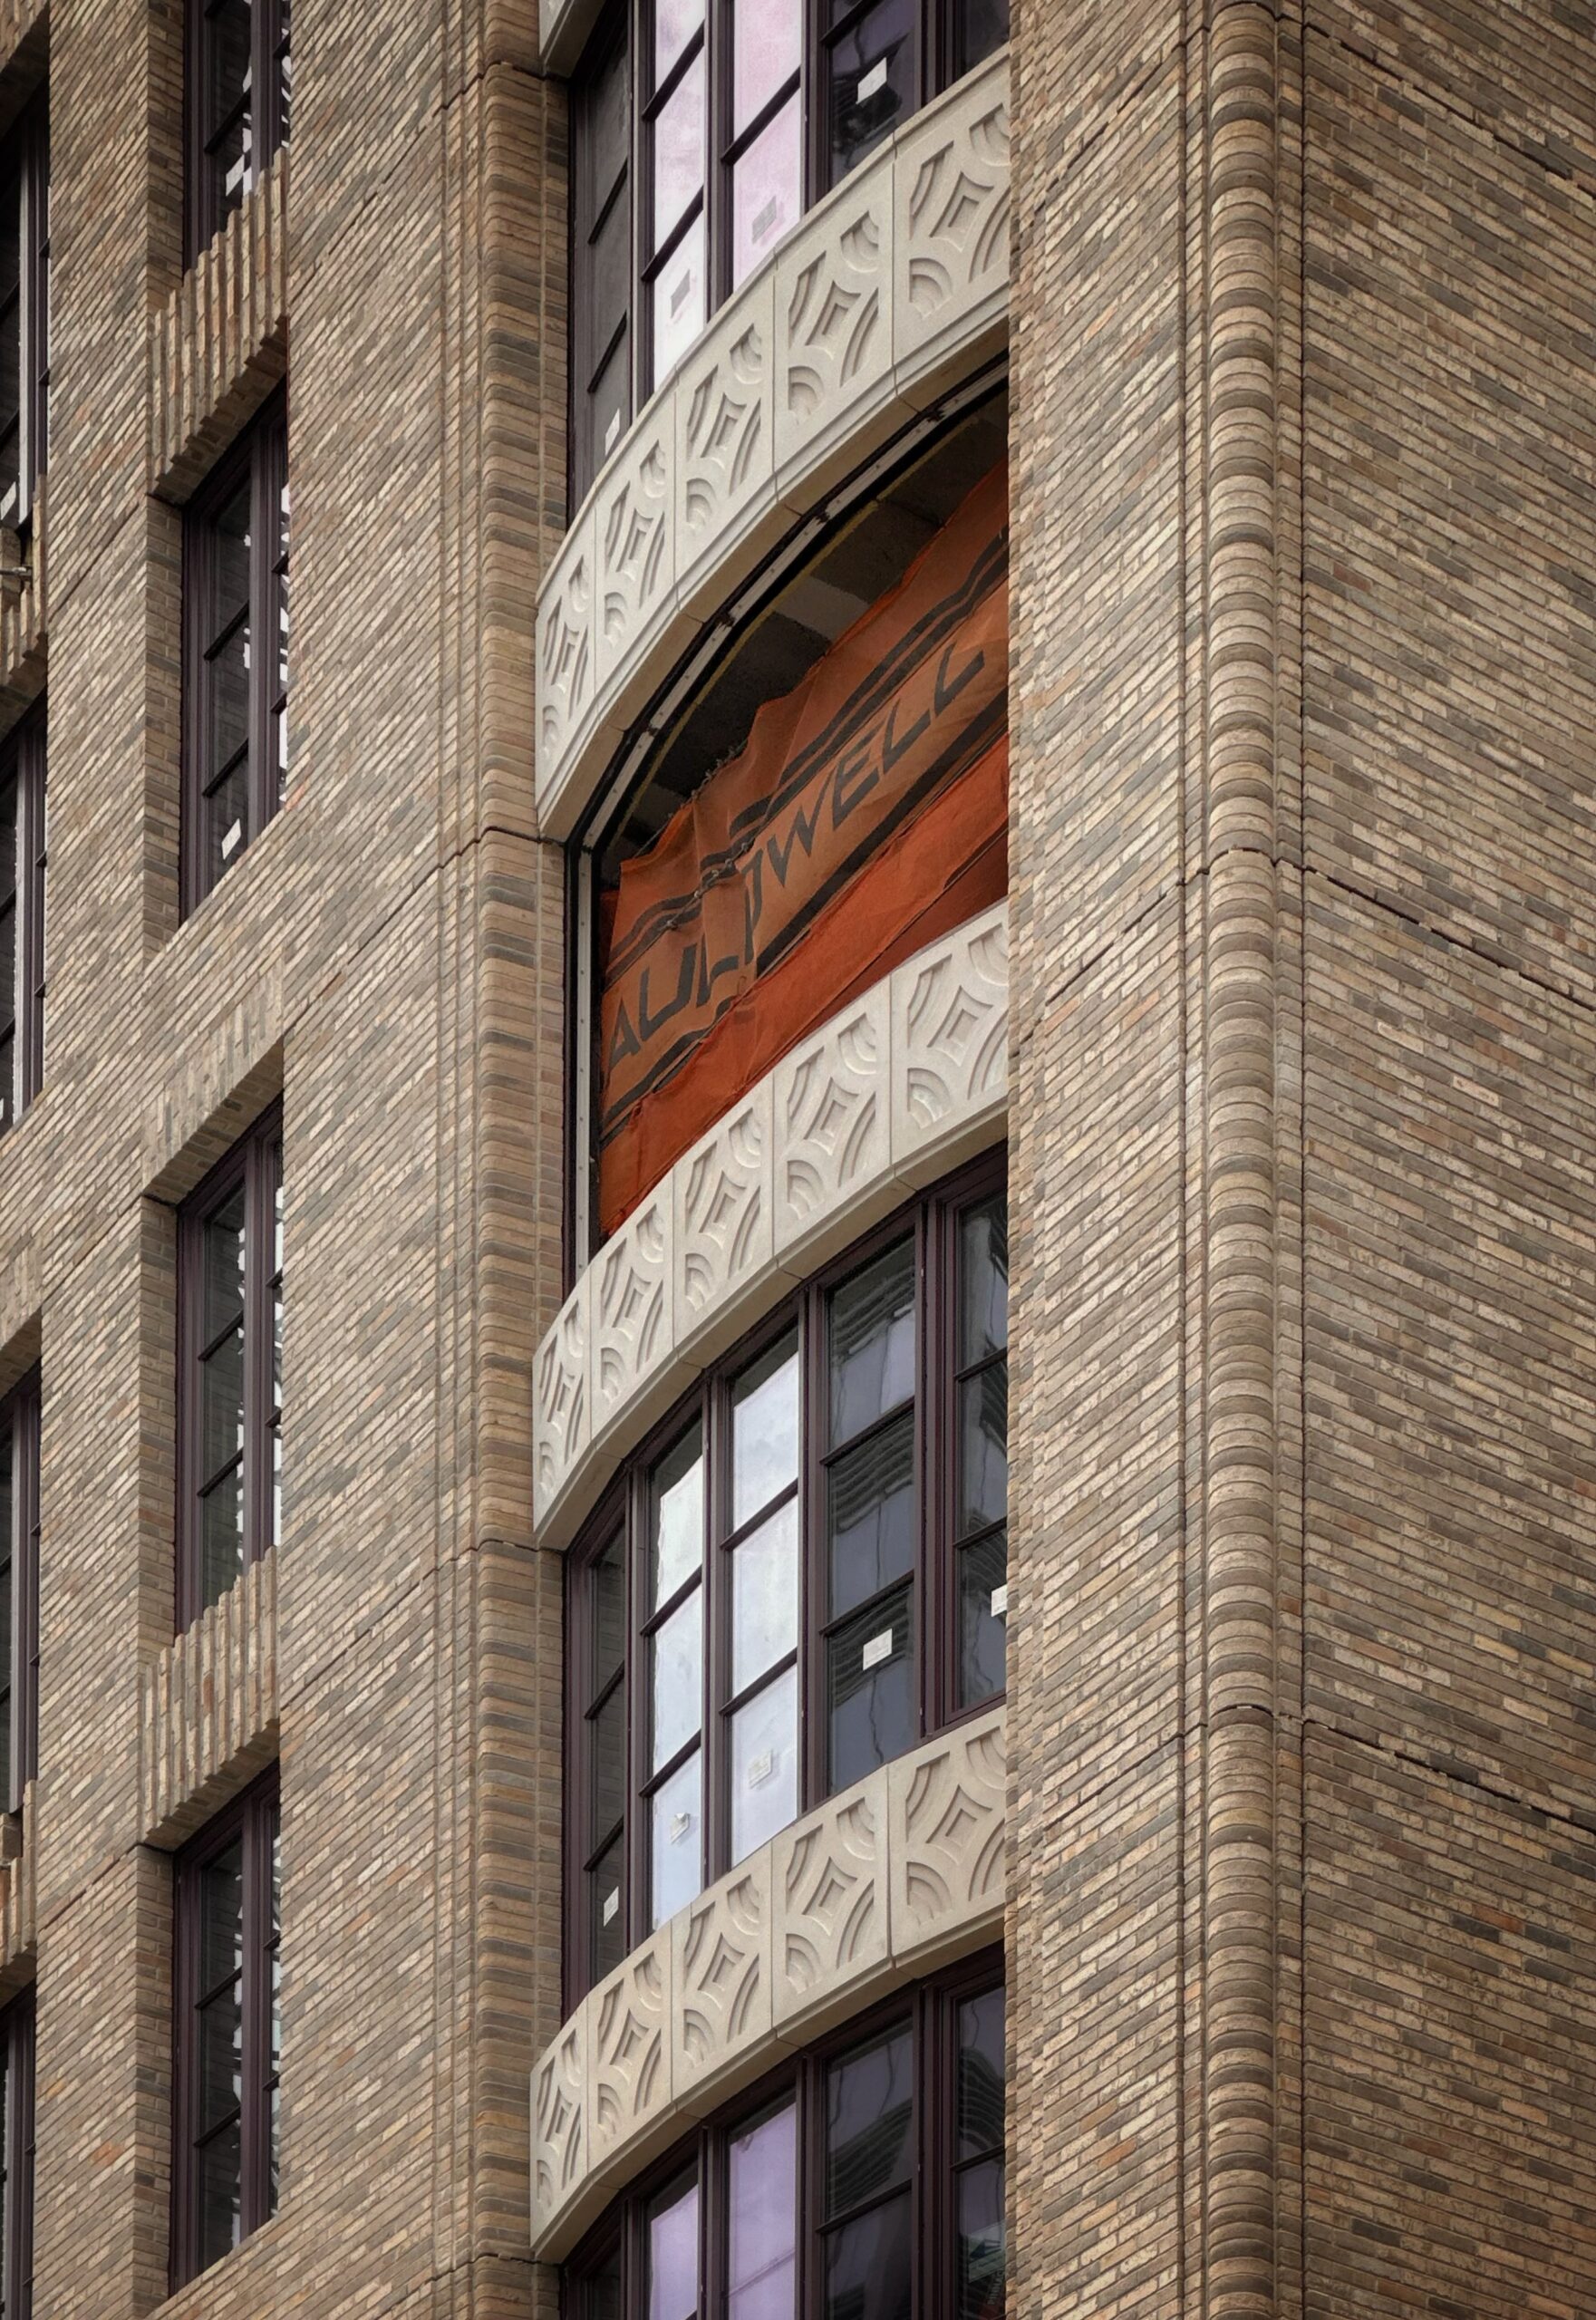
200 West 88th Street. Photo by Michael Young.
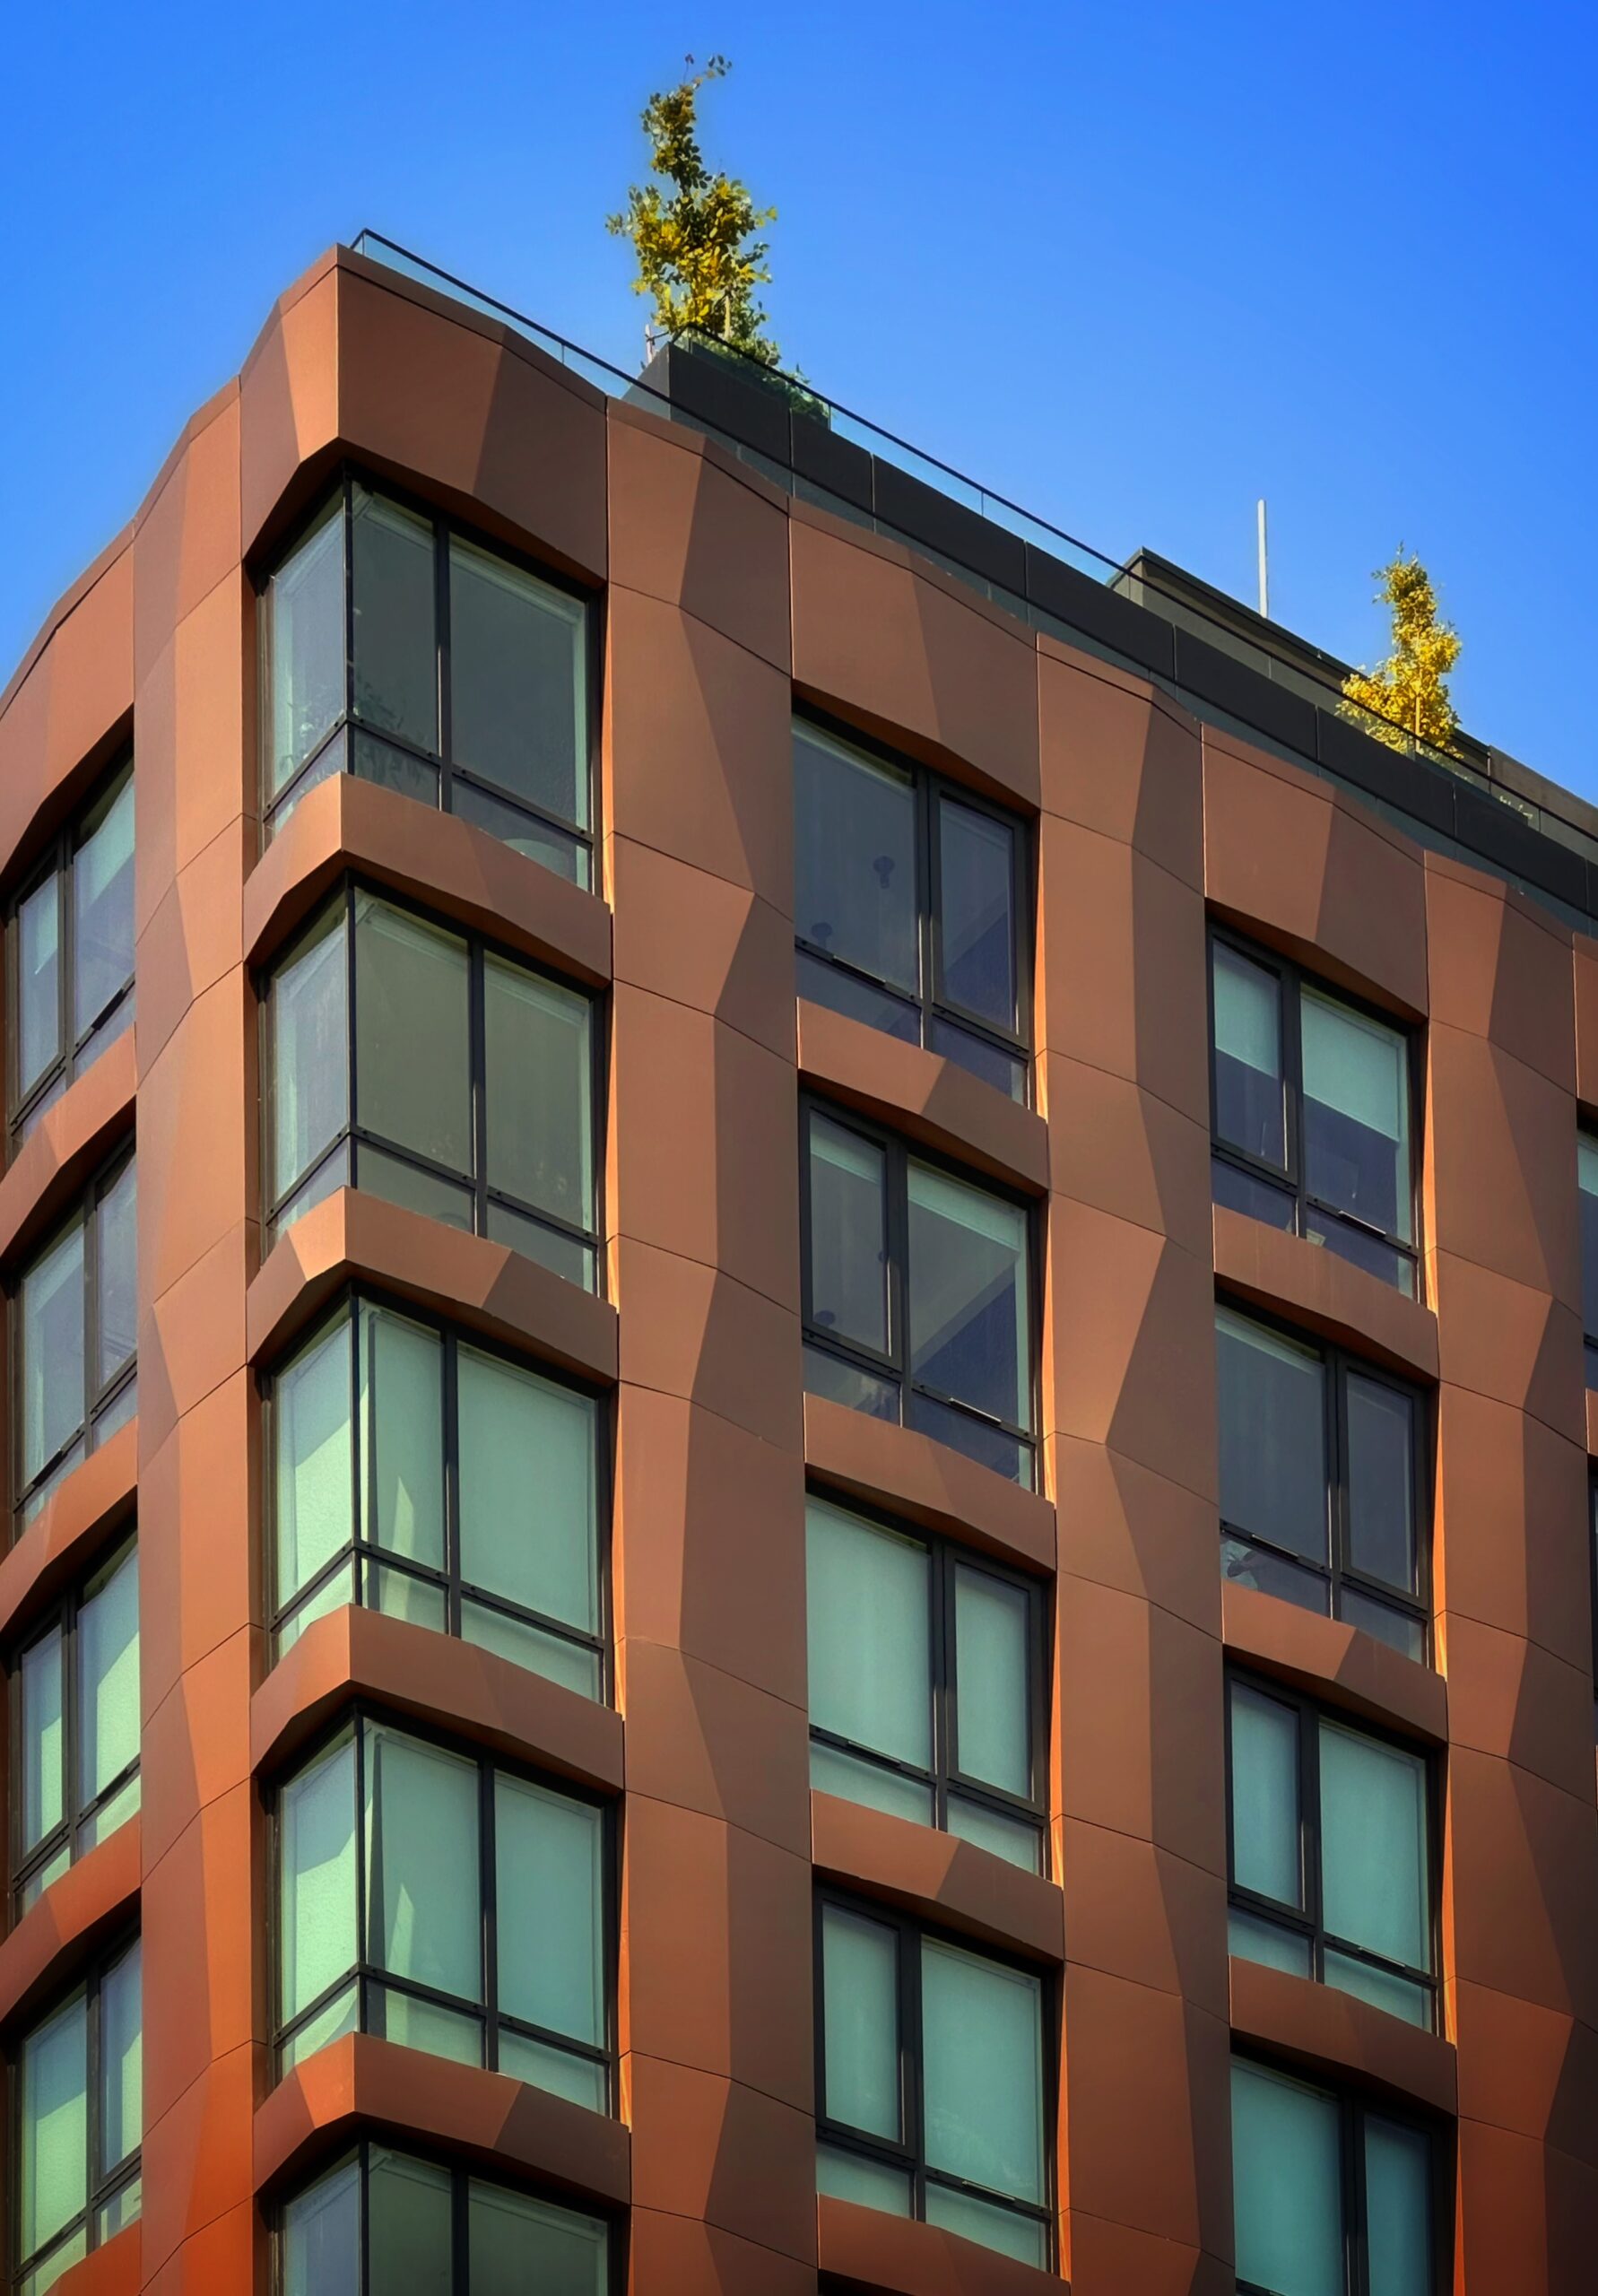
125 Chrystie Street. Photo by Michael Young.
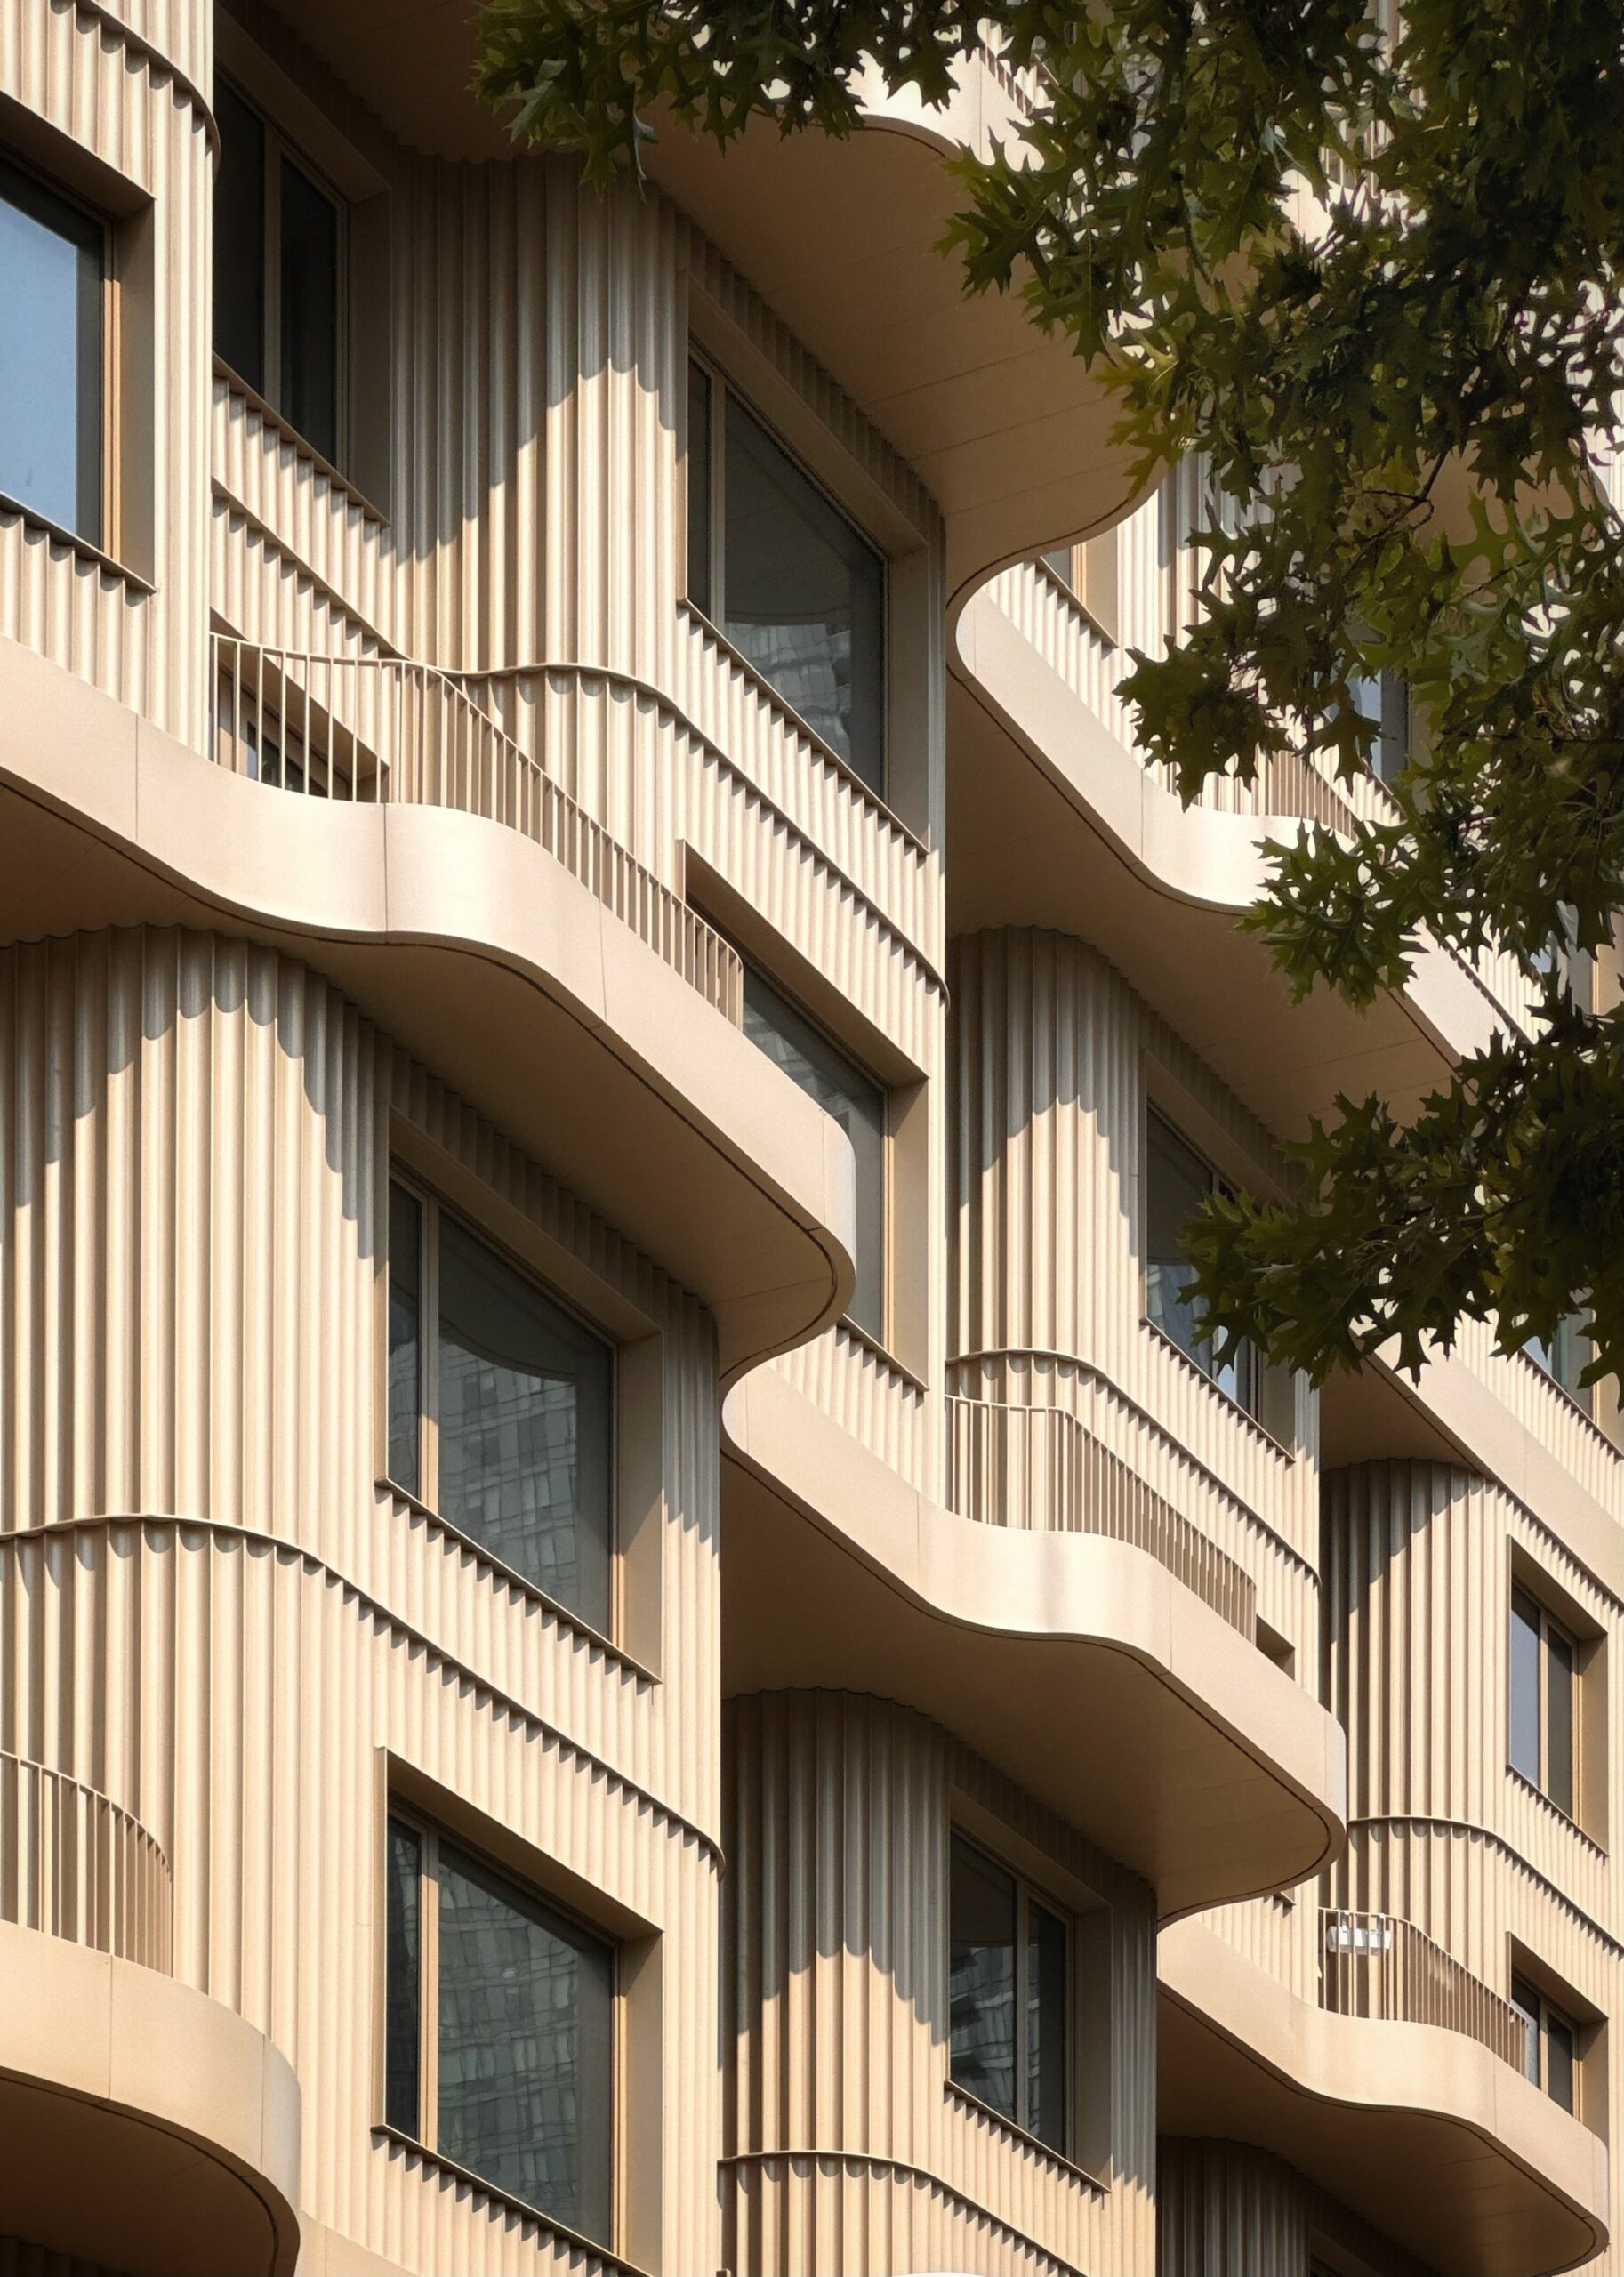
Radiant LIC. Photo by Michael Young.
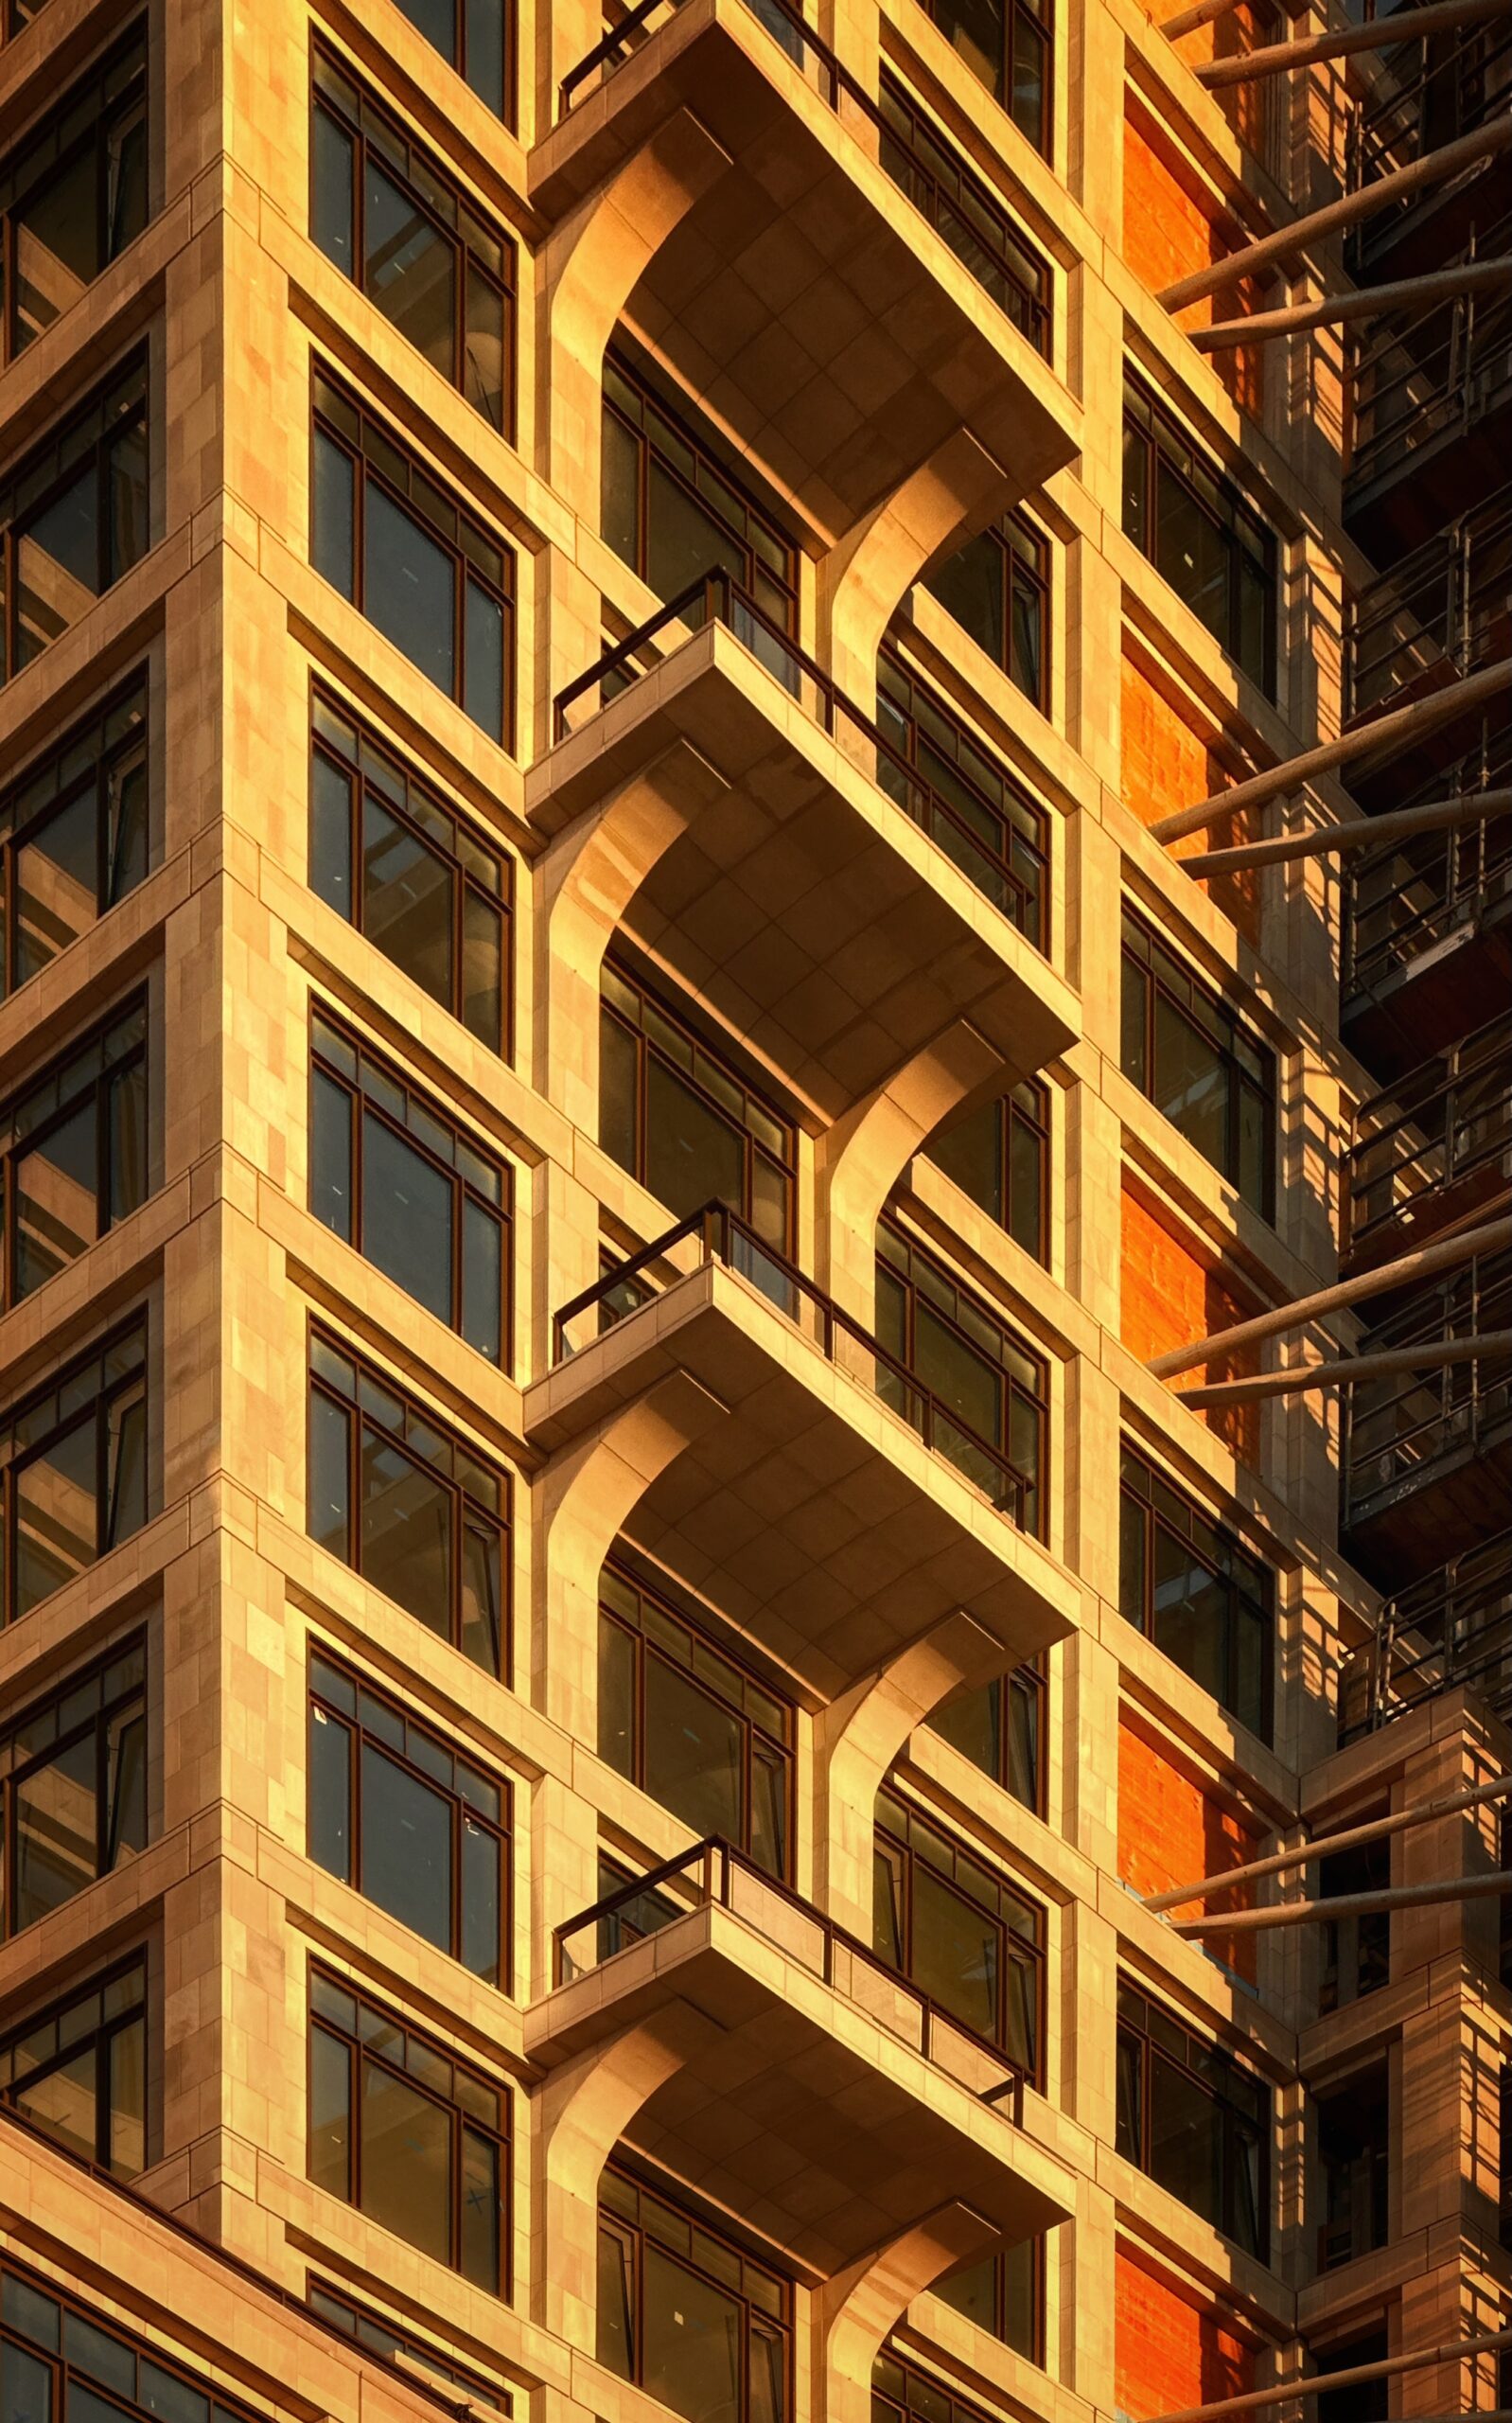
80 Clarkson. Photo by Michael Young.
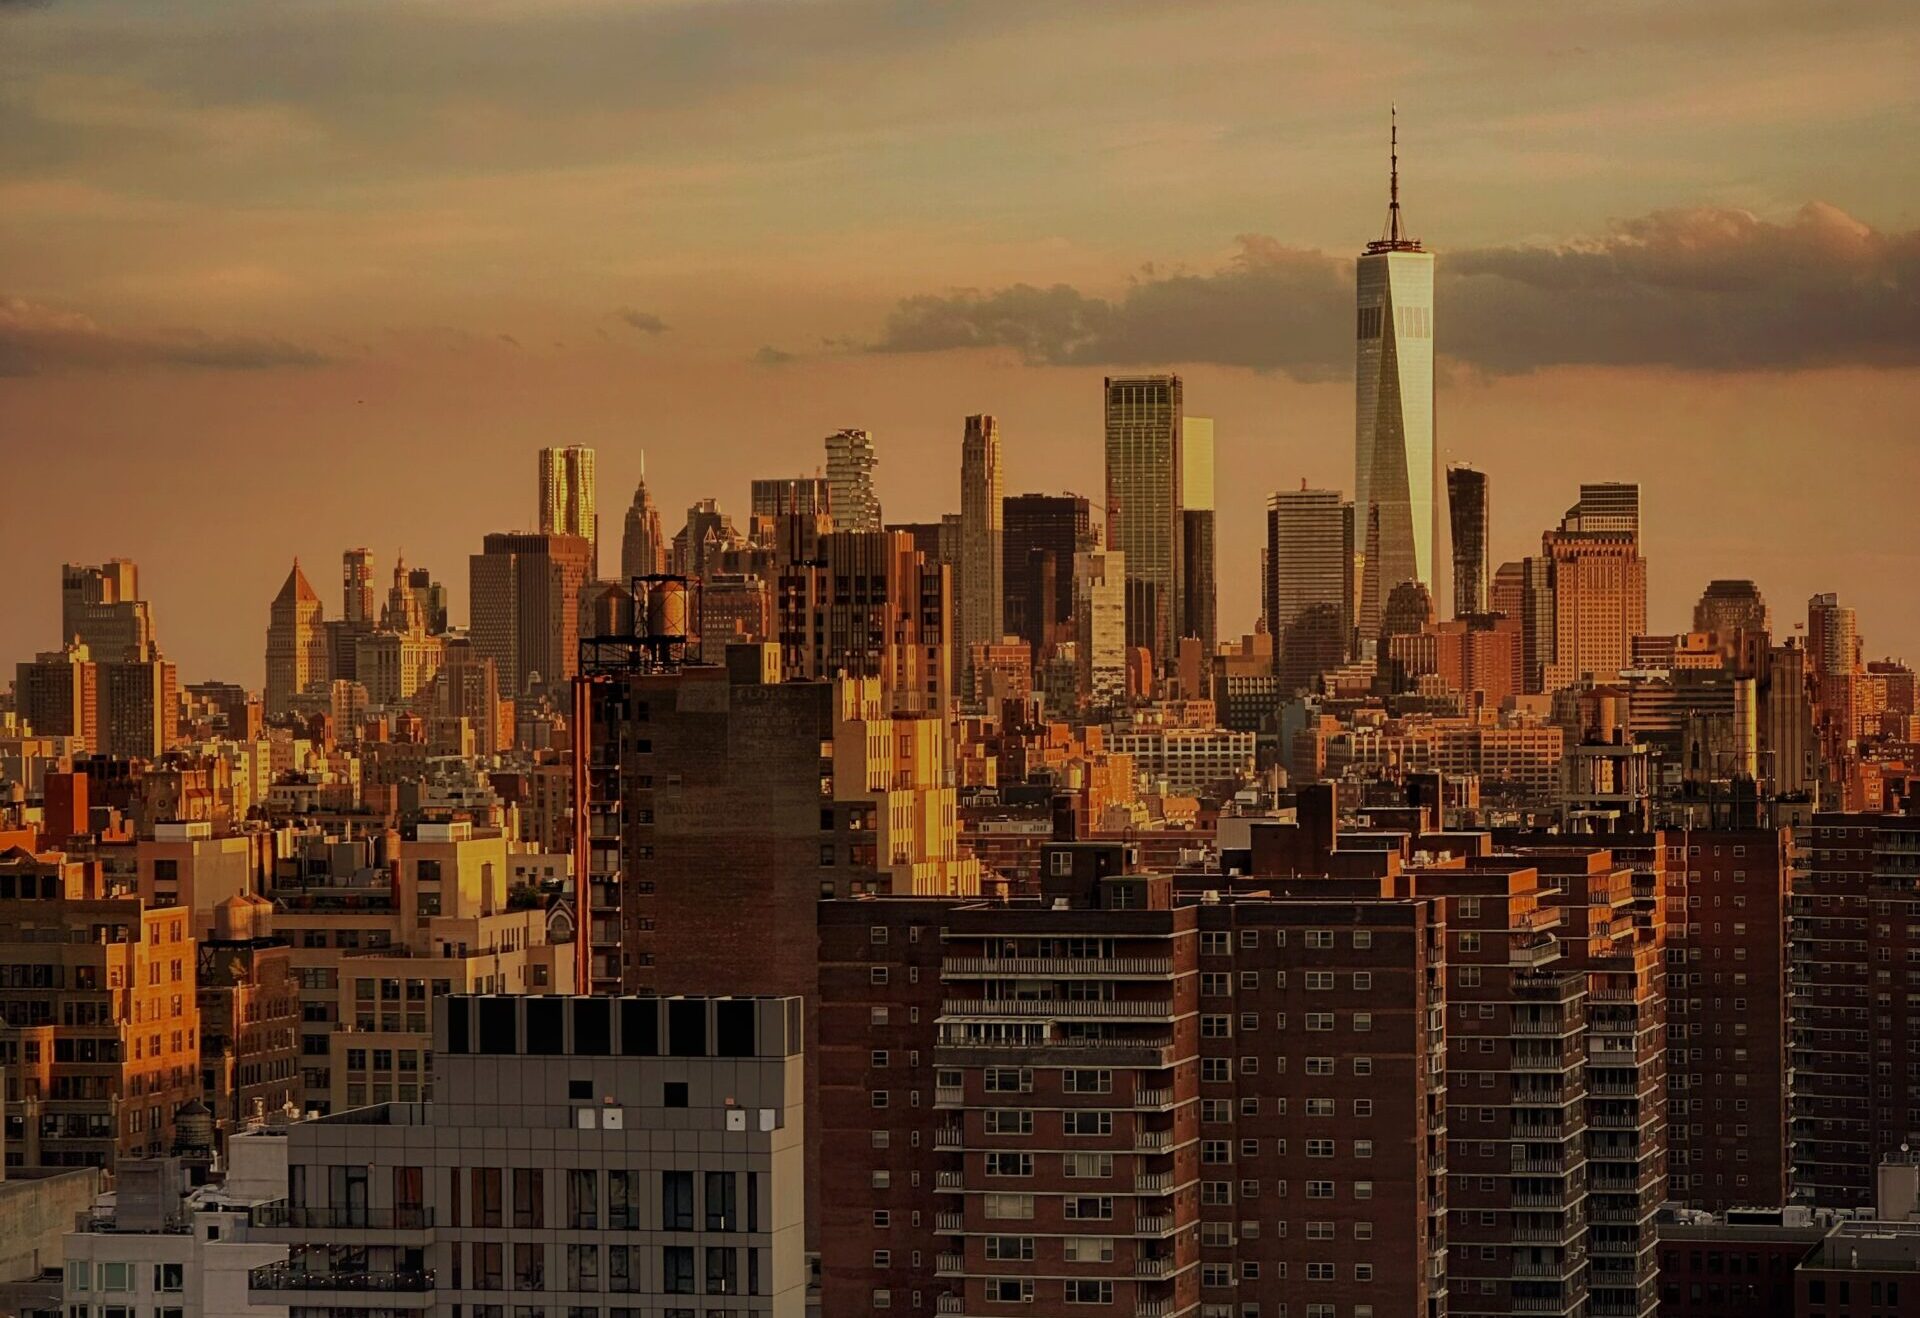
New York City, circa June 2026. Photo by Michael Young.
Subscribe to YIMBY’s daily e-mail

Follow YIMBYgram for real-time photo updates
Like YIMBY on Facebook
Follow YIMBY’s Twitter for the latest in YIMBYnews
Awesome news.
So many things going on, all to melt into the stew of NYC..
Continuing the 65,000 unit/year pace that’s almost double the average from he last decades.
So much for the argument that the city is declining.
Wonderful photography
Thank you Michael Young!
Love a print book of your work
THe text on the issue of transportation infrascture is the best part of this article and starts with:
“Expansive, dense urban development is impossible without proper mass transit access.”
I cannot find how many Affordable DUs were filed, where they are and what the AMI spread is for those filings. HPD stats should be cross-referenced with DOB stats. Other lots of interesting stats that don’t apply to the housing shortage. Also, lots of nice photography that glosses over fundamental housing shortage. How many Office to Residential applications were filed, whats the DU count, where located, how many Affordable Units with what AMI etc.
Regardless, this is always worthwhile reading to get a general pulse of what construction is happening across the boroughs?
Thank you,
WMS