

The second quarter of 2020, without a doubt, has brought more upheaval to New York and the United States at large than any period since September of 2001. However, in spite of all of the challenges, the city is continuing to grow: 476 new building permits were filed in the three-month period from April through June, spanning 9,309 multi-family units, with the full rundown of all the new developments in Excel format available at the link. While this was down somewhat from Q2 2019’s 12,123 residential unit filings for the same time period, it was still up substantially from 7,010 filings during Q2 of 2018, indicating that New York City’s economic engine remains revving.
The submitted filings would create nearly 30 million square feet of new development that runs the gamut from single-car garages to multi-million-square-foot distribution centers. Nearly half of the footage is residential, just over one-third is commercial, and the rest is split between functions such as education and utilities. The proposals would supply nearly 10,000 new residential units, in buildings that range from numerous one- and two-story, single-unit properties to a 47-story skyscraper in Brooklyn.
YIMBY’s Q2 2020 report breaks down the data in a series of charts. (Note that in regard to occupancy, the compilation only considers the filing’s primary function, so data may vary for mixed-use buildings.)
Number of filings per proposed occupancy
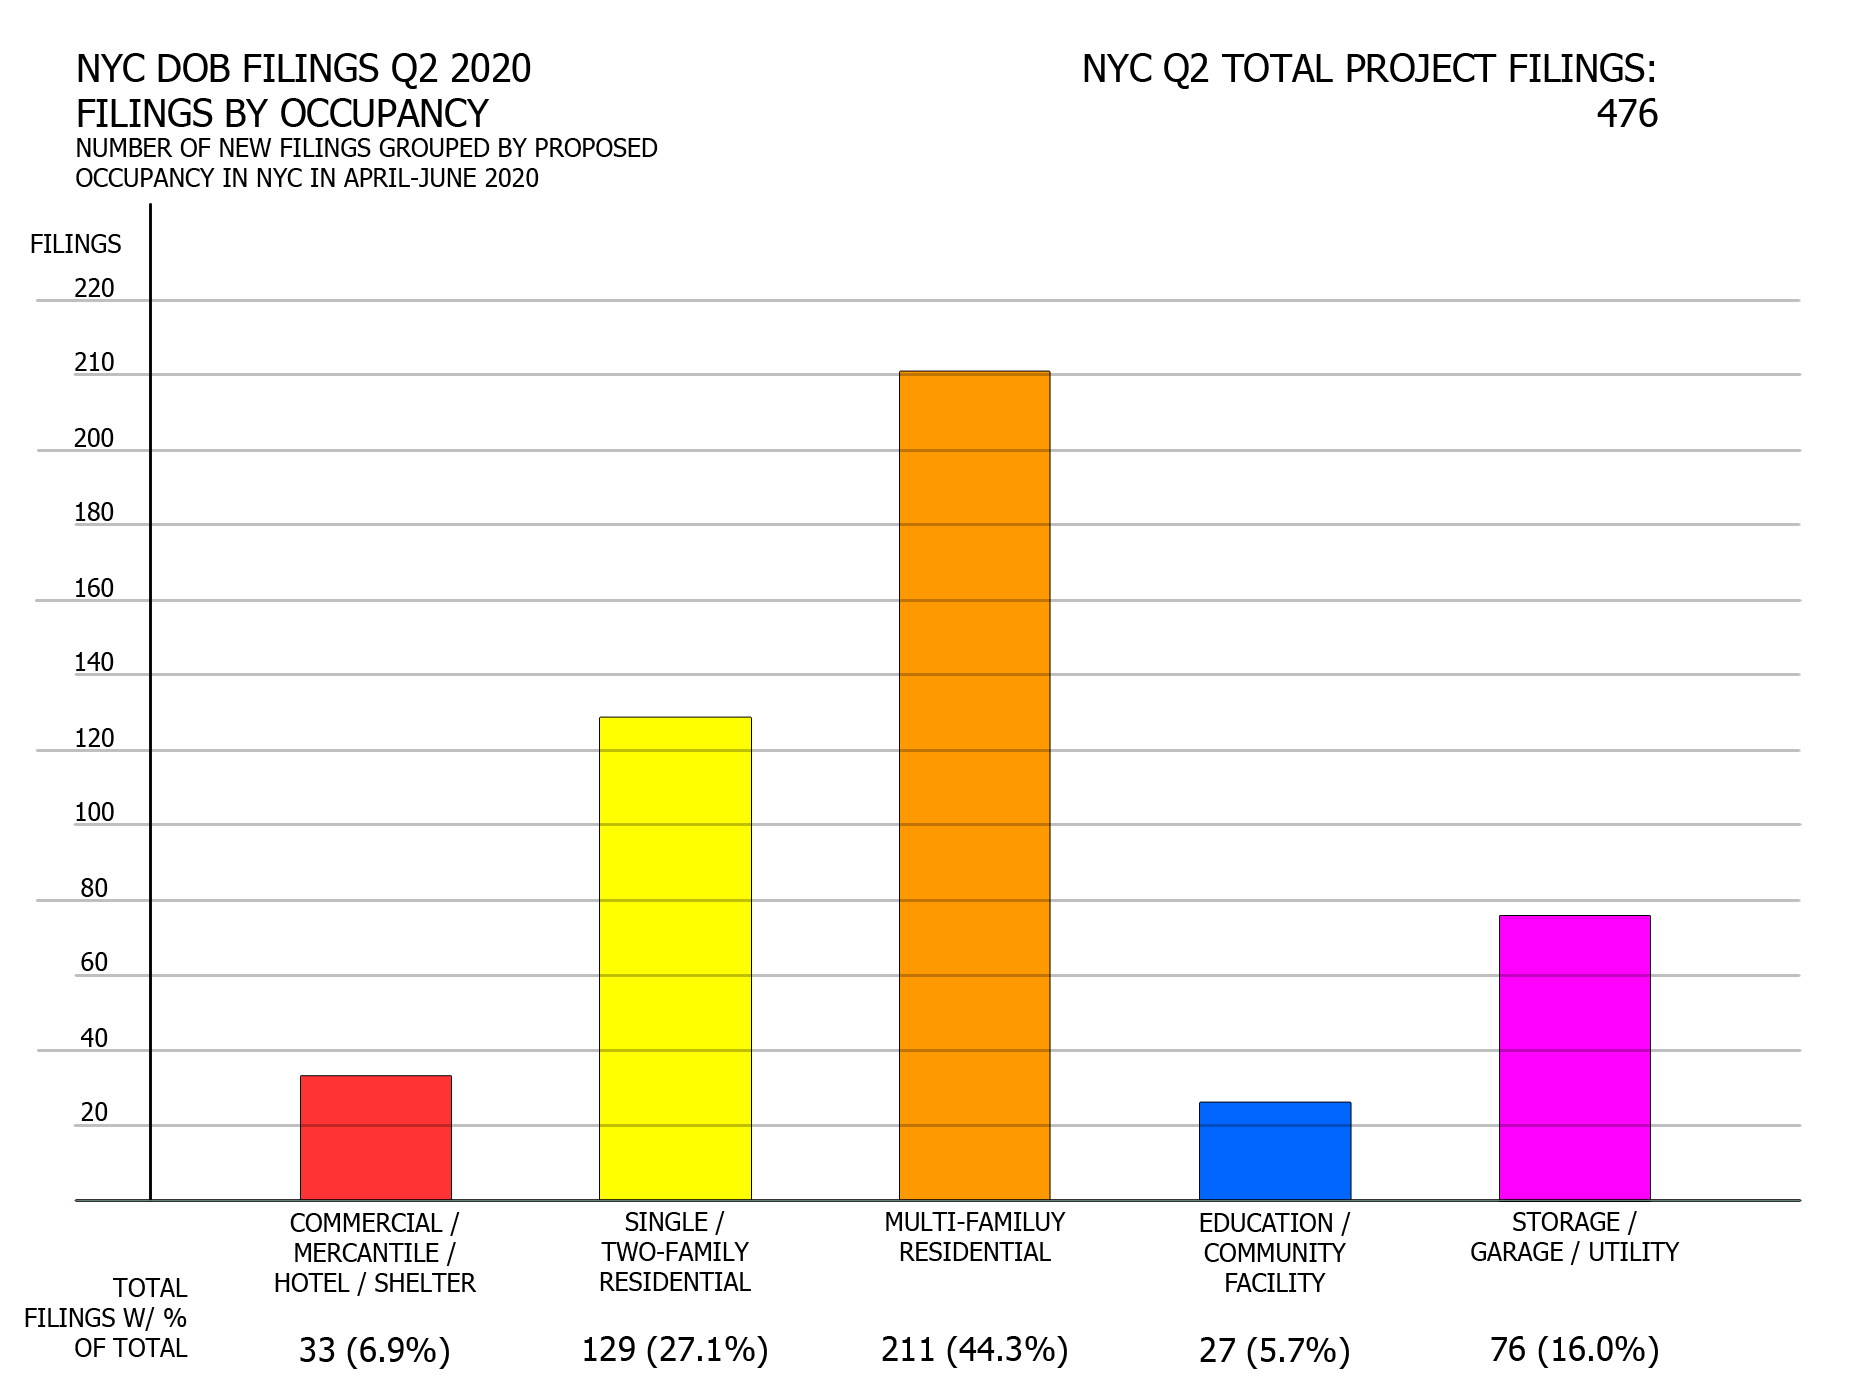
NYC Q2 2020 filings – Number of filings per proposed occupancy. Image credit: Vitali Ogorodnikov
Residential proposals dominate with a combined 340 filings that comprise almost three-quarters of the total. In addition, many entries in the utility category are garages associated with existing or proposed dwellings. An encouraging sign is that multi-family proposals (211 filings) far outweigh the one-and two-family counterparts (129 filings), meaning that dense residential structures remain the dominant development mode even when low-density outlying districts are taken into consideration.
The relative lack of commercial proposals (33 filings), which barely outpaces education/community facility filings (27), is somewhat jarring when juxtaposed against the supertall office giants that continue to rise on the skyline, most notably at Hudson Yards. On one hand, this trend may reflect reluctance by developers to commit to massive office buildings as many companies consider permanent work-from-home arrangements. On the other hand, recent proposals such as the $2 billion Innovation QNS complex proposed in Astoria with 400,000 square feet of commercial space, the Anable Basin development (former proposal site of Amazon HQ2) in Long Island City with several office towers, and other projects point to a renewed confidence in the city’s future.
Perhaps the most interesting fact is that only two filings are explicitly listed as “hotel” (27-story 15 Beekman Street in the Financial District and 26-story 107 South 6th Street in Williamsburg) and with two more designated as “hotel / shelter” (seven-story 144-20 Liberty Avenue in Jamaica and five-story 169 Empire Boulevard in Crown Heights), a far cry from the last decade’s hotel-building bonanza.
Floor area per proposed occupancy

NYC Q2 2020 filings – Floor area per proposed occupancy. Image credit: Vitali Ogorodnikov
While the filing count for commercial proposals, which account for just seven percent of the total, is underwhelming, proposed commercial square footage paints a markedly different picture, making up a whopping 40 percent of the all-use total (11 million square feet). However, most of this space comes from two mammoth structures at 526 Gulf Avenue in Staten Island, a pair of Amazon distribution centers each measuring at 4,993,437 square feet. Together, the nearly ten-million-square-foot pair accounts for over 80 percent of the city’s total proposed commercial space, or one-third of all of the proposed square footage in New York City in the second quarter of 2020.
The online retailing giant is also responsible for a boost to the storage/utility category, albeit a much more modest one than the one mentioned above. A 455,305-square-foot building proposed at 35-15 19th Avenue in Astoria accounts for one-fifth of the category’s total floor area (2.7 million square feet).
Multi-family residential filings maintain a remarkably similar percentage to that of total filings. In contrast, due to their modest average size, single/two-family homes have seen a precipitous drop, with 1.5 million square feet that account for just five percent of the city total despite making up 27 percent of total filings, as opposed to the 13.3 million square feet that comprise multi-family residentials.
Filings grouped by floor count
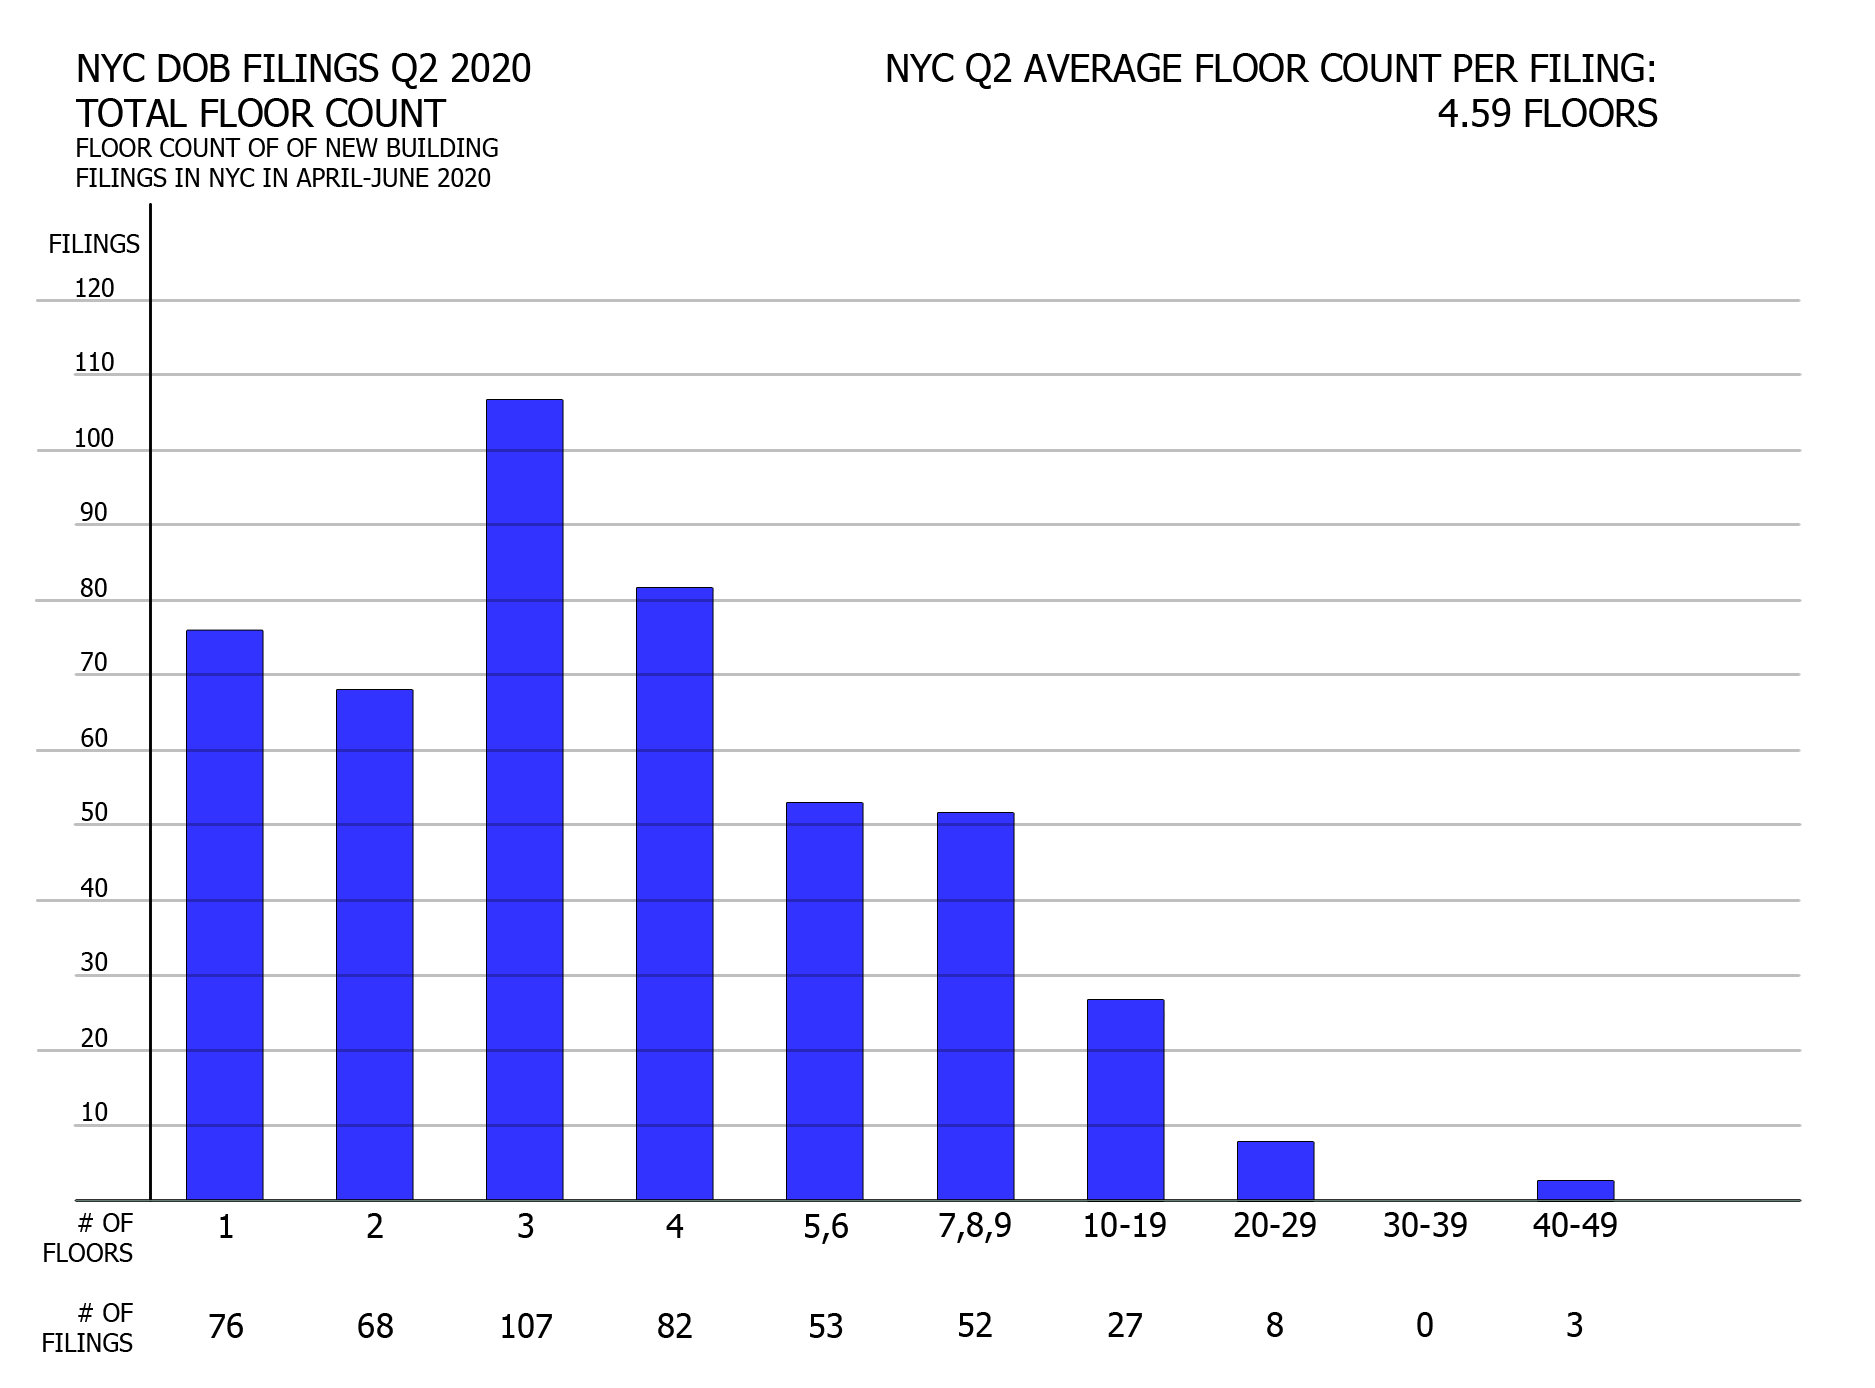
NYC Q2 2020 filings – Filings grouped by floor count. Image credit: Vitali Ogorodnikov
New York City boasts arguably the world’s most impressive skyline, yet low- and mid-rise buildings still comprise the bulk of its cityscape. As such, it is hardly surprising that the majority (70 percent) of new filings in Q2 fall into the low-rise category of one to four stories, with another 22 percent ranking as mid-rises (five to nine stories). The remaining eight percent consist of 38 proposed buildings that would rise ten stories and higher, consisting chiefly of multi-family apartment buildings. The tallest non-residential buildings would be the 27- and 26-story hotels at 15 Beekman Street in the Financial District and 107 South 6th Street in Williamsburg, respectively.
Curiously, at least in this round, Manhattan surrenders the height crown to Brooklyn. Kings County is home to five of the top-ten tallest (by floor count) proposed buildings, including three of the tallest proposals: 180 Ashland Place (47 floors), 700 Atlantic Avenue (41 floors, listed in permits as 698 Atlantic Avenue), and 111 Willoughby Street (40 floors). The only top-ten floor-count filing outside the two boroughs sits in the Bronx, where CetraRuddy Architecture plans to construct a 27-story tower at 201 Third Avenue in the rapidly growing neighborhood of Mott Haven.
Filings grouped by floor area
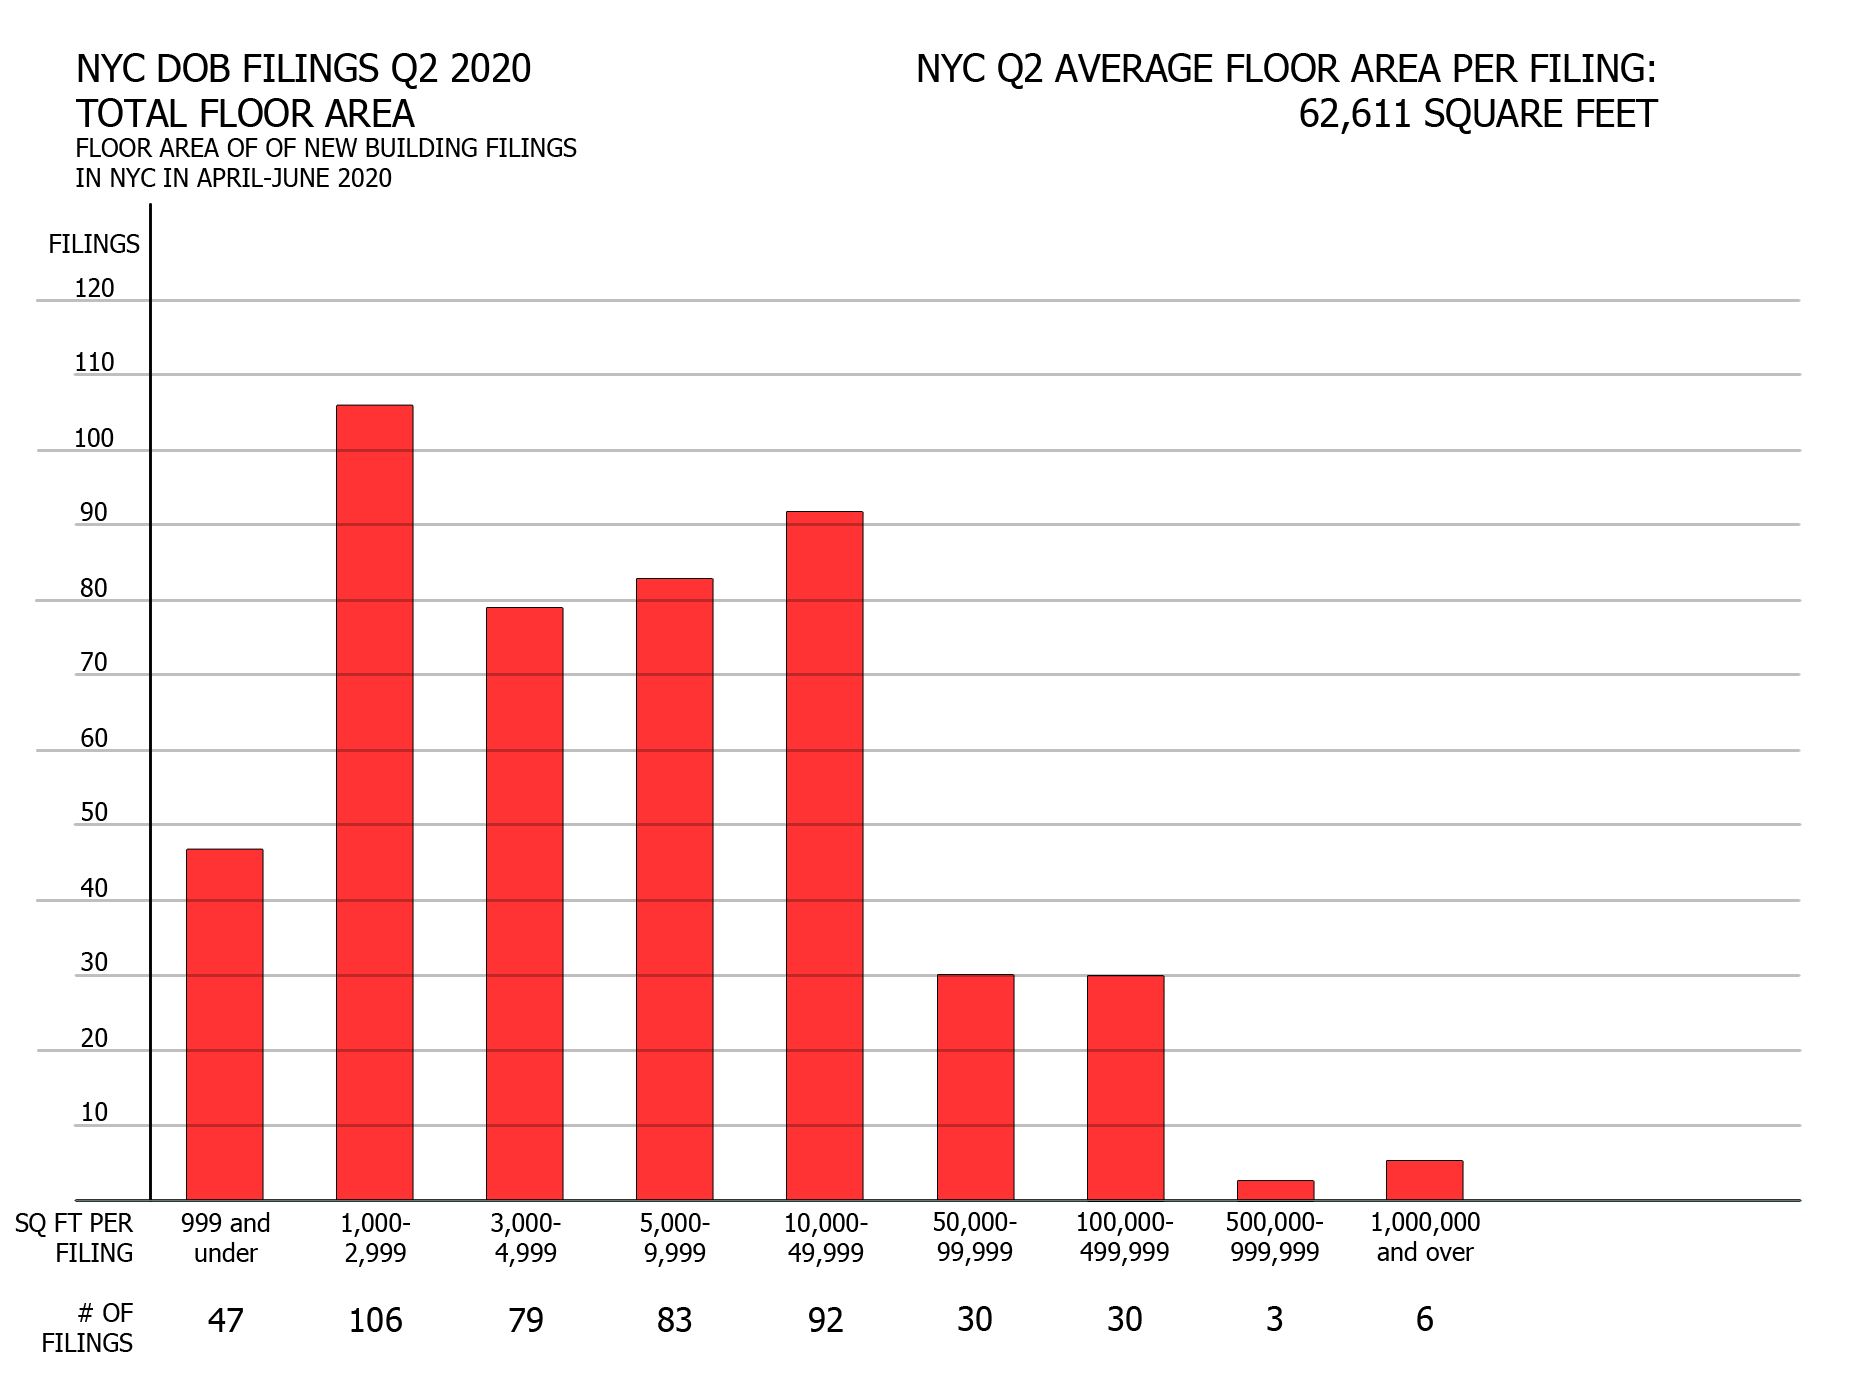
NYC Q2 2020 filings – Filings grouped by floor area. Image credit: Vitali Ogorodnikov
Among new filings in the second quarter, the most prevalent category spans from 1,000 to 3,000 square feet, which includes almost all of the single/two-family home proposals. The lower category (below 1,000 square feet) generally consists of garages and storage.
Total filing numbers drop off precipitously at 50,000 and 500,000 square feet; however, these numbers only show one side of the picture. The six filings in the 1,000,000-square-foot-plus range account for just one percent of the total Q2 filings, yet contain just over one-half of the total floor space proposed during the period.
Number of filings per borough
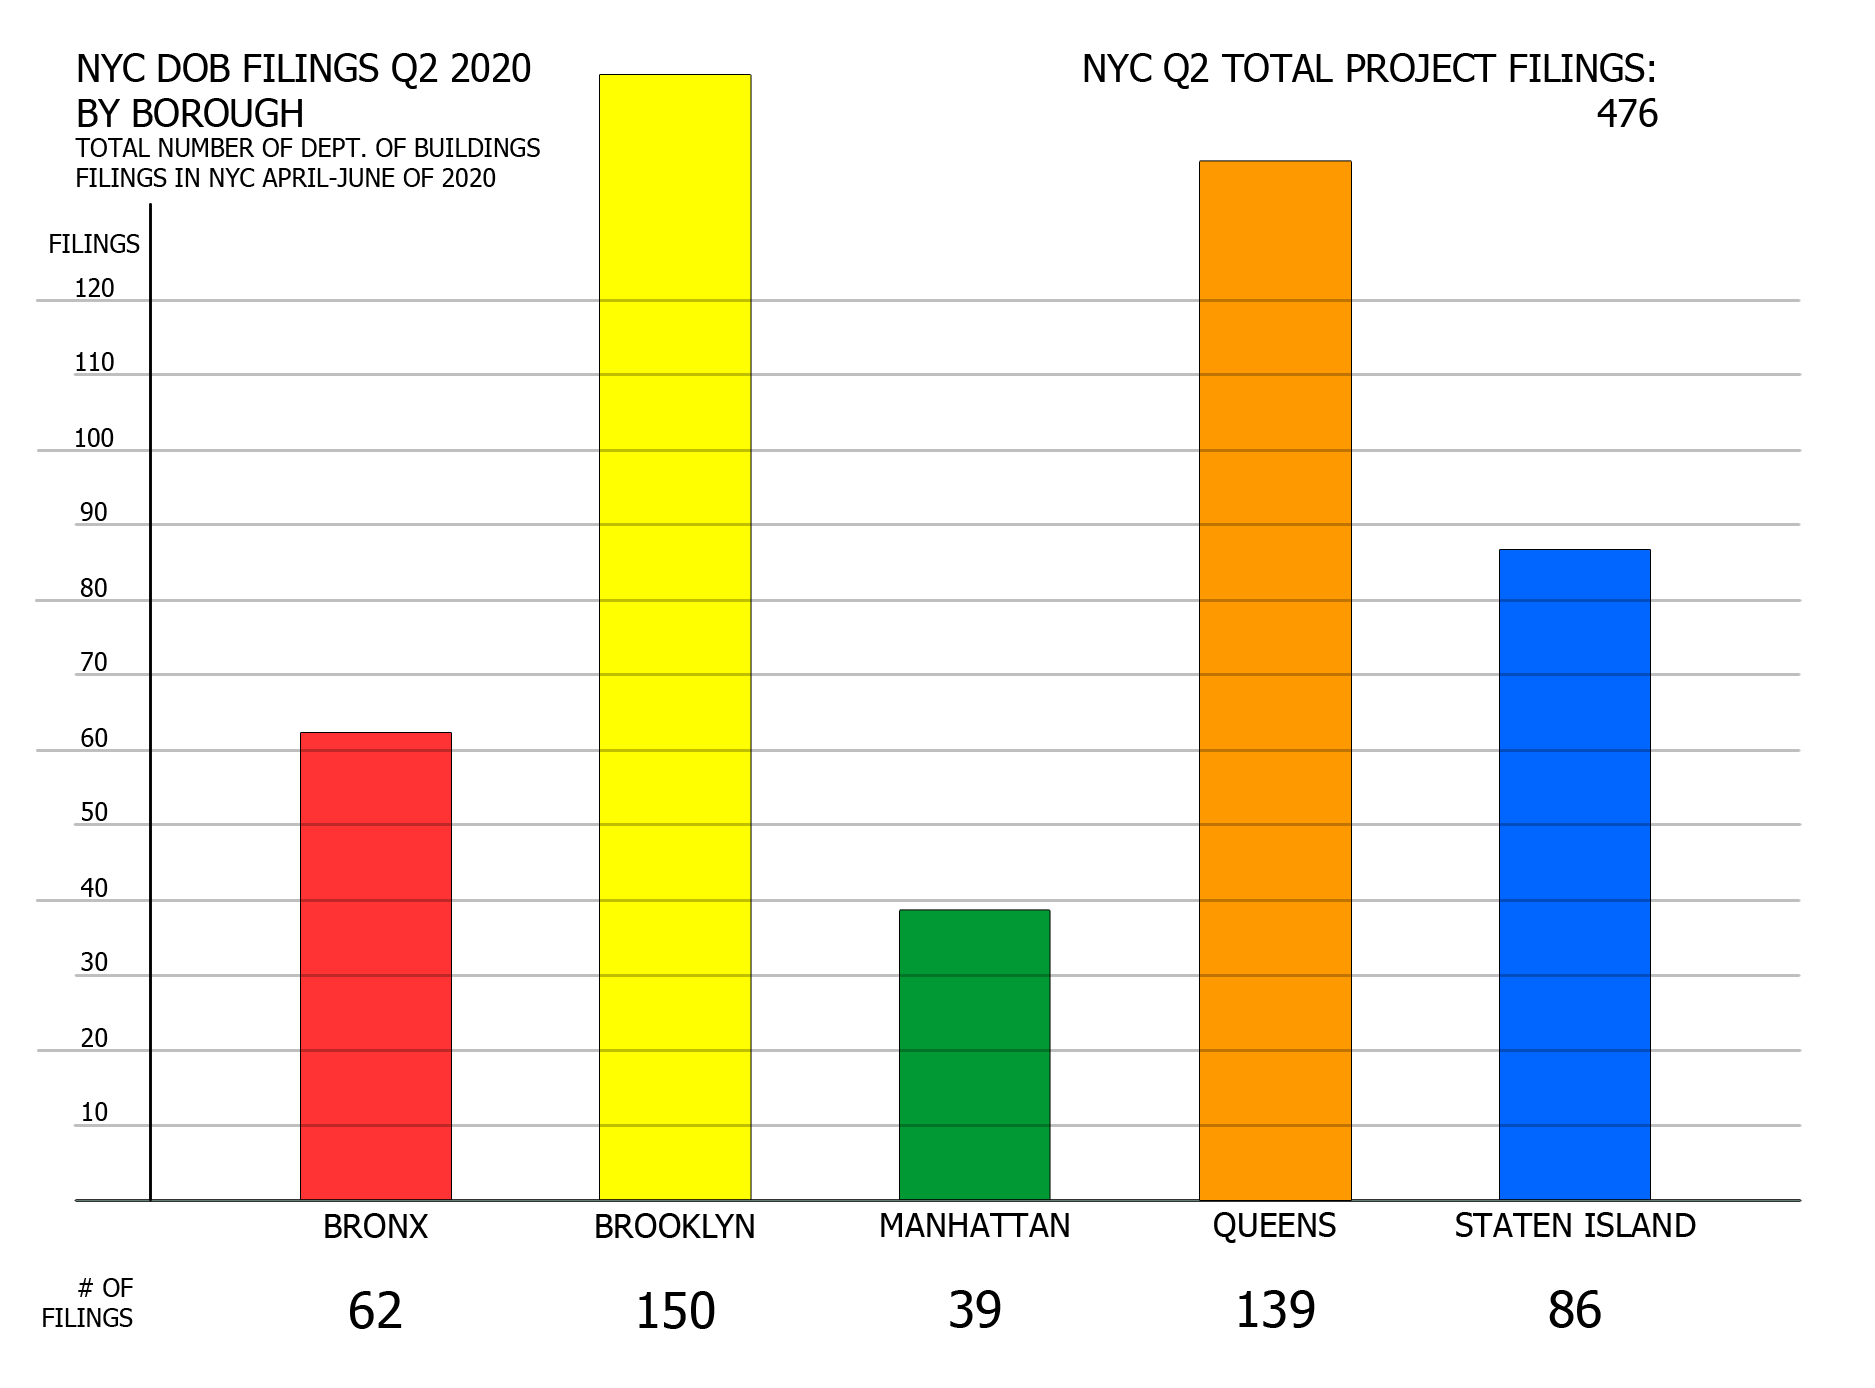
NYC Q2 2020 filings – Number of filings per borough. Image credit: Vitali Ogorodnikov
Brooklyn has reigned as the Big Apple’s comeback kid since before the turn of the millennium. Queens has been catching up in recent years, and The Bronx is the current heatseeker poised at the precipice of a renaissance of its own. Though these observations are hardly a secret to any New Yorker, it is still jarring to see Manhattan and its world-renowned skyline trail so far behind the quartet of oft-dismissed “outer boroughs.” In the second quarter of 2020, Brooklyn leads the pack with 150 filings, Queens trails slightly behind with 139, followed by Staten Island with 86, The Bronx with 62, and Manhattan rounding off the group with 39 proposals.
Average floor count per borough
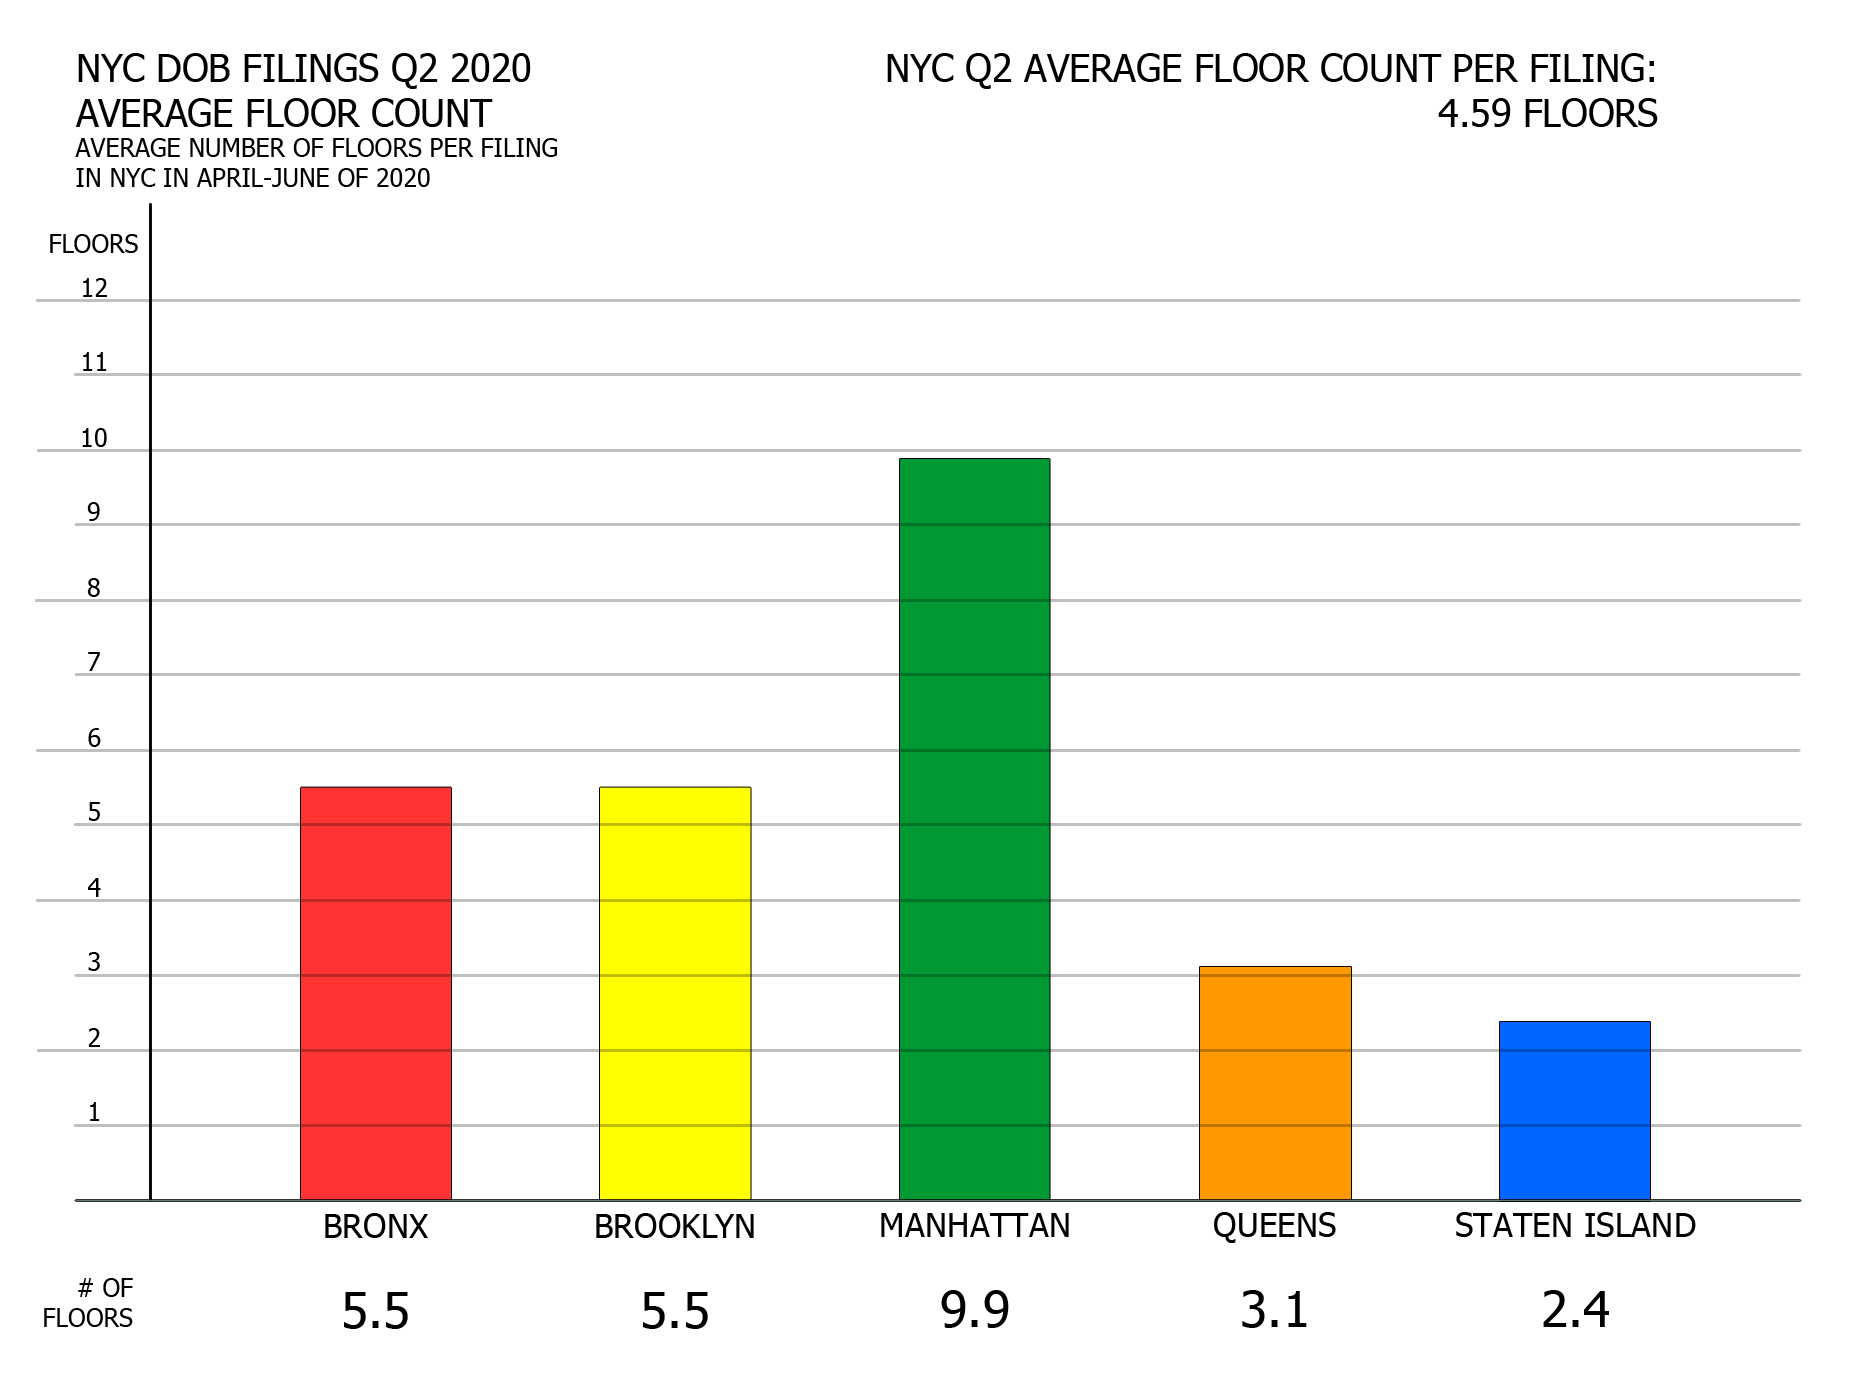
NYC Q2 2020 filings – Average floor count per borough. Image credit: Vitali Ogorodnikov
There are few, if any, surprises when it comes to average floor count per filing. As expected, densely built Manhattan leads with its 9.9-story filing average. The Bronx and Brooklyn, both profoundly urban boroughs with low-density peripheries, are tied at a mid-rise 5.5 floors per average filing, though Brooklyn shows a greater range where a handful of taller buildings balance a greater number of lower-floor filings.
Despite its rapidly rising skyline in Long Island City, vast low-zoned swaths of Queens drag its average floor count to fourth place (3.1 average floors). As expected, low-rise filings predominate in Staten Island (2.4 average floors), where the tallest building proposed in Q2, 475 Bay Street in Stapleton Heights, counts 12 floors and 274 residential units.
Total proposed floor area per borough
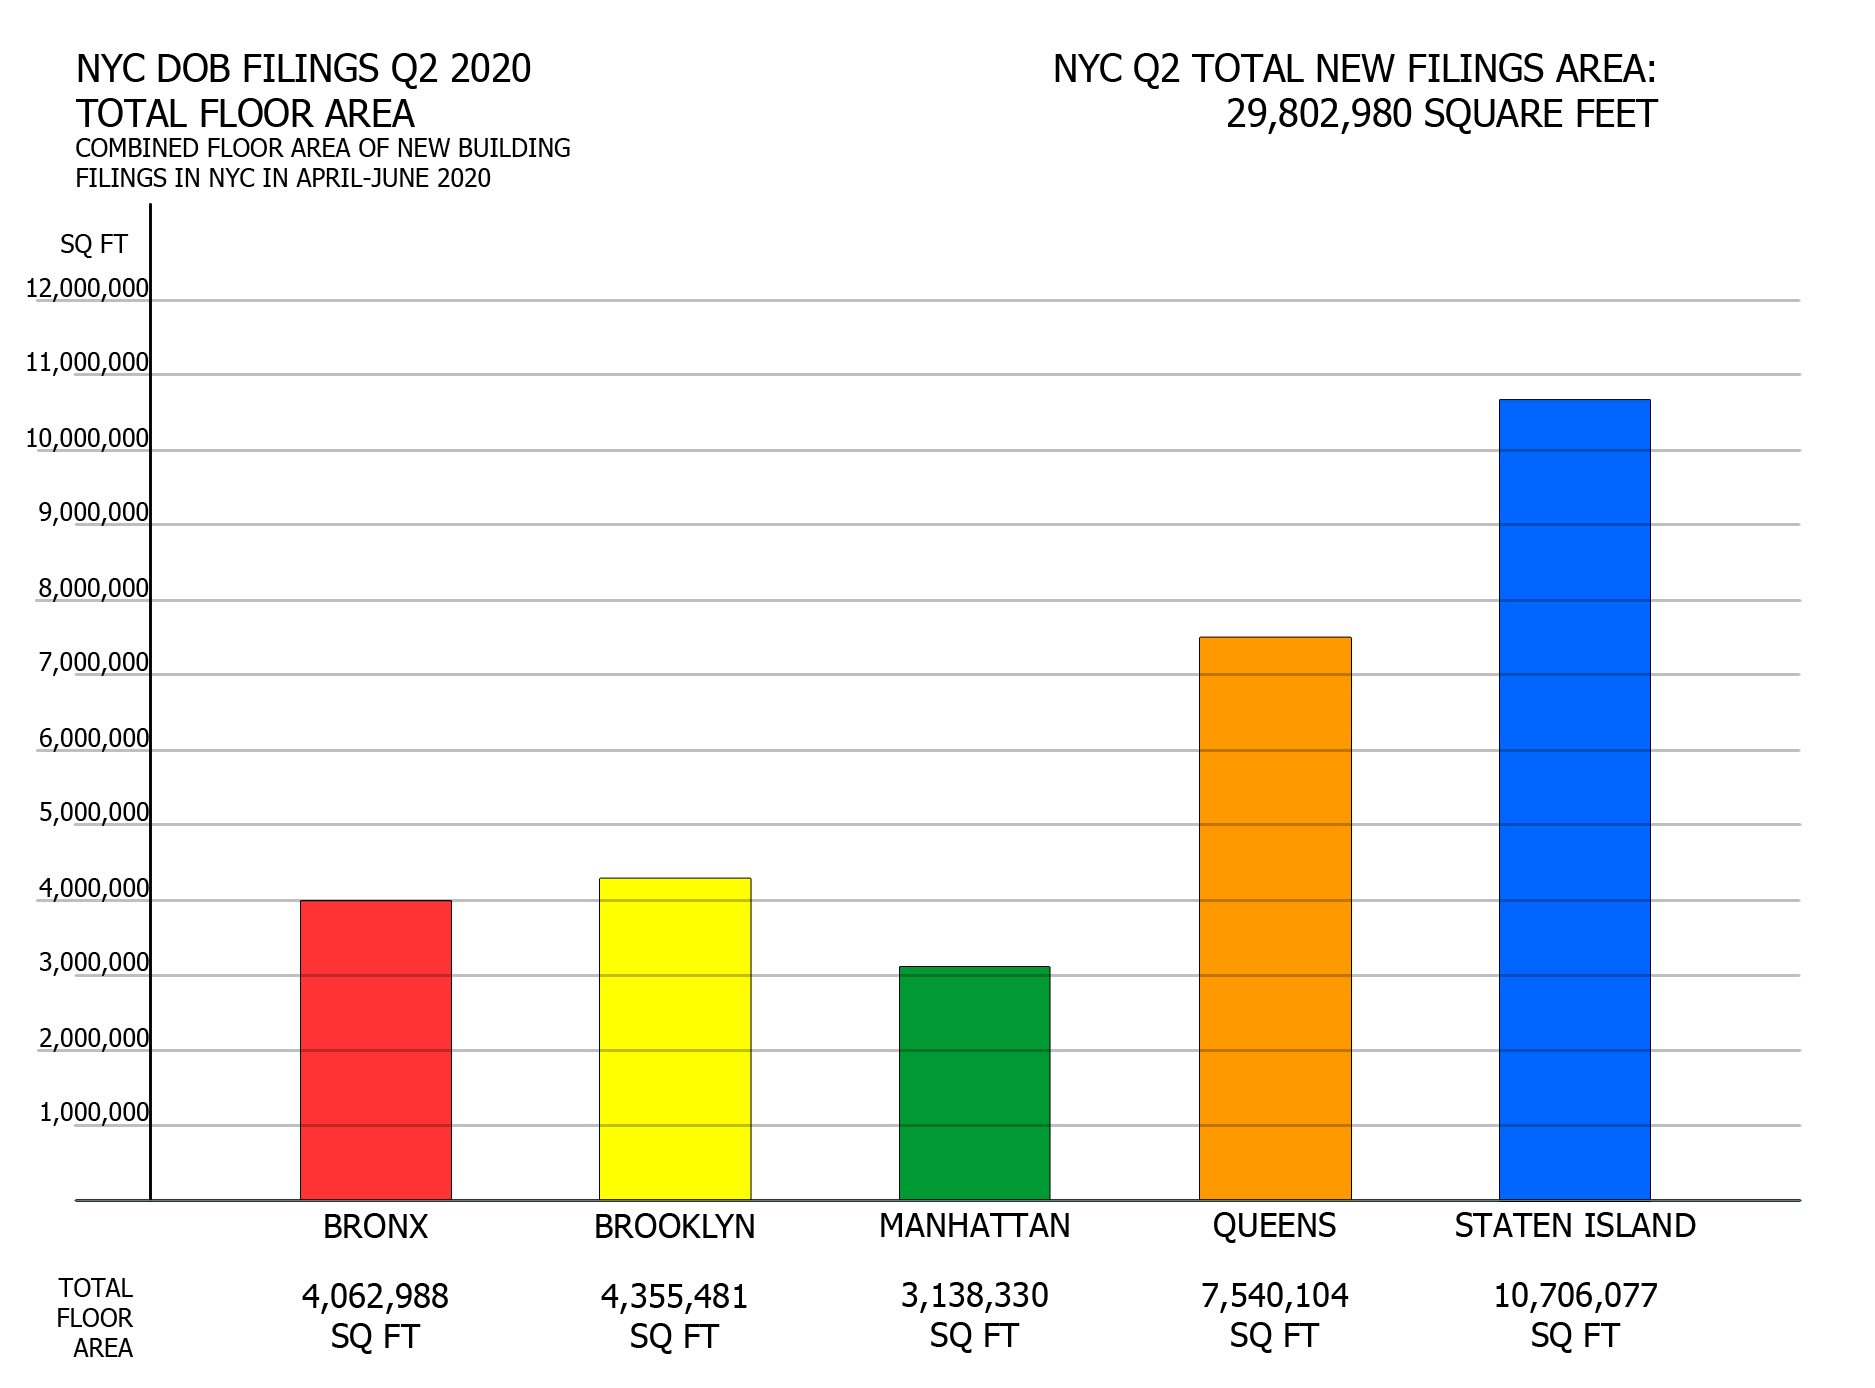
NYC Q2 2020 filings – Total proposed floor area per borough. Image credit: Vitali Ogorodnikov
As opposed to the average floor count chart, the by-borough square footage breakdown appears more puzzling at first glance. Brooklyn, the leader by total filing count, barely edges out the Bronx and Manhattan in terms of total proposed square feet (4.3 million square feet), despite doubling and tripling their filings counts respectively (4.1 and 3.1 million square feet). By contrast, Queens (7.5 million square feet) and Staten Island (10.7 million square feet) surge well ahead, with the latter accounting for a whopping one-third of the city’s total proposed footage. So what’s the deal? Why are the two of the city most sparsely-built boroughs getting the most intense development? Is Staten Island becoming the new construction hotspot?
Alas, despite its promising numbers, Staten Island is hardly about to sprout a brand new skyline. The explanation lies with the ample available land within SI as well as Queens, where the outlying areas of the two sprawling boroughs retain plenty of space for low-rise, large-footprint development, particularly of the commercial/warehouse type.
The city’s fourth-, fifth-, and sixth-largest filings for Q2 (17-21 Redfern Avenue, 20-12 Mott Avenue, and 21-02 Mott Avenue) are all part of the mid- to high-rise Rockaway Village complex, which will bring much-needed density to the neighborhood. Its location between two terminal stations, the Far Rockaway-Mott Avenue station of the A train and the Far Rockaway station of the LIRR Rockaway branch, make for a perfect local hub despite its location blocks away from the city border.
The case is even more pronounced in Staten Island, where the two Amazon distribution centers comprise roughly 93 percent of total floor space proposed in the borough. Without these, SI’s proposed square footage would trail far behind every other borough despite its relatively high number of individual project filings.
Average floor area per borough

NYC Q2 2020 filings – Average floor area per borough. Image credit: Vitali Ogorodnikov
Amazon’s gargantuan twin filings in Staten Island grant it an average of 124,489 square feet, the greatest average proposed floor area per filing of any borough. Without them, SI would come in at a measly 8,562 square feet per average filing, reflective of its preponderance of proposed single/two-family homes and garages. By contrast, the high figures for Manhattan (80,470 square feet) and the Bronx (65,532 square feet) reflect consistently larger and taller proposals. In Queens, the three sizable proposals in Rockaway Village lend it an average almost twice that of Brooklyn (54,245 square feet versus 29,036 square feet), without which the World’s Borough would register just below Kings County at a would-be average of 24,886 square feet.
Filings by borough and occupancy

NYC Q2 2020 filings – Filings by borough and occupancy. Image credit: Vitali Ogorodnikov
While residential proposals dominate across the city, each borough shows its local flavors. Unsurprisingly, not even one single/two-family home was proposed in Manhattan, and only a handful are on the drawing board for the slightly less dense Bronx. Brooklyn, the city’s most populous borough, holds a healthy lead over the competition in terms of multi-family apartment building filings (105). Sprawling Queens and Staten Island account for the lion’s share of single/two-family proposals (54 and 58, respectively), both with a marked uptick in storage/utility filings that largely represent proposed garages (35 and 23). In a near-perfect reversal of Manhattan’s scenario, all but one residential filing in Staten Island is single/two-family, which is a shame because the borough is long overdue for a dense urban core for its transit-accessible downtown in St. George.
Total proposed units per borough

NYC Q2 2020 filings – Total proposed units per borough. Image credit: Vitali Ogorodnikov
The prior chart (filings by borough and occupancy) paints Brooklyn as the clear leader in multi-family residential filings, so it naturally leads in proposed apartment filings with 4,490 units on the drawing board. Compare the figure with Staten Island, which counts roughly half the number of residential filings overall yet only eight percent of Brooklyn’s total unit count (364 filings). Queens is currently in the middle of the pack (1,595 filings), yet recent proposals such as those at Anable Basin and Kaufman Astoria indicate that the borough’s proposed unit total may take the top spot in the coming months.
Average number of units per residential filing per borough
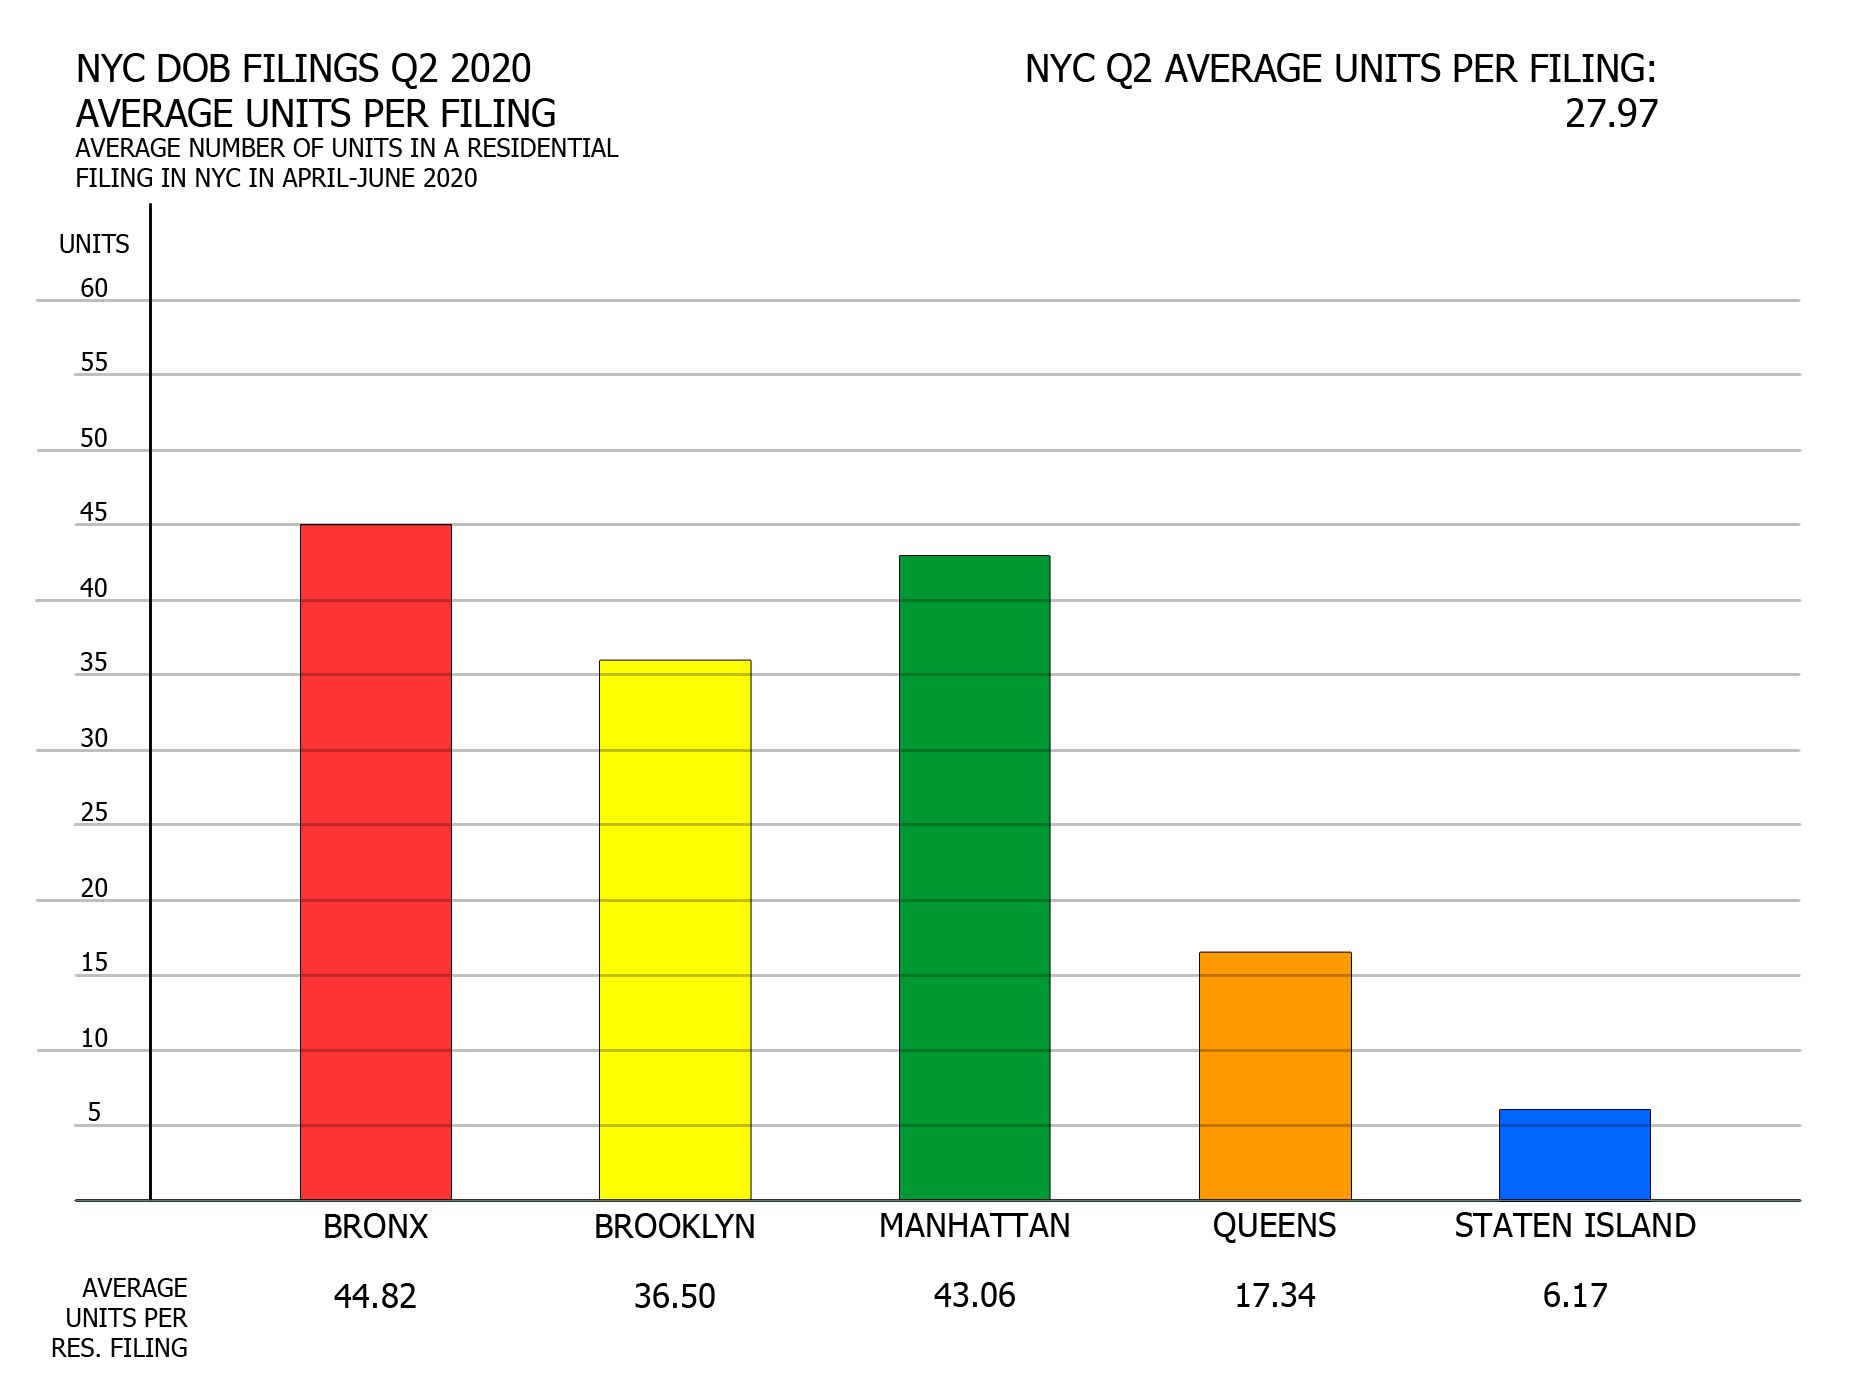
NYC Q2 2020 filings – Average number of units per residential filing per borough. Image credit: Vitali Ogorodnikov
Yet another chart shows that dense residential development is the name of the game in the Bronx, Brooklyn, and Manhattan, which average 45, 37, and 43 units per residential proposal, respectively. The Bronx counts seven proposed dwellings with 100-plus units and 28 more with ten to 99 apartments. For Brooklyn, the numbers are nine and 46, respectively. For Manhattan, the totals are five and 20. For Queens, the count is three and 16, explaining its significantly lower average. The case is most acutely pronounced in Staten Island, where of the 59 residential proposals, only one (475 Bay Street) would include more than two units, though its 12 floors and 274 apartments would provide a welcome boost in density.
Number of filings per month by borough
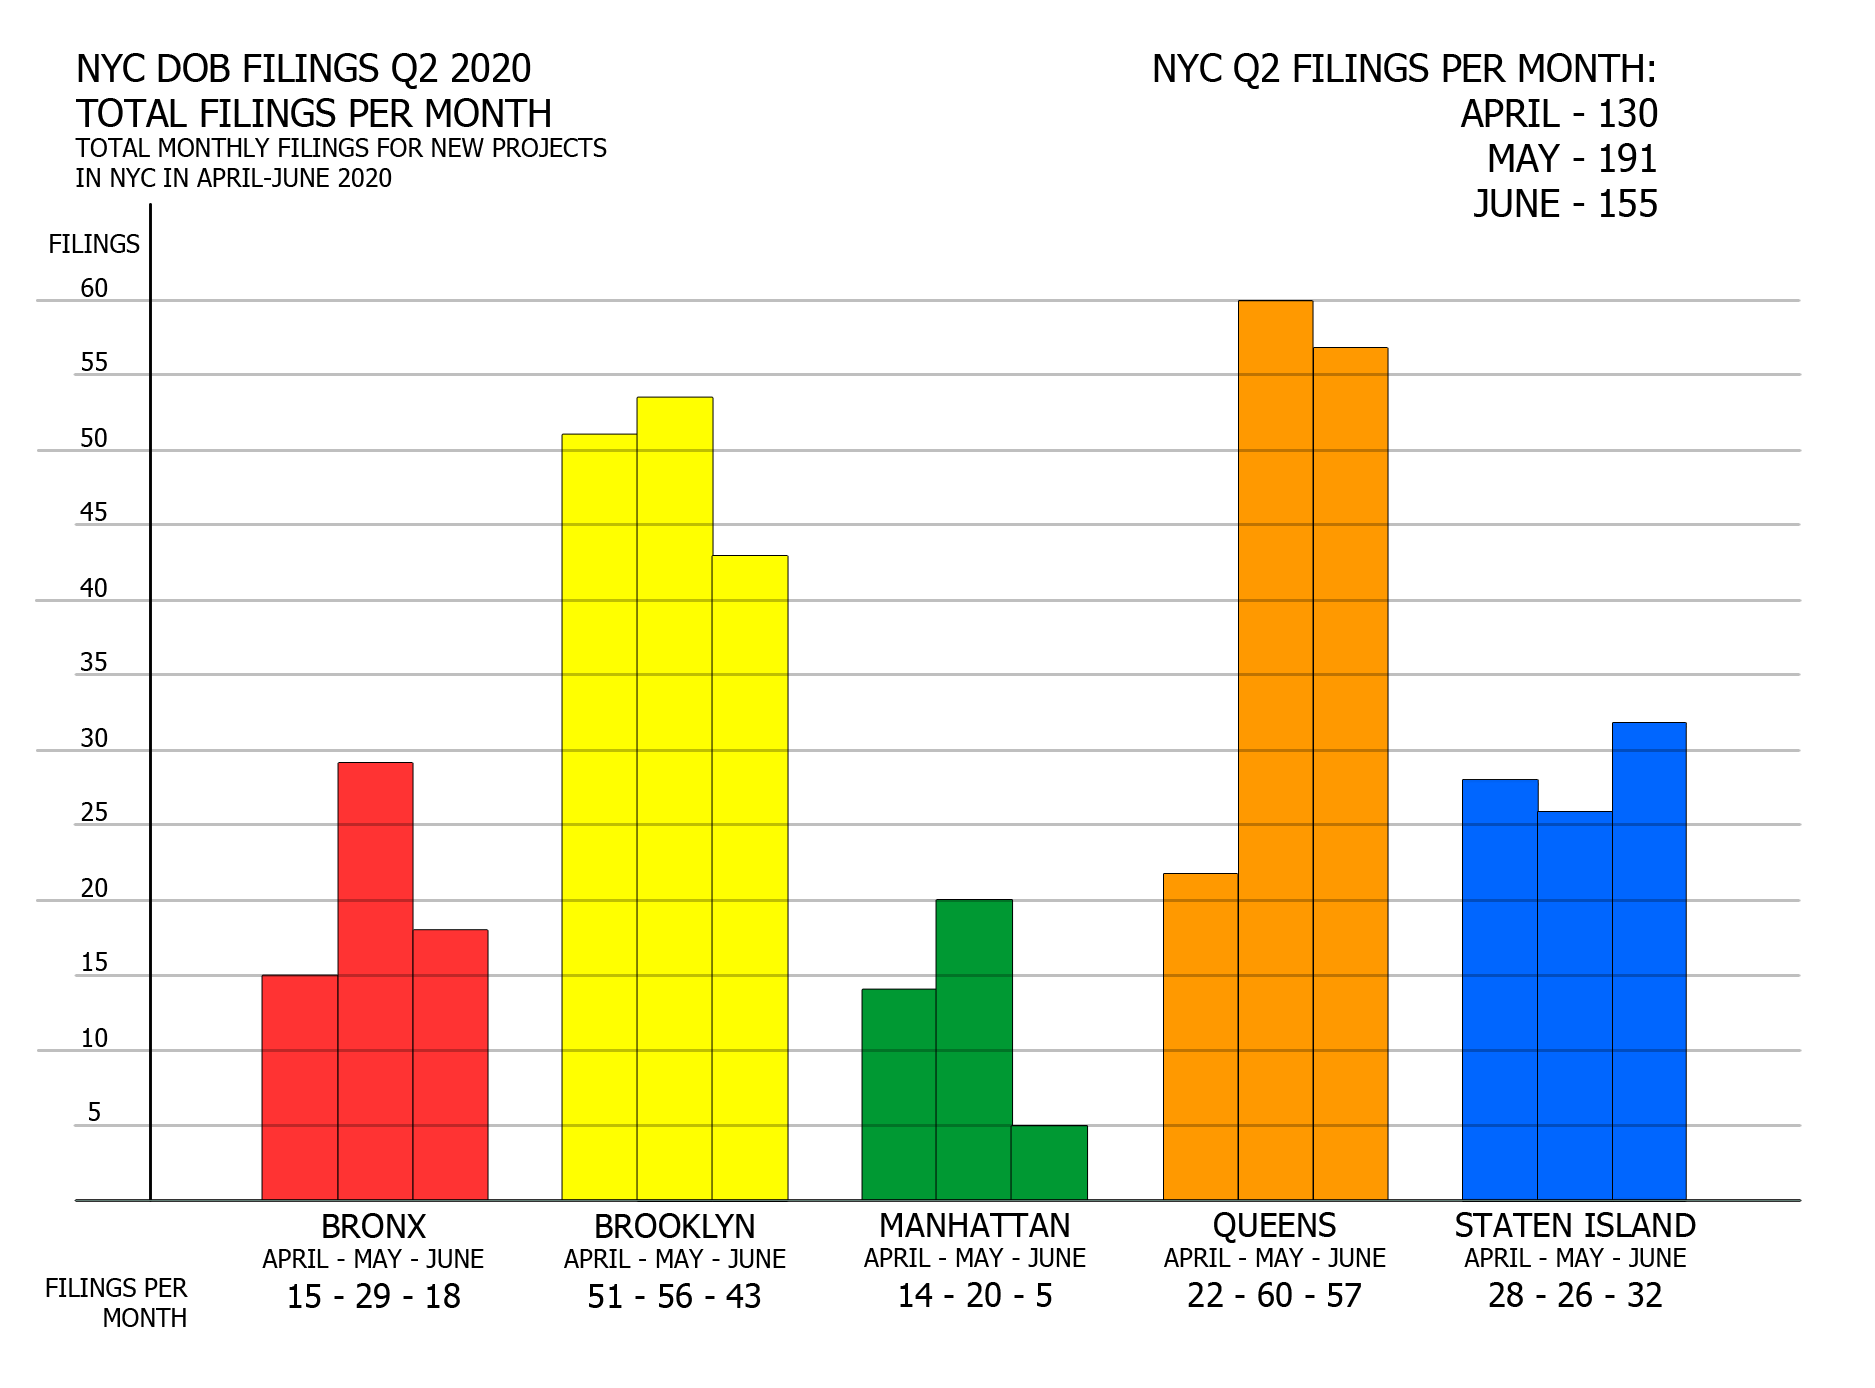
NYC Q2 2020 filings – Number of filings per month by borough. Image credit: Vitali Ogorodnikov
The turbulence of the past few months have given developers plenty of reason for caution, particularly during the months of April and June. Consequently, four out of five boroughs show a decline in filings in those two months, most notably the Bronx and Manhattan. Queens saw the sharpest drop in an otherwise well-performing real estate market in April.
The outlier is Staten Island, the only borough to show a slight increase in filings in both April and June. Perhaps this is because its predominance of small-scale, single/two-family development follows a different trajectory than high-density, high-stakes development elsewhere in the city. Or perhaps it is an indicator of larger real estate trends. For instance, the luxury residential market was already cooling off by the first quarter of the year.
Outlier
The above data omits one very curious filing, submitted on June 8, where something tells us that the filing is rather bogus. For starters, it is listed at 1 Bogus Lane in Manhattan, an address that doesn’t exist in the borough. The office building would stand 10,000 feet tall, five-and-a-half times the height of One World Trade Center, yet count only 30 floors. Moreover, its zoning floor area of 12 square feet means that each floor would average at less than half a square foot. The filing appears to be submitted by none other than Mr. Chuck Norris. It looks like either the martial artist/Hollywood star/2000’s meme is seeking to build what appears to be a space elevator, judging by the project’s listed proportions, or someone is pulling a fast one on the Department of Buildings, namely whoever stands behind the listed owner moniker of “Chuck’s Enterprise.”
The answer appears somewhat more prosaic. The DOB page lists several permits under the address, several of which either clearly label it as a “test job” for internal use, or even resort to flat-out gibberish text soup often associated with, well, test projects of one sort or another. However, to data sleuths, 1 Bogus Lane serves as a reminder to be careful when analyzing numbers, lest we announce that Chuck Norris is planning a two-mile-high skyscraper in Manhattan.

Billionaire’s Row in Midtown on June 30th, the last day of the second quarter of 2020. Credit: Vitali Ogorodnikov
Statistical numbers and data are much more than abstract figures and bar graphs. New construction jobs offer a means of livelihood for thousands of workers and their families. New apartments will help alleviate the acute housing crisis, where a limited supply and a pent-up demand inflate housing prices to sky-high levels. New commercial space will maintain competitiveness and pump vitality into the city’s mighty commercial engine. New schools will accommodate the upbringing of future generations. New York City has persevered through dark times before, and continues to soldier on in the face of whatever adversities stand in its way.
Subscribe to YIMBY’s daily e-mail
![]()
Follow YIMBYgram for real-time photo updates
Like YIMBY on Facebook
Follow YIMBY’s Twitter for the latest in YIMBYnews


The Chuck Norris bit near the end made me crack up. Nice to see construction continue despite the impact of COVID-19.
Agreed. And SO welcome. Now, if we can only do something about our anti-NYC mayor…
Wow that was unusual. I just wrote an incredibly long comment but after I clicked submit my
comment didn’t show up. Grrrr… well I’m not writing all that over again. Anyway, just wanted
to say excellent blog!